Four host conditions justify waking someone up: a filesystem that will fill before the next working day, available memory under 10% for more than 10 minutes, load per core above 4 for more than 15 minutes, and metrics that stopped arriving at all. CPU at 90% is not on that list, and neither is a 300 ms spike in disk write latency during a backup window. Below are the server monitoring alert thresholds I run, the duration window on each one, and why each earns a phone call rather than a Slack message.
Key takeaways
- CPU utilization above 80% should not page anyone. A saturated CPU is frequently a well used CPU, and the rule fires on every deploy, backup and log compaction.
- Filesystem usage deserves a page at 85% used and below an absolute free space floor. 15% free on a 4 TB volume is 600 GB, 15% free on a 20 GB volume is 3 GB, and only one of those is safe.
- Available memory under 10% of total, sustained for 10 minutes, is worth a page. Instantaneous readings are not, because Linux fills spare RAM with page cache and gives it back on demand.
- Load per core above 4 for 15 minutes is a symptom users can feel. Divide the 1 minute load average by
nprocbefore comparing it to anything. - The most valuable single alert is "metrics stopped arriving". An offline agent catches kernel panics, terminated instances and disks so full the agent died.
Two conditions justify a page, and resource numbers are neither
The first is a symptom a user is feeling right now: requests are slow, requests are failing, or the service is unreachable. The second is a condition that will certainly break something soon and has a fix window long enough for a human to act. A filesystem at 91% climbing 2 GB an hour is the clearest example of the second.
Raw resource numbers fall into neither bucket. CPU at 88% might mean a batch job is doing exactly what you built it for, and memory at 92% used might mean the page cache is warm. Both fire constantly, both are usually fine, and both train the on-call engineer to swipe the notification away without reading it. That habit is how alert fatigue starts, and it costs more than the incident you were trying to catch.
Do not page on CPU above 80%
A CPU is a resource you paid for, and running it at 85% during business hours means the sizing is right. A CPU threshold also correlates poorly with what users experience: a single busy core on a 16 core box never registers, and a box running a nightly pg_dump trips the rule at 02:00 every night.
Look at the per core breakdown first. mpstat ships in the sysstat package (apt install sysstat on Debian and Ubuntu, dnf install sysstat on RHEL, Rocky and Alma).
mpstat -P ALL 1 3Linux 5.15.0-91-generic (web-01) 07/25/2026 _x86_64_ (4 CPU)
10:14:02 CPU %usr %nice %sys %iowait %irq %soft %steal %guest %gnice %idle
10:14:03 all 62.31 0.00 8.02 0.25 0.00 0.50 0.00 0.00 0.00 28.92
10:14:03 0 64.00 0.00 9.00 0.00 0.00 1.00 0.00 0.00 0.00 26.00
10:14:03 1 61.00 0.00 8.00 1.00 0.00 0.00 0.00 0.00 0.00 30.00
10:14:03 2 63.00 0.00 7.00 0.00 0.00 1.00 0.00 0.00 0.00 29.00
10:14:03 3 61.24 0.00 8.08 0.00 0.00 0.00 0.00 0.00 0.00 30.68That box is 70% busy and healthy: work is spread evenly, %iowait is negligible, and 29% of every core is idle. Two numbers there would change my mind. %steal above 5% on a cloud VM means the hypervisor is taking cycles you paid for, which is a capacity ticket rather than a page. And iowait climbing past 20% while %usr drops means the CPUs are parked waiting on storage.
Keep CPU utilization on a dashboard for right-sizing and let the symptom-level thresholds below do the paging. The collection methods are covered in how to monitor CPU usage on Linux.
Page on disk above 85%, with an absolute floor
A full disk is the rare host metric that guarantees an outage. Postgres stops accepting writes, journald stops logging, and the monitoring agent usually dies before it can tell you why. It also has the longest lead time of any failure here, often several hours, which makes it the ideal thing to page on.
The percentage alone is a bad rule. Look at what 90% means across different volumes.
df -h -x tmpfs -x devtmpfsFilesystem Size Used Avail Use% Mounted on
/dev/nvme0n1p1 194G 158G 27G 86% /
/dev/nvme1n1 3.6T 3.1T 372G 90% /var/lib/postgresql
/dev/sdb1 20G 17G 2.1G 90% /var/logTwo of those rows are at 90%. The Postgres volume has 372 GB of headroom and grows a few gigabytes a day, so it is a capacity conversation for next sprint. The log volume has 2.1 GB and is one unrotated debug log away from taking the host down tonight.
So the rule is a conjunction: used above 85% AND free below an absolute floor. Size the floor per volume, to your largest routine write. A nightly database dump, a container image pull and a log rotation are the three that catch people out. On our boxes the floor is 20 GB for data volumes and 3 GB for /var/log.
Inodes are the other failure a percentage of bytes never shows you. They run out independently, usually on volumes full of small files.
df -i /Filesystem Inodes IUsed IFree IUse% Mounted on
/dev/nvme0n1p1 12943360 1284412 11658948 10% /Growth rate matters more than the level. Two samples an hour apart give a usable estimate of when the volume dies.
A=$(df --output=avail -B1 / | tail -1)
sleep 3600
B=$(df --output=avail -B1 / | tail -1)
awk -v a="$A" -v b="$B" 'BEGIN { if (a>b) printf "%.1f hours to full\n", b/(a-b); else print "not shrinking" }'
41.3 hours to fullForty-one hours is a working-hours ticket. Four hours is a page. Filesystem usage is the one metric where I accept a low threshold and a short duration window, because the false positive rate is close to zero. Rotation strategy and cleanup are covered in how to monitor disk space on Linux and get alerted.
Page on available memory under 10%, sustained
Alert on available memory. Linux uses free RAM as page cache and hands it back the moment a process asks, so "used" on a healthy server drifts toward 100% by design.
free -m total used free shared buff/cache available
Mem: 15997 12894 412 220 2691 2532
Swap: 0 0 0That host reads 81% used with 412 MB free and 2.5 GB available, and it is fine. The available column is the kernel's own estimate of what a new process could claim without paging, and it comes straight from /proc/meminfo.
grep -E 'MemTotal|MemAvailable' /proc/meminfoMemTotal: 16380884 kB
MemAvailable: 2592680 kB2592680 / 16380884 is 15.8% available, above my 10% line. The threshold I page on is available under 10% of total, held for 10 minutes or longer. The duration window does most of the work: a JVM warming up or a Node process loading a large fixture dips under 10% for 40 seconds and recovers, and nobody should be woken for that.
The confirming signal is the OOM killer, which leaves a clean record.
journalctl -k --since "24 hours ago" | grep -i "out of memory"Jul 24 03:12:41 web-01 kernel: Out of memory: Killed process 21847 (node)
total-vm:2183044kB, anon-rss:1584312kB, file-rss:0kB, shmem-rss:0kB,
UID:1000 pgtables:3560kB oom_score_adj:0If that line appears, the threshold was too high or the window too long. Memory utilization and the case for reading available are covered in how to monitor memory usage on Linux the right way.
Page on load per core above 4, sustained
The load average is the closest thing Linux gives you to a saturation metric, with one catch: it counts tasks in uninterruptible sleep, so disk waits inflate it alongside CPU demand. That makes it a better paging signal than CPU, because a user feels both causes.
It only means something once you divide by the core count.
uptime 10:14:05 up 62 days, 3:11, 2 users, load average: 7.42, 6.98, 5.31awk -v cores="$(nproc)" '{printf "%.2f load per core (1m)\n", $1/cores}' /proc/loadavg1.86 load per core (1m)A 1 minute load of 7.42 sounds alarming until you see a 4 core box at 1.86 per core, busy and serving fine. I page at load per core above 4 for 15 minutes, and warn at above 2 for 30 minutes. Compare the 1, 5 and 15 minute figures before acting: 7.42 / 6.98 / 5.31 is a rising trend, while 7.42 / 12.0 / 14.0 is a box already recovering.
Page when metrics stop arriving
This is the alert I would keep if I could keep only one. Every threshold above assumes data is flowing. When a host panics, gets terminated, loses its network path or fills its disk badly enough to kill the agent, every metric rule goes silent and reports nothing wrong.
Agent-based monitoring turns silence into a signal. The Hyperping agent scrapes every 30 seconds and ships over OTLP/HTTP, so a gap past the server's offline threshold, 90 seconds by default with a 60 second floor, means something. Metrics go Stale after a 30 second scrape gap, which is a UI state that pages nobody, then Offline, and Offline opens an outage and fires the escalation policy on that server. An on-disk queue at /var/lib/hyperping/queue covers the case where the agent is alive but ingest is not, which keeps the rule specific to a host that is genuinely gone.
That state machine is the fleet view itself: every host is filed under All, Online, Stale or Offline, and each row carries the moment it was last seen.
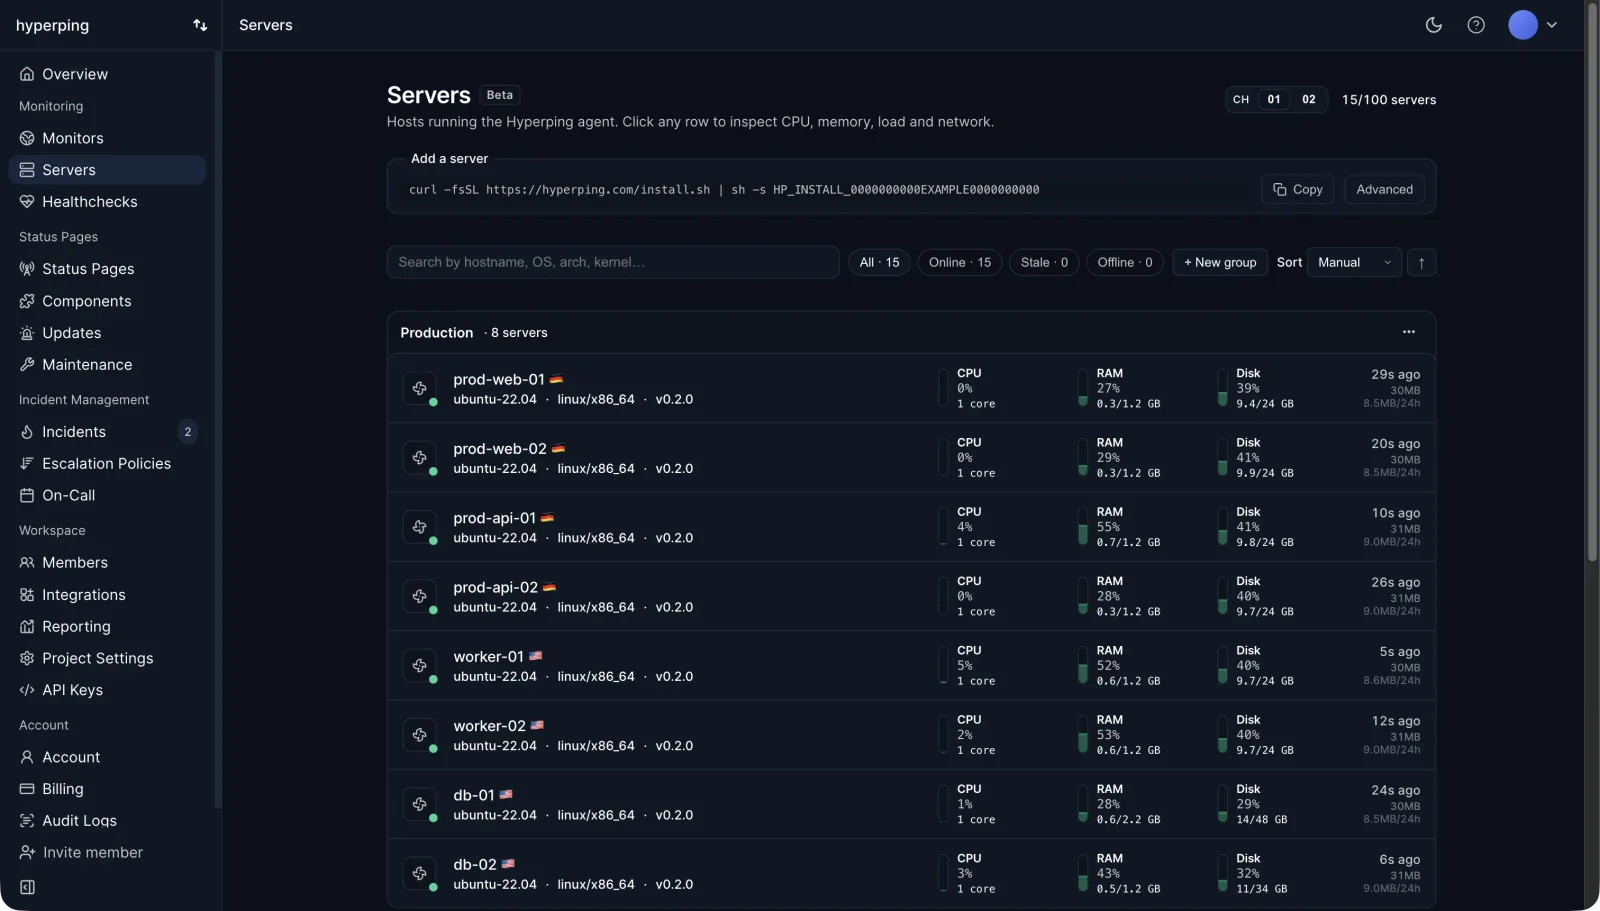
Routing that page is its own job: which channels fire first, when SMS and phone calls take over, and how to keep a flaky link from waking anyone. The walkthrough on how to get alerted when a server goes down covers it step by step.
The duration window is half the threshold
A threshold without a window is a random number generator. At a 30 second scrape cadence, 10 minutes is 20 consecutive samples, and almost nothing transient survives 20 samples. Match the window to how fast the condition can hurt you.
| Metric | Page at | Duration window | Channel |
|---|---|---|---|
| CPU utilization | never | n/a | dashboard only |
| Load per core | above 4 | 15 minutes | page |
| Load per core | above 2 | 30 minutes | warning |
| Available memory | under 10% | 10 minutes | page |
| Available memory | under 20% | 30 minutes | warning |
| Filesystem used | above 85% and free under floor | 5 minutes | page |
| Filesystem used | above 75% | 60 minutes | warning |
| Inode usage | above 85% | 5 minutes | warning |
| Disk I/O throughput | never | n/a | dashboard only |
| Network throughput | never | n/a | dashboard only |
| Metrics missing | agent offline | 90 seconds by default, 60 second floor | page |
Two notes on that table. Inode usage is not part of the agent metric set, so run it as a cron check on the host rather than expecting a graph. Disk I/O and network rates stay on the dashboard because they have no meaningful absolute threshold: 400 MB/s of writes is idle for one workload and a runaway loop for another.
Warnings and pages are two different systems
A warning lands in a channel somebody reads on Tuesday morning. A page rings a phone, has an acknowledgement deadline, and escalates when nobody answers. Sending the same rule to both is how a Slack channel becomes unreadable and a phone becomes ignorable at the same time.
The routing question is short. If "can this wait until 09:00 without harming a customer?" is a yes, it is a warning. If it is a no, it is a page, and it goes through an escalation policy rather than to one person's phone.
That last part matters more than the numbers. An unacknowledged page has to move to the next responder automatically, otherwise your tuned disk threshold fires at 03:00 into a phone that is face down in another room. Tie those pages to an on-call schedule in whatever layer evaluates them, then audit the rules that fired without anyone acting on them. The same discipline applies to external checks, covered in reducing false positive alerts in uptime monitoring.
How to use Hyperping for server alert thresholds
Here is how the rules above sit on top of server monitoring in Hyperping, from a fresh host to a page that reaches a human. One thing to be clear about up front: Hyperping server alerting fires on agent liveness, not on resource levels, so the numeric rules above live in whatever alerting layer reads the metrics and Hyperping covers the case that layer cannot see.
1. Install the agent on every host
Create a server in the dashboard and run the one-line installer it gives you.
curl -fsSL https://hyperping.com/install.sh | sh -s HP_INSTALL_xxxxxThe agent runs under systemd on Linux and launchd on macOS, on amd64 and arm64, with an embedded OpenTelemetry collector and roughly 50 MB of RSS. Windows is not supported yet. Re-running the installer rotates credentials and keeps the same server UUID and history, so your alert configuration survives. See install the agent for the systemd unit and the queue directory.
2. Watch filesystem usage per mount and pick a byte floor
Filesystem metrics arrive per real mount point with device, mountpoint and filesystem type, and pseudo-filesystems are filtered out before ingest. That per-mount split is what makes the conjunction usable: chart the volumes carrying data and logs, and pick a byte floor for each one rather than reusing a single number everywhere.
3. Read available memory, not used memory
Memory arrives as used, available and total, so the number your rule reads is the right one from the start. Point your own under 10% rule at available memory and give it a 10 minute window. At the 30 second cadence that is 20 samples, enough to filter the reclaim behaviour that makes instantaneous readings useless.
4. Keep load, iowait, disk I/O and network on the dashboard
The agent collects CPU time per state including iowait, 1, 5 and 15 minute load averages, a per-CPU breakdown, read and write bytes per block device, and bytes in and out per interface with TX/RX rates derived in the dashboard. Keep the load per core rule in your alerting layer, and keep the rest as the context you open once a page has fired. The full list is in metrics collected.
5. Route agent offline events through an escalation policy
Bind an escalation policy to each server from the Alerting panel so agent Offline events reach an on-call rotation with an acknowledgement deadline. The state machine is fixed: a scrape gap past 30 seconds marks the host Stale in the UI and alerts nobody, and no metrics past the server's offline threshold, 90 seconds by default with a 60 second floor, opens an outage and pages the policy's channels. That threshold is the one number you tune here. Server alerting starts on Essentials at $24 per month billed yearly with 5 agents, and Pro at $74 covers 20. The Free plan collects metrics for 1 server with 2 days of history and no server alerting.
6. Pair server alerts with uptime checks and a status page
Host metrics tell you a machine is unhappy. An uptime check tells you whether customers can reach what runs on it, the symptom that outranks every number in this post. Run both against the same server, and publish a status page so an incident does not also fill your support inbox.
Where to start if you already have too many alerts
Sort the last 90 days of server alerts by rule and delete every rule that fired more than five times without a single human action. That pass usually removes the CPU rules and half the memory rules. Then add the two rules most setups are missing: the filesystem conjunction with a real byte floor, and the agent offline check. The complete Linux server monitoring guide covers collection and retention around it, and the server alerting docs cover the escalation wiring.
FAQ
Should I alert when CPU usage goes above 80%? ▼
No. A CPU sitting at 85% is often a CPU doing its job, and the rule fires on every deploy, every nightly backup and every log compaction. Alert on load per core and on request latency instead, and keep CPU utilization on a dashboard for capacity planning.
When should a disk space alert page instead of warn? ▼
Page at 85% used, but only when free space is also below an absolute floor you pick per volume, and keep a plain 75% rule as a warning. 15% free on a 4 TB volume is 600 GB and nothing to worry about, while 15% free on a 20 GB volume is 3 GB and one log rotation away from an outage. Set the floor to the size of your largest routine write, such as a database dump or a container image pull.
How long should a metric stay over threshold before it pages someone? ▼
Long enough that a normal workload spike cannot trigger it. I use 10 minutes for memory, 15 minutes for load per core, and 5 minutes for filesystem usage. At the Hyperping agent's 30 second scrape cadence, a 10 minute window is 20 consecutive samples, which no deploy or backup burst will produce by accident.
What memory threshold should page an on-call engineer? ▼
Available memory under 10% of total, sustained for 10 or more minutes. Used memory is the wrong number to alert on because Linux fills unused RAM with page cache and reclaims it on demand. Read MemAvailable in /proc/meminfo or the available column of free, not the used column.
Why should I alert when server metrics stop arriving? ▼
Because it is the one rule that catches the failures no other rule sees: kernel panics, hosts that got terminated, network partitions, and disks so full that the monitoring agent itself died. In Hyperping the agent goes Stale and then Offline, which opens an outage and fires the escalation policy attached to that server.
What is the difference between a warning alert and a paging alert? ▼
A warning goes to a Slack or email channel nobody is obliged to read at 3am and exists so someone notices a trend during working hours. A page rings a phone, has an acknowledgement deadline, and escalates to the next person when nobody responds. Every threshold you set should be assigned to one of the two on purpose, never to both.