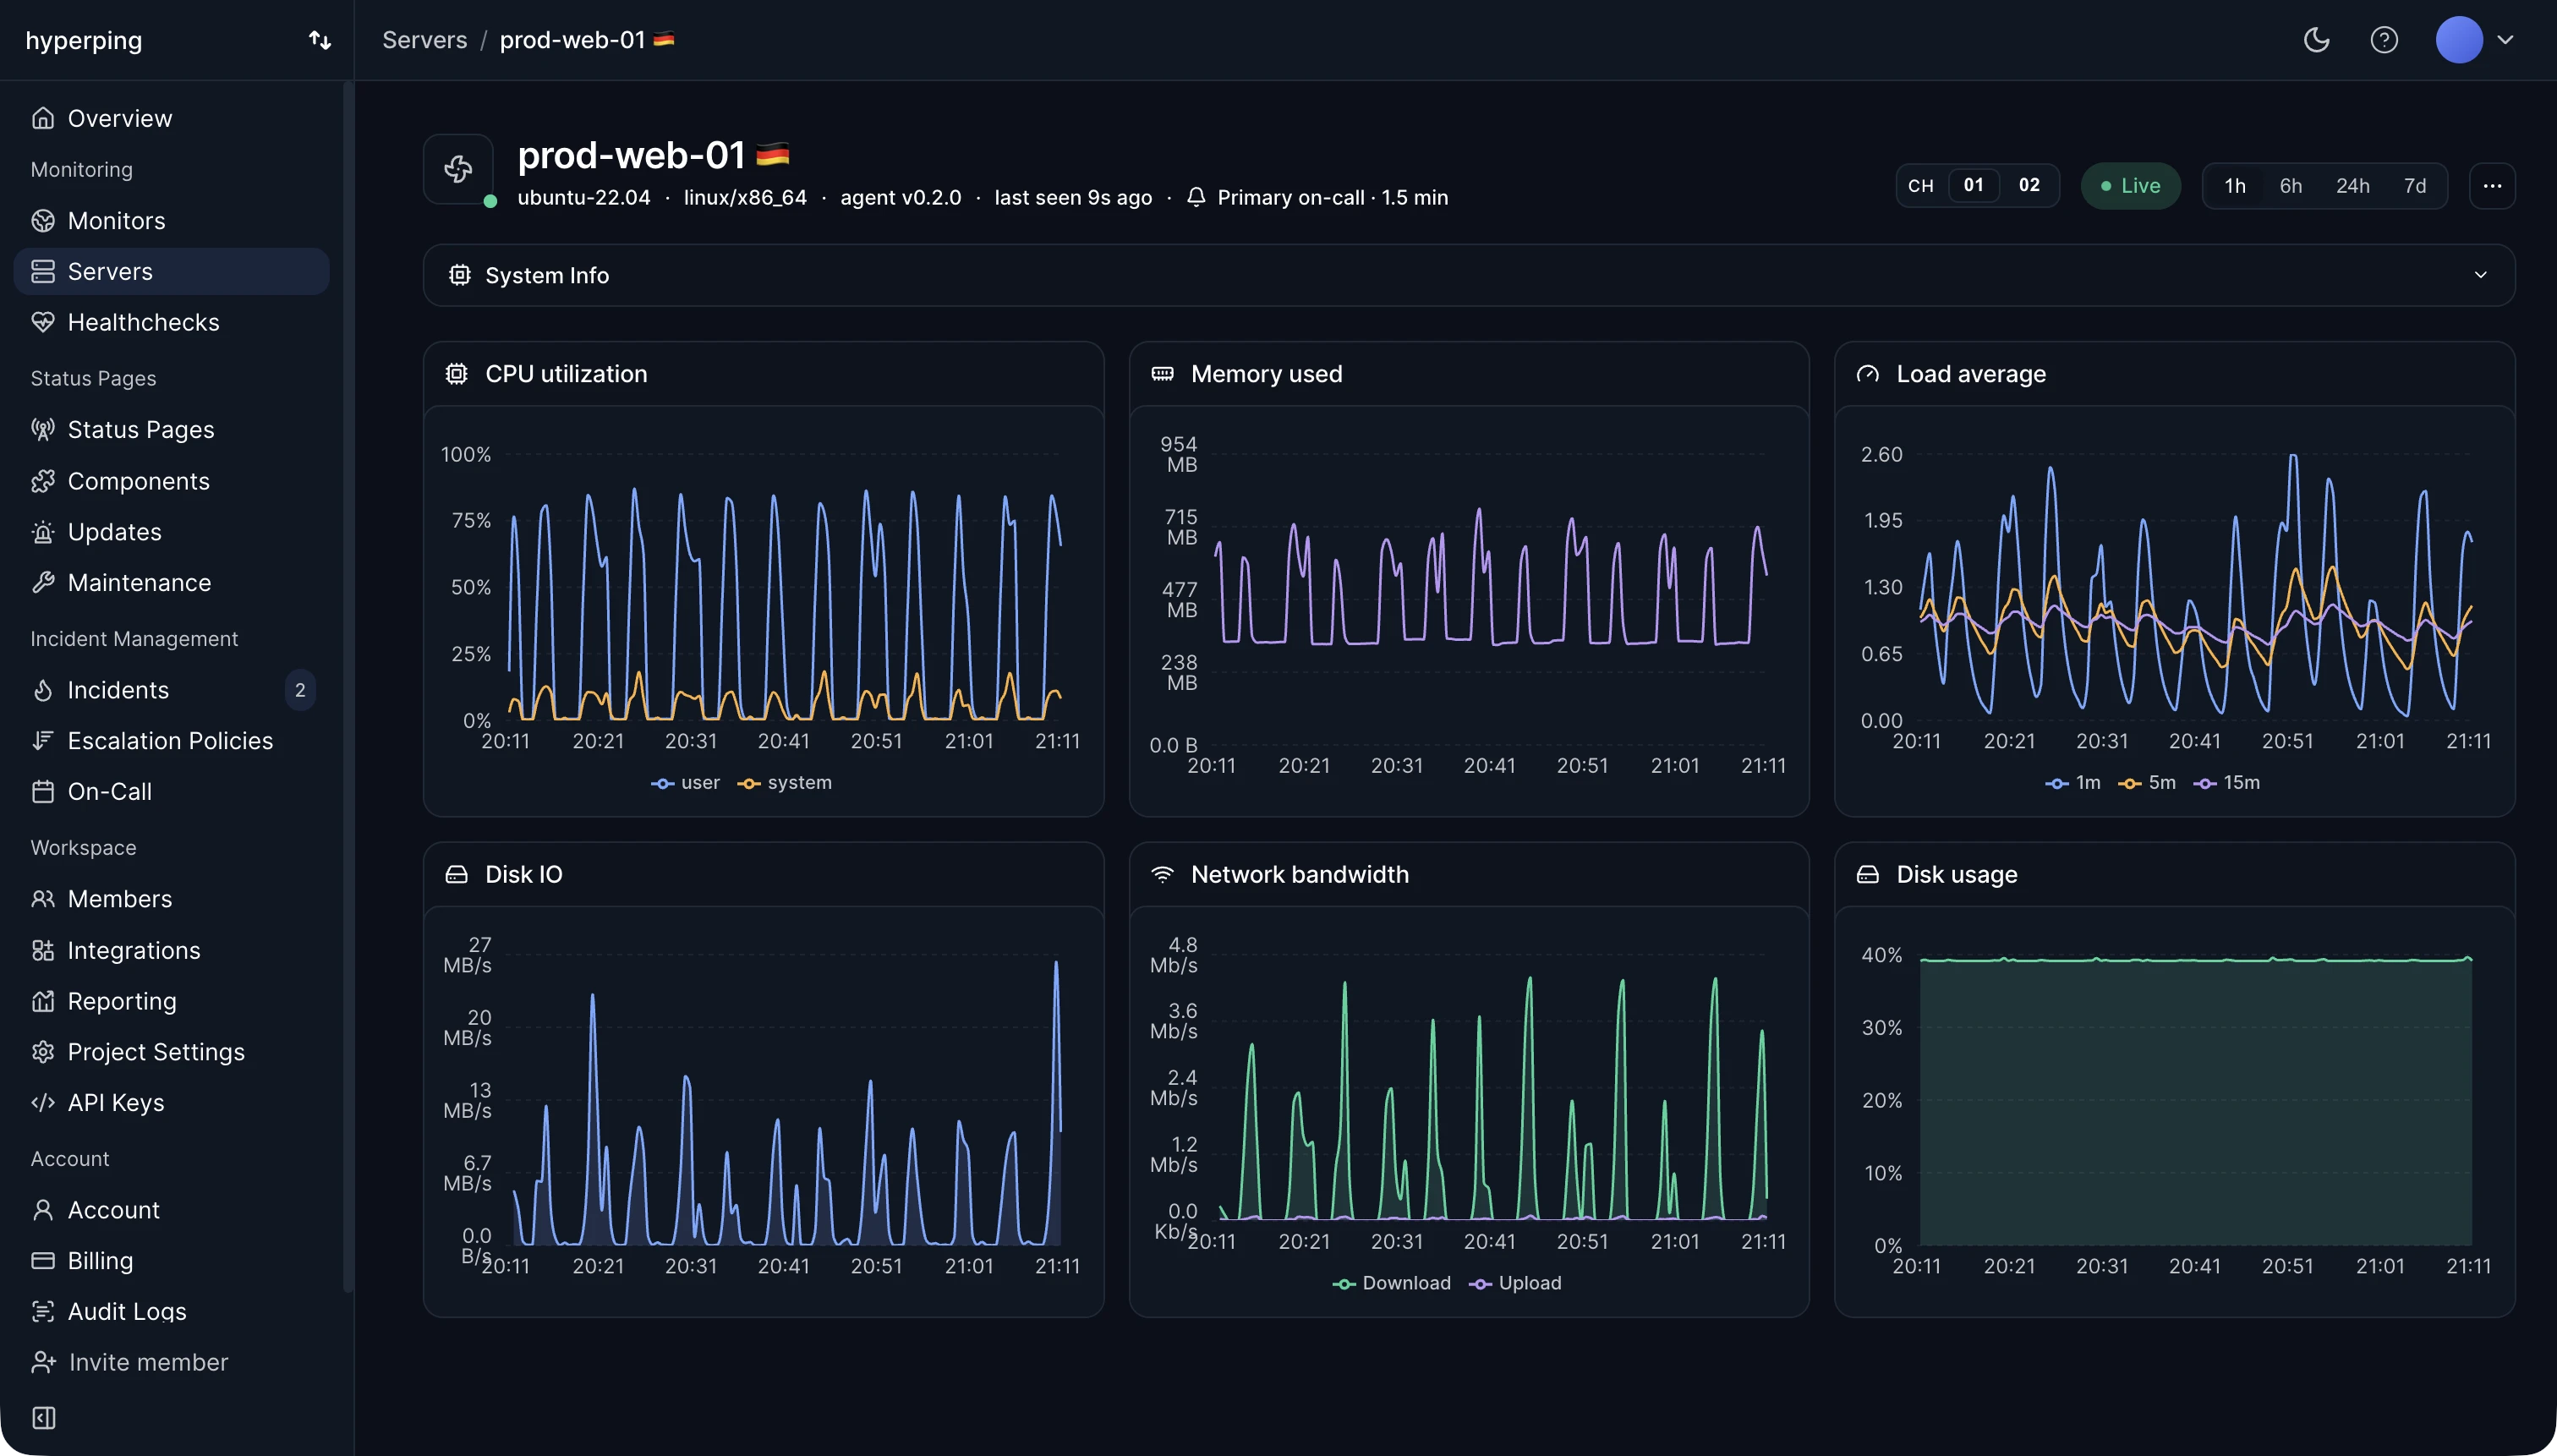
Hyperping's server agent records used, available, and total memory, with utilization as a percentage, every 30 seconds. A memory leak shows up as available memory sliding down over hours or days, well before the host runs out.
Used vs available memory
On Linux the used figure on its own is close to useless, because the kernel deliberately fills spare RAM with page cache: file data kept in memory that can be reclaimed the moment a process needs it. A perfectly healthy server can sit at 95% used forever and never be short of anything.
The number to watch and alert on is available (MemAvailable in /proc/meminfo), the kernel's estimate of how much memory a new allocation can get without swapping or reclaiming aggressively. Available memory sliding down over hours is the shape of a leak. A single dip is usually a large file being read.
How memory problems end
Memory problems end abruptly rather than gradually. When the host runs out, the kernel's OOM killer terminates the process using the most memory, which is often your application or database, and it disappears without any slow rise in response time first. An external uptime check often catches it only after users do. The early warning is the trend in available memory, days before.
Common causes of high memory use
- A leak in the application: memory grows with uptime and drops after each restart.
- A cache with no size limit, in the app or in Redis.
- Too many worker processes for the host, each with its own copy of the app.
- A database configured for a bigger machine, for example a buffer pool sized for 16 GB on an 8 GB host.
FAQ
What is a normal memory utilization for a server?
The used percentage doesn't matter much on Linux. Keep available memory above 10 to 15% of total, and watch that it stays flat over days rather than sliding down.
What is the difference between free and available memory?
Free memory isn't used for anything, not even cache, and is usually small on a healthy server. Available memory is free memory plus cache that can be reclaimed, which is what new processes can actually use.
How do I check memory usage on Linux?
Run free -h and read the available column. ps aux --sort=-rss | head lists the processes using the most. See how to monitor memory usage on Linux.