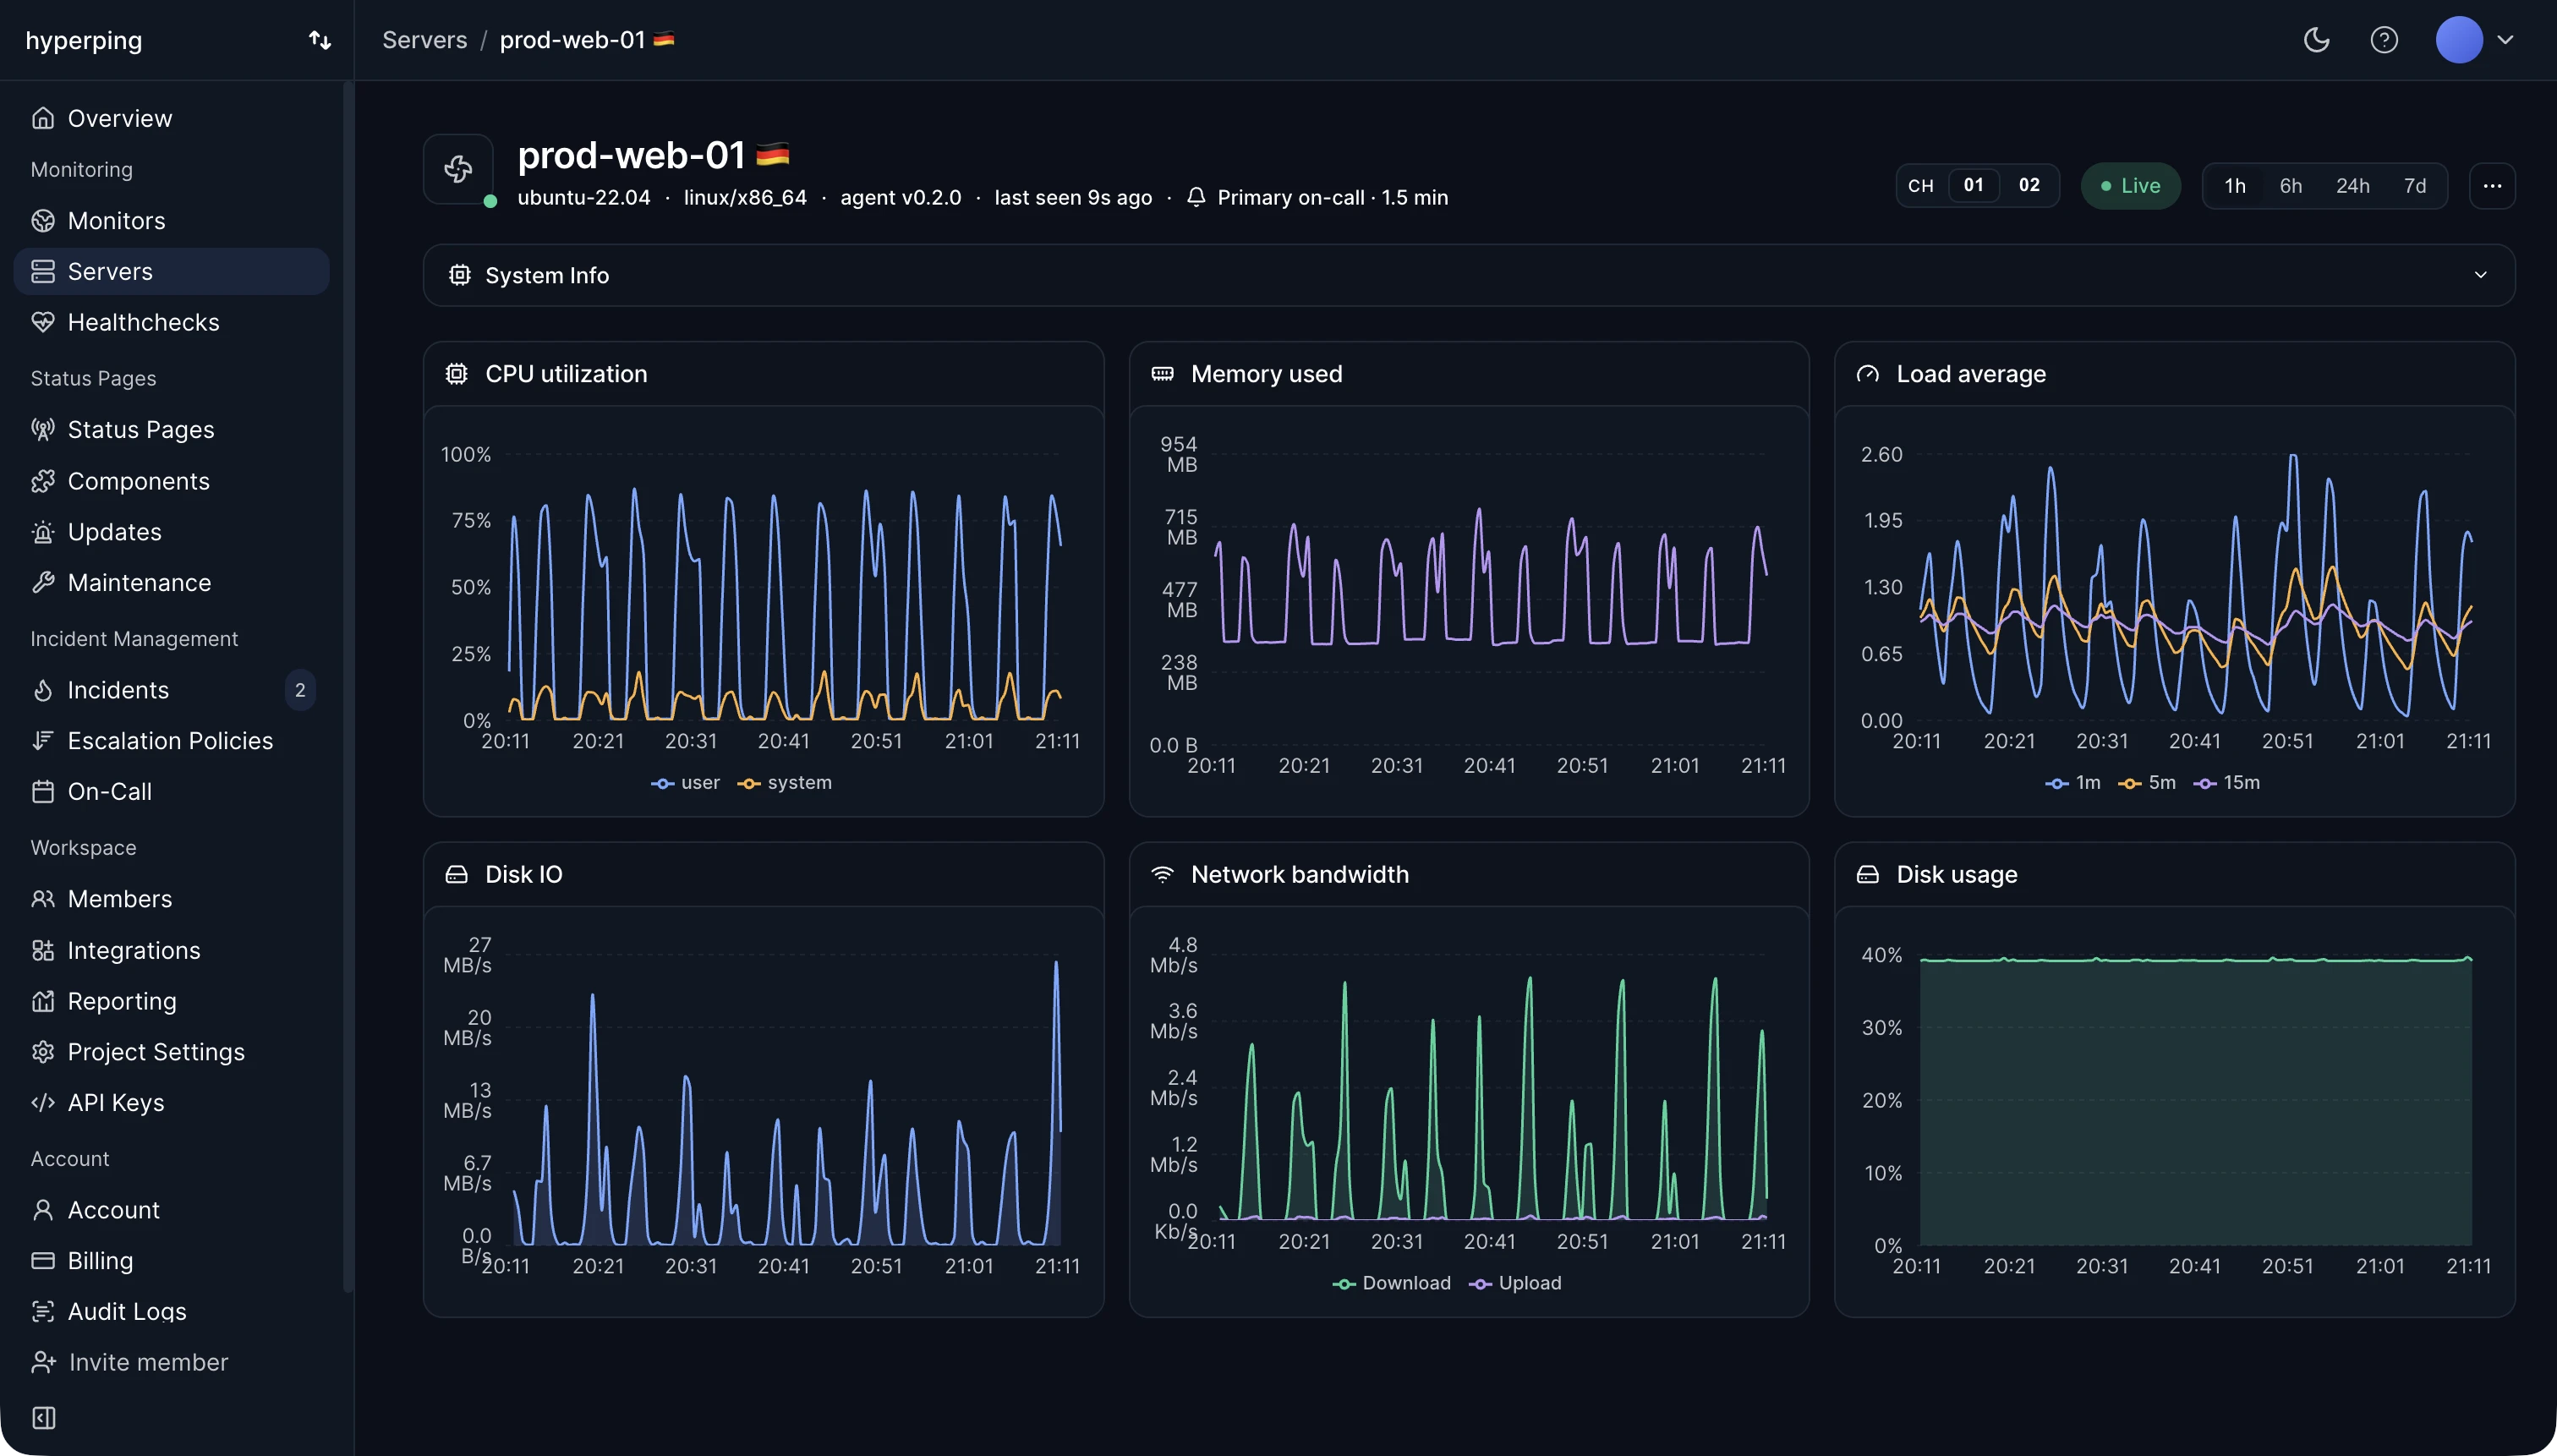
Hyperping's server agent collects the 1, 5, and 15-minute load averages every 30 seconds, next to the host's logical core count, so the load per core is on the same chart without doing the arithmetic. On Windows, which has no load average, the agent derives it from the processor queue.
How to read load average
Load average counts tasks, not percentages, so it has no upper bound: a value of 40 is possible and means 40 tasks were waiting on average. Compare it with the number of logical cores. A load of 8 on an 8-core host is fully committed. A load of 8 on a 2-core host means work is queuing four deep.
The three numbers show the trend. A 1-minute value well above the 15-minute value means load is rising right now. The reverse means a spike is passing.
High load with idle CPUs on Linux
Unlike most other Unix systems, Linux counts tasks in uninterruptible sleep (state D) as well as runnable ones. Those are usually blocked on disk or on a network filesystem. That's why a Linux host with mostly idle CPUs can report a load of 40 when an NFS mount hangs, and why the same workload shows a lower load on BSD. When load is high and CPU utilization is low, look at iowait and disk I/O.
Using load average in alerts
Because it blends CPU demand and I/O stalls into one number, load average makes a good first look and a poor standalone alert. Watch load per core sustained over several minutes, then read CPU time per state and disk I/O to find out which half is responsible. A load per core above 1 for 15 minutes is worth investigating, and above 2 means work is visibly waiting.
FAQ
What is a normal load average?
Anything below the number of logical cores. On a 4-core server, a load around 2 to 3 is busy but healthy, and a sustained load above 4 means tasks are waiting.
What is the difference between load average and CPU utilization?
CPU utilization is the share of time the CPUs were busy, capped at 100%. Load average is how many tasks wanted to run, with no cap, and on Linux it includes tasks waiting on I/O. Utilization tells you the CPUs are full, load tells you how much work is queued behind them.
How do I check load average on Linux?
Run uptime, or read /proc/loadavg. The three numbers are the 1, 5, and 15-minute averages. nproc gives the core count to compare them with.