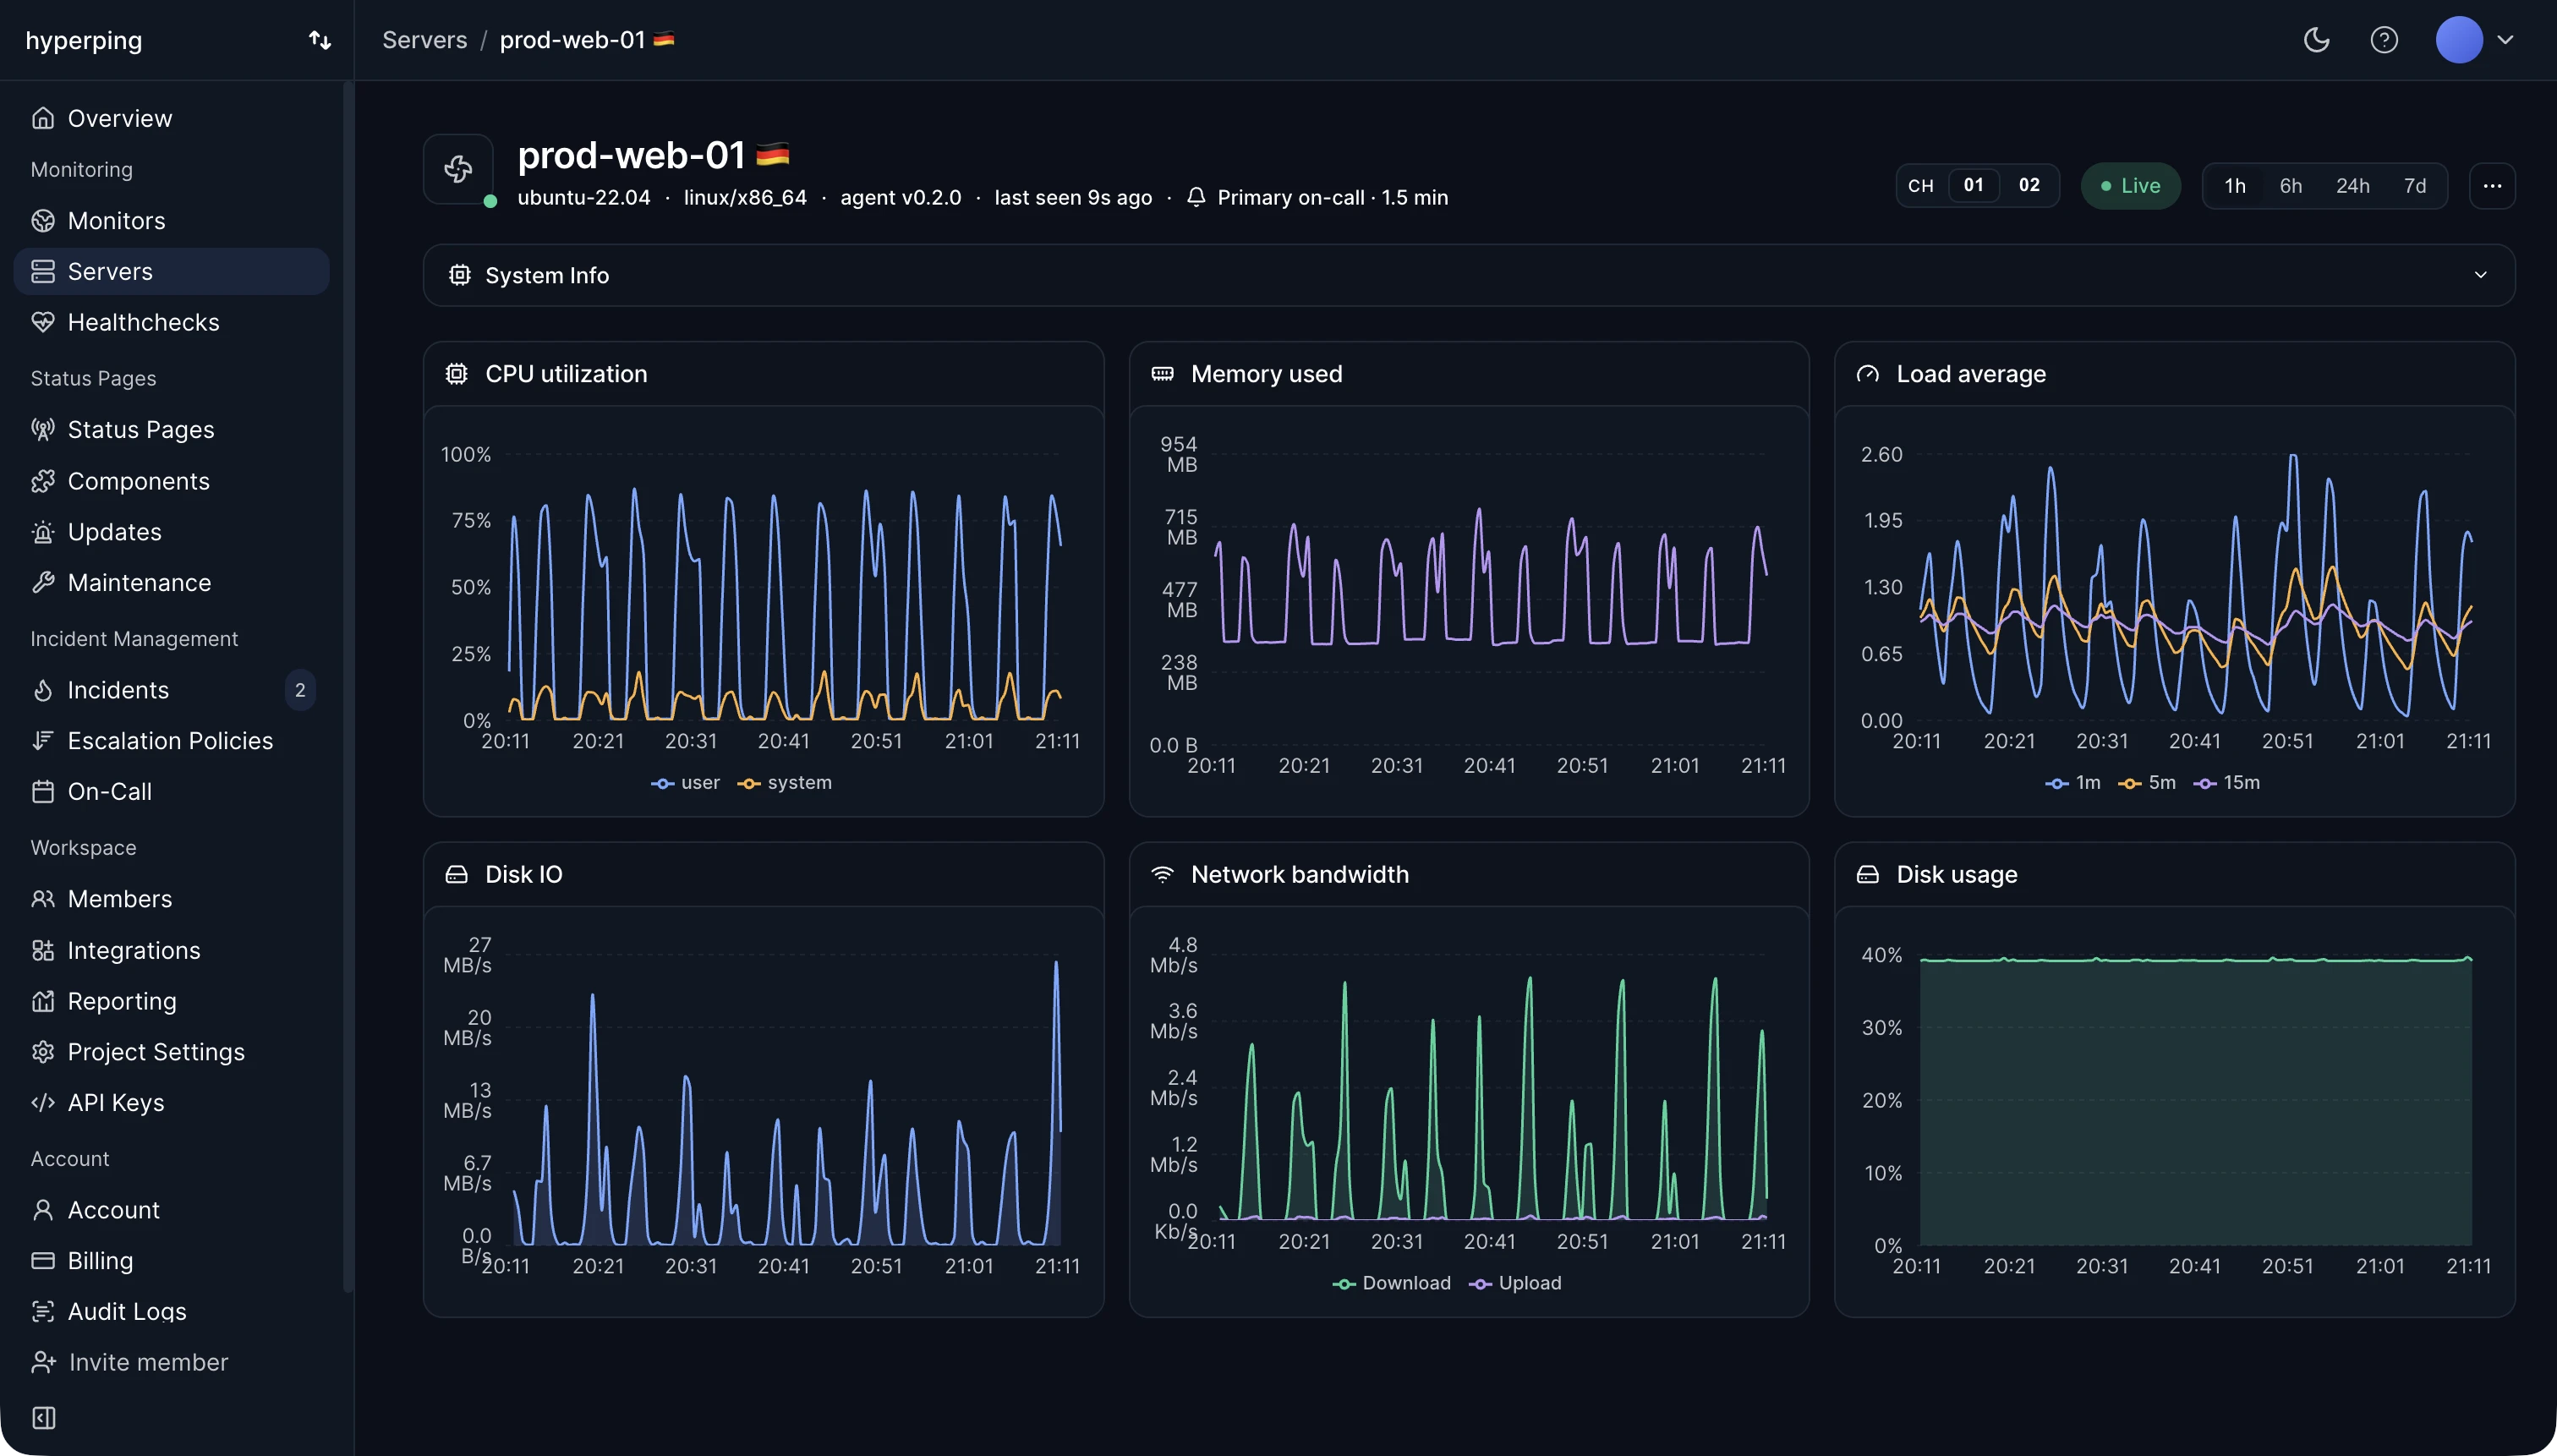
Hyperping's server agent reports CPU time per state as a percentage of wall clock time, every 30 seconds, plus a per-CPU breakdown, so both the aggregate and the one hot core are visible. The same timeline shows load average, memory, and disk I/O, which is usually where the explanation for a CPU spike is.
CPU states
The breakdown by state carries more information than the total:
- User: your application code. A service at 90% user time is doing real work and probably needs more capacity or a faster code path.
- System: kernel work such as syscalls, context switches, and network stack processing. 40% system time usually means something pathological, like syscall thrashing or an interrupt storm.
- iowait: the CPU idling while it waits on storage. See iowait.
- Steal: on virtual machines, time the hypervisor gave to another guest. High steal means a noisy neighbor, and no change inside the VM will fix it.
Aggregate vs per-core utilization
A single-threaded process pinning one core at 100% barely moves the aggregate on a 16-core server: it reads as about 6%. That's the failure a total-only dashboard hides. When a service is slow and the aggregate CPU looks fine, check the per-core view before anything else.
Alerting on CPU
Short bursts to 100% are normal on any healthy server, so alert on sustained utilization, not instant spikes: 5 to 15 minutes above a threshold such as 85%. Pair it with load average to catch queuing, and check whether users are actually affected with an external uptime check before paging anyone at night.
FAQ
What is a normal CPU utilization for a server?
40 to 70% on average leaves room for traffic spikes. Sustained values above 80 to 85% mean the next spike will slow requests down.
What is the difference between CPU utilization and load average?
Utilization measures how busy the CPUs were, capped at 100%. Load average counts tasks waiting to run, with no cap, so it shows how much work is queued once utilization is full.
How do I check CPU utilization on Linux?
top or htop for a live view, mpstat -P ALL 1 for each core, and pidstat 1 to see which process uses it. See how to monitor CPU usage on Linux.