High iowait means your CPUs were idle while at least one block device request was still in flight. That is the entire definition. The wa figure in top is not work being done, it is the share of wall clock time a CPU had nothing to run because the runnable tasks were parked waiting on storage. It tells you the machine is blocked on I/O, and nothing else. Which device, which process, and whether the hardware is actually slow are three separate questions, answered by iostat, iotop and dmesg.
Key takeaways
- iowait is idle time. A CPU busy with user work cannot accrue it, so a host at 95% user time can be badly I/O bound while
wareads close to 0. topgives you the number,iostat -x 1gives you the device. Readr_await,w_awaitandaqu-szper device, never the summary line.- Divide
rkB/sbyr/sto get average request size. Under 16 kB you are IOPS bound, over 128 kB you are throughput bound, and the two have completely different fixes. - On AWS, gp2 bursts to 3,000 IOPS on credits then falls back to 3 IOPS per GiB. gp3 includes 3,000 IOPS and 125 MB/s with no burst. A latency cliff at a round number is throttling, not hardware.
%utilnear 100% is a saturation signal on a single-queue rotational disk and nearly meaningless on NVMe, which serves dozens of requests in parallel.
What iowait actually measures
The kernel splits every CPU's time into buckets and exposes the raw counters in /proc/stat.
head -2 /proc/statcpu 11277821 9040 2889565 4293360183 5629450 0 101632 60309 0 0
cpu0 1409728 1130 361196 536670022 703681 0 12704 7539 0 0The fields after the label are user, nice, system, idle, iowait, irq, softirq, steal, guest and guest_nice, counted in USER_HZ ticks. getconf CLK_TCK returns 100 on essentially every Linux system, so each tick is 10 ms.
The fifth field is the one that matters here. A CPU is credited with iowait when it has no runnable task and at least one task that last ran on it is blocked on block device I/O. That definition carries two consequences worth knowing before you act on the number.
The first is that per-CPU iowait is noisy. A blocked task is attributed to the CPU it last ran on, and the scheduler moves tasks around, so only the aggregate figure is stable. The second is that only block device waits count. A thread blocked on a socket read sits in interruptible sleep and appears in neither iowait nor the load average, which is exactly why those two metrics sometimes disagree about how busy a machine is.
Low iowait does not prove the disk is fine
Because iowait is carved out of idle time, any CPU-heavy workload hides it. A host running at 90% user time with one thread stalling 40 ms on every fsync will report wa near zero and still ship terrible p99 latency, because the CPUs always had something else to run.
Averaging hides it too. top reports the mean across all cores, so one core pinned at 100% iowait on a 32 core box shows up as 3.1%. Press 1 inside top to break the line out per CPU.
Two signals do not have that blind spot. The first is await and aqu-sz from iostat, which measure the device regardless of what the CPUs are doing. The second is pressure stall information, available on kernel 4.20 and newer with CONFIG_PSI.
cat /proc/pressure/iosome avg10=74.60 avg60=68.12 avg300=41.03 total=2903118442
full avg10=59.21 avg60=54.77 avg300=31.60 total=2214880190some is the share of time at least one task was stalled on I/O, full the share where every runnable task was stalled. PSI counts those stalls even while other tasks are running, which is the case iowait structurally cannot see.
Start with top and vmstat to size the problem
top tells you whether to keep going.
top - 03:12:44 up 62 days,  9:41,  1 user,  load average: 14.82, 11.36, 7.05
Tasks: 241 total,   1 running, 240 sleeping,   0 stopped,   0 zombie
%Cpu(s):  3.1 us,  1.8 sy,  0.0 ni, 17.4 id, 77.2 wa,  0.0 hi,  0.5 si,  0.0 st
MiB Mem :  16008.0 total,    412.3 free,   4820.1 used,  10775.6 buff/cache
3.1% user time against 77.2% iowait, with a load average of 14.82 on a box with one running task, is storage. For the relationship between those two numbers, see Linux load average explained.
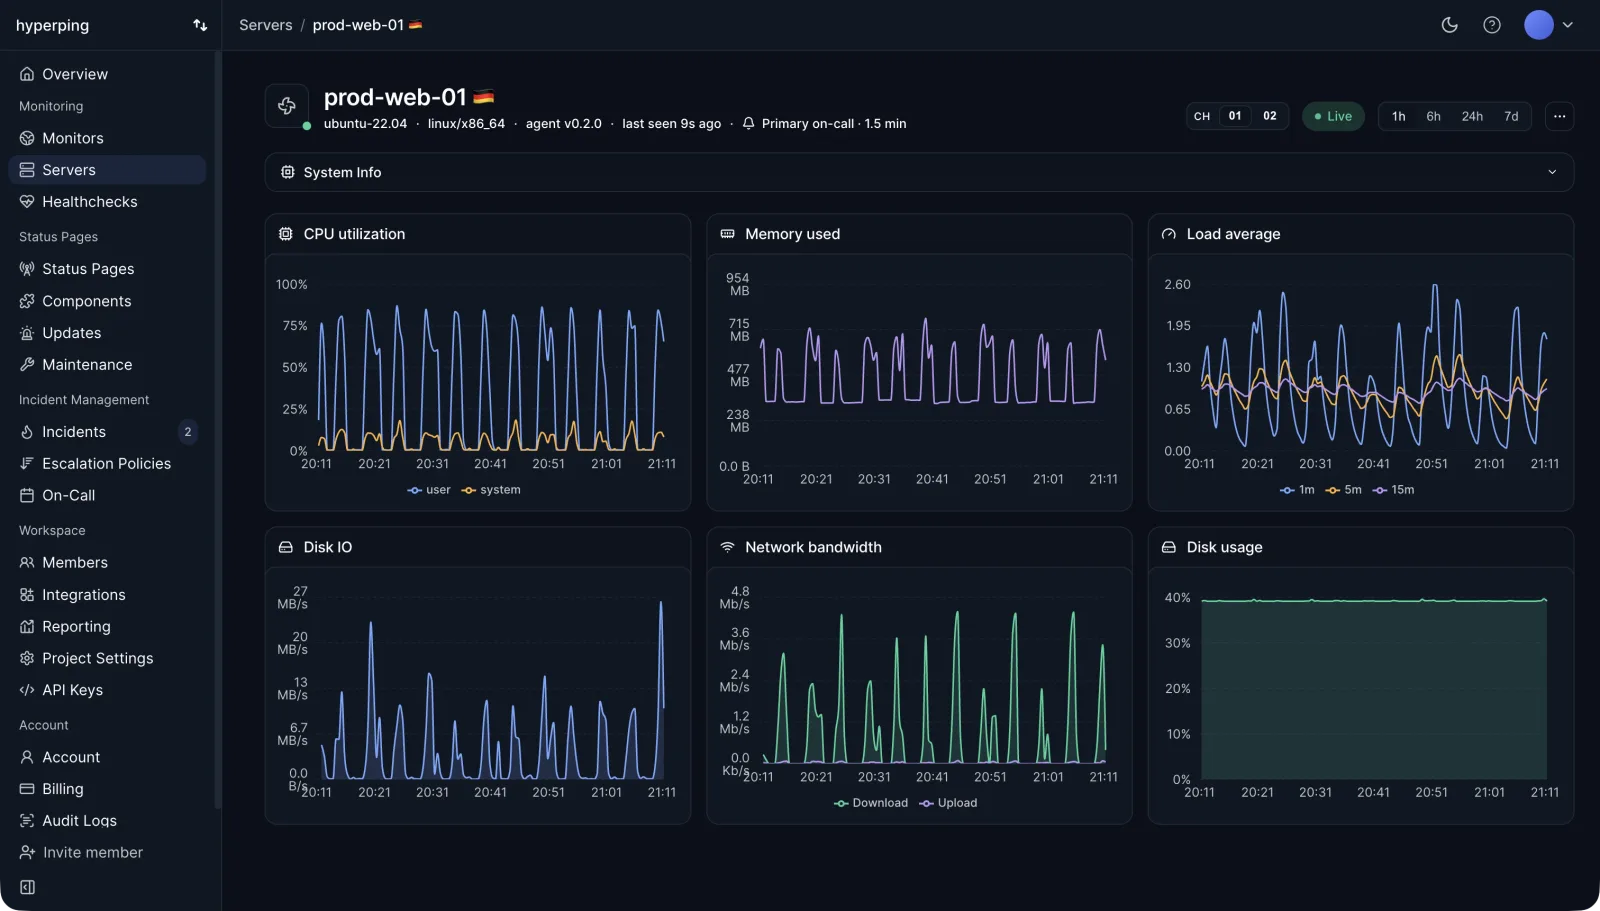
Recorded continuously, that correlation reads off two charts covering the same window.
vmstat gives the same picture in a form you can pipe to a file, plus a count of blocked tasks.
vmstat 1 3procs -----------memory---------- ---swap-- -----io---- -system-- ------cpu-----
r b swpd free buff cache si so bi bo in cs us sy id wa st
0 0 0 422108 91244 11033752 0 0 118 1904 412 918 6 2 91 1 0
1 19 0 421884 91244 11033804 0 0 160 23840 2411 4102 3 2 18 77 0
0 22 0 421760 91248 11033812 0 0 152 24016 2388 4051 3 2 17 78 0Discard the first line. It reports averages since boot, which is why it always looks calm. The b column counts tasks blocked in uninterruptible sleep, and 19 to 22 of them against a single runnable task confirms the diagnosis. bi and bo are blocks read from and written to block devices per second.
iostat -x is where the diagnosis happens
iostat comes from the sysstat package. Install it with sudo apt install sysstat on Debian and Ubuntu, sudo dnf install sysstat on RHEL, Rocky and Fedora.
iostat -xy 1 3Device r/s rkB/s r_await rareq-sz w/s wkB/s w_await wareq-sz aqu-sz %util
nvme0n1 20.0 160.0 0.40 8.00 2980.0 23840.0 12.40 8.00 36.96 99.80The -y flag skips the since-boot report so the first block you see is a real one second sample. Columns are trimmed for width here, and exact names vary by version: sysstat 12 renamed avgqu-sz to aqu-sz and dropped svctm entirely. Check yours with iostat -V.
| Column | What it measures | When to worry |
|---|---|---|
r/s, w/s |
Completed requests per second, which is IOPS | The sum sits at a flat round number |
rkB/s, wkB/s |
Throughput | The sum pins at 125, 250 or 1000 MB/s |
rareq-sz, wareq-sz |
Average request size in kB | Under 16 kB, IOPS matter more than bandwidth |
r_await, w_await |
Average ms per request, queue time included | Above 10 ms on SSD or NVMe, above 20 ms on rotational |
aqu-sz |
Average requests in flight | Consistently above 2 means requests wait behind other requests |
%util |
Share of time at least one request was in flight | Useful on rotational disks, misleading on NVMe |
That sample adds up to exactly 3,000 IOPS at 24 MB/s. A flat 3,000 is not a number storage hardware produces on its own. For the underlying counters and how they are derived, see disk I/O.
Throughput bound or IOPS bound changes the fix
Average request size separates the two cases, and iostat hands it to you in rareq-sz and wareq-sz. If your version predates those columns, divide rkB/s by r/s yourself.
| Signal | Throughput bound | IOPS bound |
|---|---|---|
| Request size | 128 kB and up | 4 to 16 kB |
r/s plus w/s |
Modest, a few hundred | Pinned at a round ceiling |
rkB/s plus wkB/s |
Pinned at a bandwidth ceiling | Well under the ceiling |
| Typical cause | Backups, sequential scans, log shipping, media processing | Random reads, index lookups, small writes with fsync |
| What helps | More bandwidth, rate limiting the job, larger sequential batches | More provisioned IOPS, more page cache, batching writes |
The example above is IOPS bound: 8 kB requests, 3,000 per second, 24 MB/s against a volume rated for 125 MB/s. Buying more bandwidth would change nothing.
Naming the process: iotop, pidstat and D state
Neither top nor iostat can attribute I/O to a process. iotop can.
sudo iotop -oPTotal DISK READ: 0.42 M/s | Total DISK WRITE: 23.11 M/s
Actual DISK READ: 0.39 M/s | Actual DISK WRITE: 24.02 M/s
PID PRIO USER DISK READ DISK WRITE SWAPIN IO> COMMAND
4412 be/4 postgres 0.00 B/s 18.92 M/s 0.00 % 71.02 % postgres: checkpointer
9021 be/4 root 0.42 M/s 4.19 M/s 0.00 % 18.44 % rsync -a /var/lib/postgresql /backup-o hides processes doing no I/O, -P aggregates threads into processes. The IO> column is the share of time the process spent blocked on I/O, and it depends on kernel delay accounting. On kernels 5.14 and newer that column reads 0.00 until you enable it with sudo sysctl kernel.task_delayacct=1. Install with sudo apt install iotop or sudo dnf install iotop, which needs EPEL on some RHEL releases.
pidstat ships with sysstat and gives you the same attribution in a format you can log.
pidstat -d 1Linux 6.8.0-45-generic (db-01) 07/25/2026 _x86_64_ (8 CPU)
15:42:13 UID PID kB_rd/s kB_wr/s kB_ccwr/s iodelay Command
15:42:13 108 4412 0.00 19374.00 0.00 412 postgres
15:42:13 0 9021 430.00 4290.00 0.00 88 rsynckB_ccwr/s is cancelled write bytes, pages that were dirtied and then truncated before reaching the disk. iodelay counts clock ticks the task spent blocked on I/O completion or swap-in, and it is the column that ranks culprits when read and write rates look similar.
Finally, list the tasks currently stuck in uninterruptible sleep.
ps -eo state,pid,comm,wchan:22 | awk '$1 == "D"'D 4412 postgres wait_on_page_bit
D 9021 rsync io_schedule
D 14872 postgres balance_dirty_pagesRun it as root, since some kernels hide wchan from unprivileged users. balance_dirty_pages appearing repeatedly means the writeback path is throttling your writers because dirty pages are piling up faster than the device drains them.
Check dmesg before you blame the workload
A device that is failing, resetting, or rebuilding produces the same symptoms as a device that is merely busy.
sudo dmesg -T | grep -iE 'i/o error|timeout|reset|nvme|ata[0-9]' | tail -20[Fri Jul 24 03:11:52 2026] nvme nvme0: I/O 421 QID 3 timeout, aborting
[Fri Jul 24 03:11:54 2026] nvme nvme0: Abort status: 0x0
[Fri Jul 24 03:12:22 2026] blk_update_request: I/O error, dev nvme0n1, sector 88104960 op 0x1:(WRITE)
[Fri Jul 24 03:12:22 2026] EXT4-fs warning (device nvme0n1p1): ext4_end_bio: I/O error 10 writing to inode 2359421Anything in that output ends the investigation. Confirm the media with sudo smartctl -a /dev/nvme0n1 and read the Critical Warning, Percentage Used and Media and Data Integrity Errors lines. If the host uses software RAID, cat /proc/mdstat will show a rebuild in progress, which explains elevated await on every member device at once.
Cloud volumes throttle, and it looks exactly like a slow disk
Most high iowait incidents I have chased on cloud instances were throttling, not hardware. The tell is the shape of the curve. Real hardware degrades gradually under load. A throttled volume holds a flat ceiling and then latency climbs behind it.
| AWS volume type | Baseline | Burst | Ceiling |
|---|---|---|---|
| gp2 | 3 IOPS per GiB, minimum 100 | To 3,000 IOPS on I/O credits, volumes under 1,000 GiB | 16,000 IOPS at 5,334 GiB and above |
| gp3 | 3,000 IOPS and 125 MB/s at any size | None | 16,000 IOPS and 1,000 MB/s, provisioned separately |
| io2 | Provisioned, up to 500 IOPS per GiB | None | 64,000 IOPS, higher on io2 Block Express |
Two limits stack. The volume has a cap, and the instance has its own EBS bandwidth cap, so a gp3 provisioned at 1,000 MB/s attached to a small instance will never get near it. Smaller instance families also burst their EBS allowance, which CloudWatch exposes as EBSIOBalance% and EBSByteBalance%. For gp2, BurstBalance hitting zero is the moment your 3,000 IOPS became 300.
Steal time often appears in the same incident without being related. The st field in top is time the vCPU was runnable but the hypervisor ran another guest. On burstable T family instances that exhaust their CPU credits, st climbs at the same time as iowait, because both CPU and storage allowances run out under the same sustained load. Sustained st above 5% means the fix is outside the guest: resize, or move off shared tenancy.
What actually fixes each cause
| Diagnosis | Signature | Fix |
|---|---|---|
| Backup or bulk copy saturating the volume | Large wareq-sz, throughput at the ceiling, one process dominating iotop |
rsync --bwlimit, schedule off peak, ionice -c3 where the scheduler supports it |
| Database checkpoint storms | Writes spike on a period, w_await spikes with them |
Spread checkpoints with checkpoint_completion_target and a larger max_wal_size on Postgres |
| Random reads missing the page cache | Small rareq-sz, high r/s, little memory in buff/cache |
Add RAM, add indexes, review query plans |
| Volume throttling | Flat IOPS or MB/s ceiling, await climbing behind it |
Provision more IOPS, move gp2 to gp3, split across volumes |
| Failing device | dmesg errors, await in hundreds of ms |
Replace it |
One caveat on ionice: it only changes anything under an I/O scheduler that implements priorities, which today means BFQ. Run cat /sys/block/nvme0n1/queue/scheduler first, and if it reads [none] or [mq-deadline], ionice is a no-op. Memory pressure is worth ruling out at the same time, since a shrinking page cache turns cached reads into disk reads. The walkthrough in how to monitor memory usage on Linux covers reading buff/cache correctly.
Recording iowait and disk I/O before the next incident
Every command above reports on the present moment. By the time you SSH in, the 03:12 spike is gone and iostat shows a calm machine. That is the argument for agent-based monitoring that records the counters continuously.
The Hyperping agent installs in one line and reports every 30 seconds.
curl -fsSL https://hyperping.com/install.sh | sh -s HP_INSTALL_xxxxxIt collects CPU time per state including iowait as a share of wall clock, the 1, 5 and 15 minute load averages with the logical core count, memory used and available, filesystem usage per real mount point, read and write bytes per block device, network bytes per interface, and the usual host metrics such as kernel version and CPU model. The complete list is in metrics collected.
Read together, most incidents explain themselves. Device bytes sitting flat at a known ceiling is throttling. Rising iowait with flat device bytes is latency, not volume. The agent does not do per-process attribution, so iotop and pidstat stay in the runbook for naming the offending process once an alert has told you which host and which device to look at.
Two things I would set up on day one. Keep read and write bytes per device on the dashboard next to your volume's documented ceiling, since a flat line at that ceiling catches throttling a CPU-side iowait figure can miss on a busy host. Hyperping does not fire alerts on disk throughput, so if you want a numeric rule there, build it in your own alerting layer and point it at a ceiling you can actually name. And bind an escalation policy to the server, because Hyperping's server alerting works on agent liveness: a machine that becomes so I/O bound that the agent stops reporting goes Stale in the UI after a 30 second scrape gap, then Offline once nothing has arrived past the server's offline threshold (90 seconds by default), which opens an outage and pages the policy's channels.
Agent-based server monitoring covers the inside of the host. Pair it with external uptime checks so you also know whether users could reach the service while the disk was struggling. The broader setup is in the Linux server monitoring guide, and the CPU side of the same picture is in how to monitor CPU usage on Linux alongside the CPU utilization definition. When the device turns out to be fine and the stall is on the wire instead, how to monitor network throughput on Linux covers that side.
The short version
Confirm with top, then stop trusting the number. Go straight to iostat -xy 1 and read r_await, w_await and aqu-sz per device, because those measure the disk and wa measures the CPUs. Divide throughput by IOPS to learn whether you are bandwidth bound or request bound. Name the process with iotop -oP or pidstat -d 1. Check dmesg before you tune anything. And on a cloud instance, check the volume's documented ceiling before you conclude the hardware is slow, because a flat line at 3,000 IOPS is a billing decision, not a physics one.
FAQ
What does high iowait mean on Linux? ▼
It means the CPU was idle while at least one block device I/O request was still outstanding. The wa figure in top is the share of wall clock time spent in that state. It tells you the machine had nothing to run because tasks were waiting on storage, but it does not tell you which device or which process is responsible.
What is a normal iowait percentage? ▼
There is no universal number, because it depends entirely on the workload. A database host at 15% iowait can be perfectly healthy while a stateless web server at 5% is already in trouble. Compare against that machine's own baseline over the last week rather than against a fixed threshold.
Is high iowait always a disk problem? ▼
No. iowait is carved out of idle time, so it also rises when the CPUs simply have nothing else to run. A backup job pushing a quiet machine to 60% iowait is doing its job. What matters is whether await and queue depth in iostat -x are also elevated, because those measure the device directly.
How do I find which process is causing high iowait? ▼
Run sudo iotop -oP to see per-process read and write rates plus the IO> column, or pidstat -d 1 from the sysstat package for the same data in a loggable format. List blocked tasks with ps -eo state,pid,comm and filter for D state. Neither top nor iostat can attribute I/O to a process.
Why is iowait high on my AWS EC2 instance? ▼
Usually EBS throttling rather than slow hardware. gp2 volumes burst to 3,000 IOPS on credits and drop to 3 IOPS per GiB when they run out, and gp3 includes 3,000 IOPS and 125 MB/s with no burst at all. The signature is IOPS or throughput pinned at a flat round number in iostat while await climbs.
Does %util at 100% mean my disk is saturated? ▼
Only on a single-queue rotational disk. %util is the share of time the device had at least one request in flight, and an NVMe drive serving 64 requests in parallel reports 100% while still half idle. Read r_await, w_await and aqu-sz instead.