
Stop debugging blind when
the HTTP monitor goes red
Before Hyperping
After Hyperping
One-line install, 30 seconds to first metric
Paste one curl | sh command. The installer detects OS, architecture, and init system, verifies a signed tarball, and enrolls the host automatically.
30-second scrape cadence
The embedded OpenTelemetry collector samples host metrics every 30 seconds. Each scrape reaches Hyperping within a couple of seconds of the event on the host.
On-disk queue survives outages
Unsent metrics persist to /var/lib/hyperping/queue and retry automatically. Your graphs stay continuous through ingest outages, reboots, and flaky links.
OpenTelemetry native
Standard OTLP/HTTP under the hood with gzipped payloads. Metric names, attributes, and semantic conventions match the OTel hostmetrics receiver directly.
~50 MB RSS footprint
Safe to run on production VMs next to your app — not just on beefy monitoring boxes. No Java runtime, no daemon zoo, no surprise CPU draws.
Re-enroll to rotate credentials
Install tokens exchange for a long-lived per-host agent token. Re-run the installer to rotate — same server UUID, same history, old credential revoked cleanly.
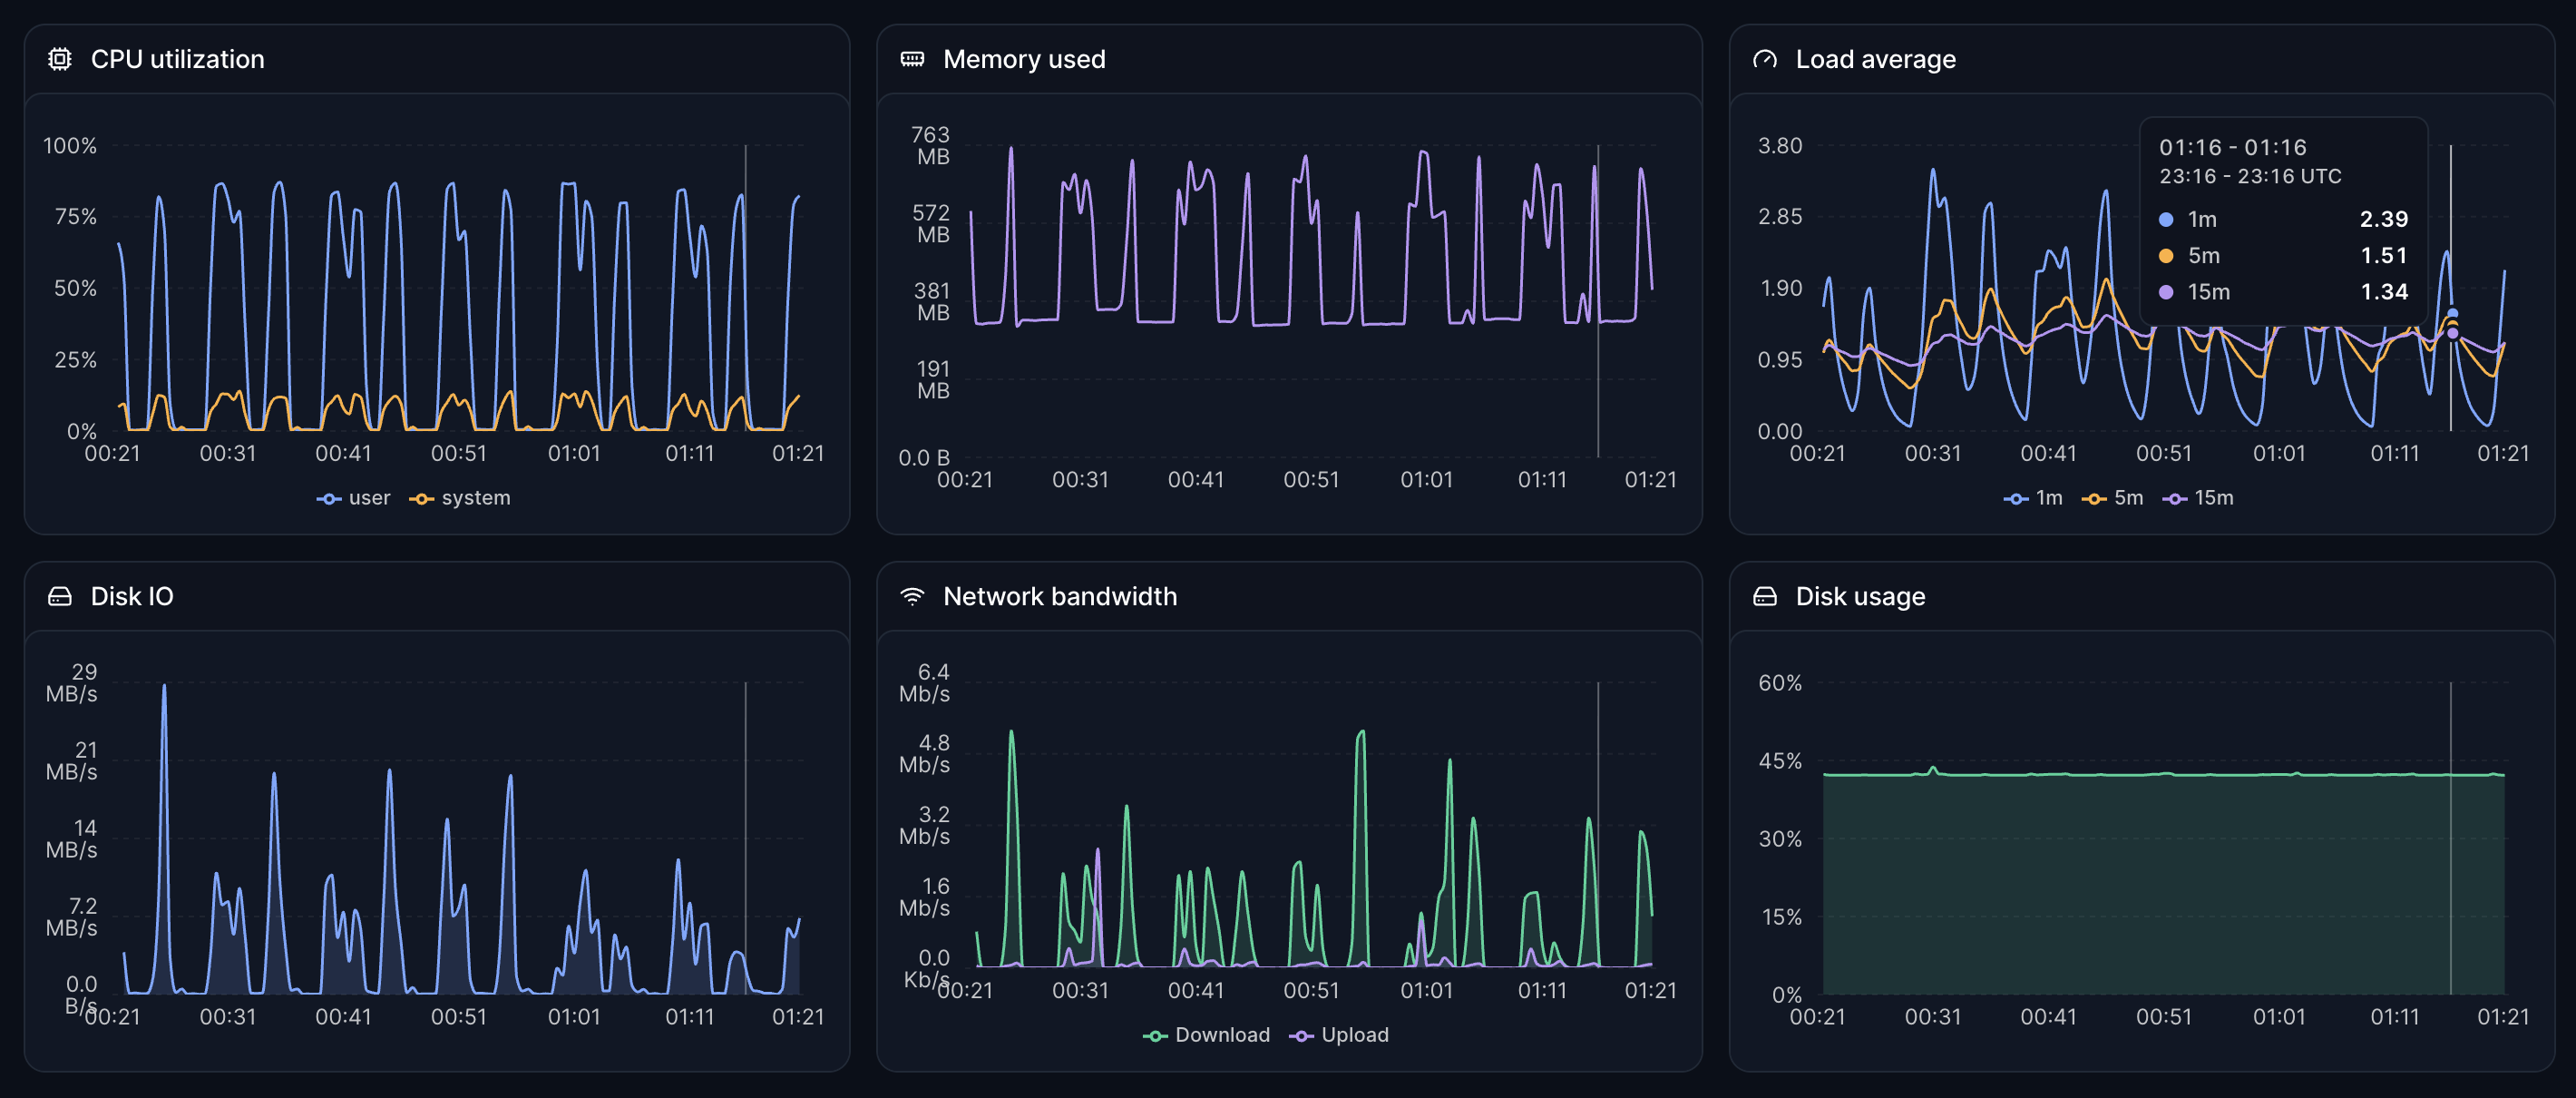
CPU utilization and load averages
Track user, system, and iowait CPU time as a percentage of wall clock, plus 1, 5, and 15-minute load averages. Per-CPU breakdowns included.
Memory usage and utilization
Used, available, and total memory in bytes and as a percentage. Convenient for alerts like "page when free memory drops below 5%".
Filesystem per mount
Used and free space for every real mount point, with device, mountpoint, and filesystem type. Rendered as a per-mount table in the dashboard.
Disk I/O per device
Bytes read and written per block device. See which drive is getting hammered and which is idle without leaving the dashboard.
Network throughput per interface
Bytes in and out per network interface. The dashboard derives TX and RX rates automatically so the Network table is ready to read.
Host metadata and uptime
Hostname, OS, kernel, architecture, CPU model, boot time, and agent version stamped on every payload. Uptime in seconds since the kernel booted, so "how long has this box been up?" is one glance.
Server monitoring is the practice of collecting system-level metrics from your hosts — CPU, memory, filesystem, disk, network, and processes — so you can see how a machine is actually performing, not just how its endpoints respond from the outside.
HTTP uptime monitoring answers "is my site up?" Server monitoring answers "why is it slow, and what's about to break?" The two are complementary: one watches your service from the outside, the other watches the box from the inside.
A modern agent like Hyperping's embeds an OpenTelemetry collector, ships OTLP/HTTP over standard HTTPS, survives network blips with an on-disk queue, and keeps its footprint small enough to run next to your workload without getting in the way.
What the agent collects
CPU and load averages
CPU time per state (user, system, iowait), 1, 5, and 15-minute load averages, and logical core count. Scraped every 30 seconds from /proc on Linux and sysctl on macOS.
Memory usage
Used, available, and total memory in bytes, plus utilization as a percentage. Simple enough to alert on, detailed enough to chart.
Filesystem per mount
Used and free space for every real mount point with device, mountpoint, and filesystem type. Pseudo-filesystems filtered so the table stays readable.
Disk I/O
Read and write bytes per block device. Catch storage contention before it turns into timeouts at the application layer.
Network throughput
Bytes in and out per network interface. The dashboard derives TX and RX rates automatically so the Network chart is ready to read.
Host metadata and uptime
Hostname, machine ID, OS, kernel, architecture, CPU model, boot time, agent version, and seconds since kernel boot. Stamped on every payload as resource attributes.
Legacy Stack vs. Hyperping
Legacy Stack
+ time spent integrating & context-switching

"Hyperping's reputation in our company is that it's more reactive than Datadog. We usually get notifications from Hyperping before Datadog."