Metrics collected
Use this page as the reference for every OTLP metric name the ingestor accepts. The agent ships system metrics through an embedded OpenTelemetry collector: scraped every 30 seconds, streamed to the ingest endpoint over OTLP/HTTP.
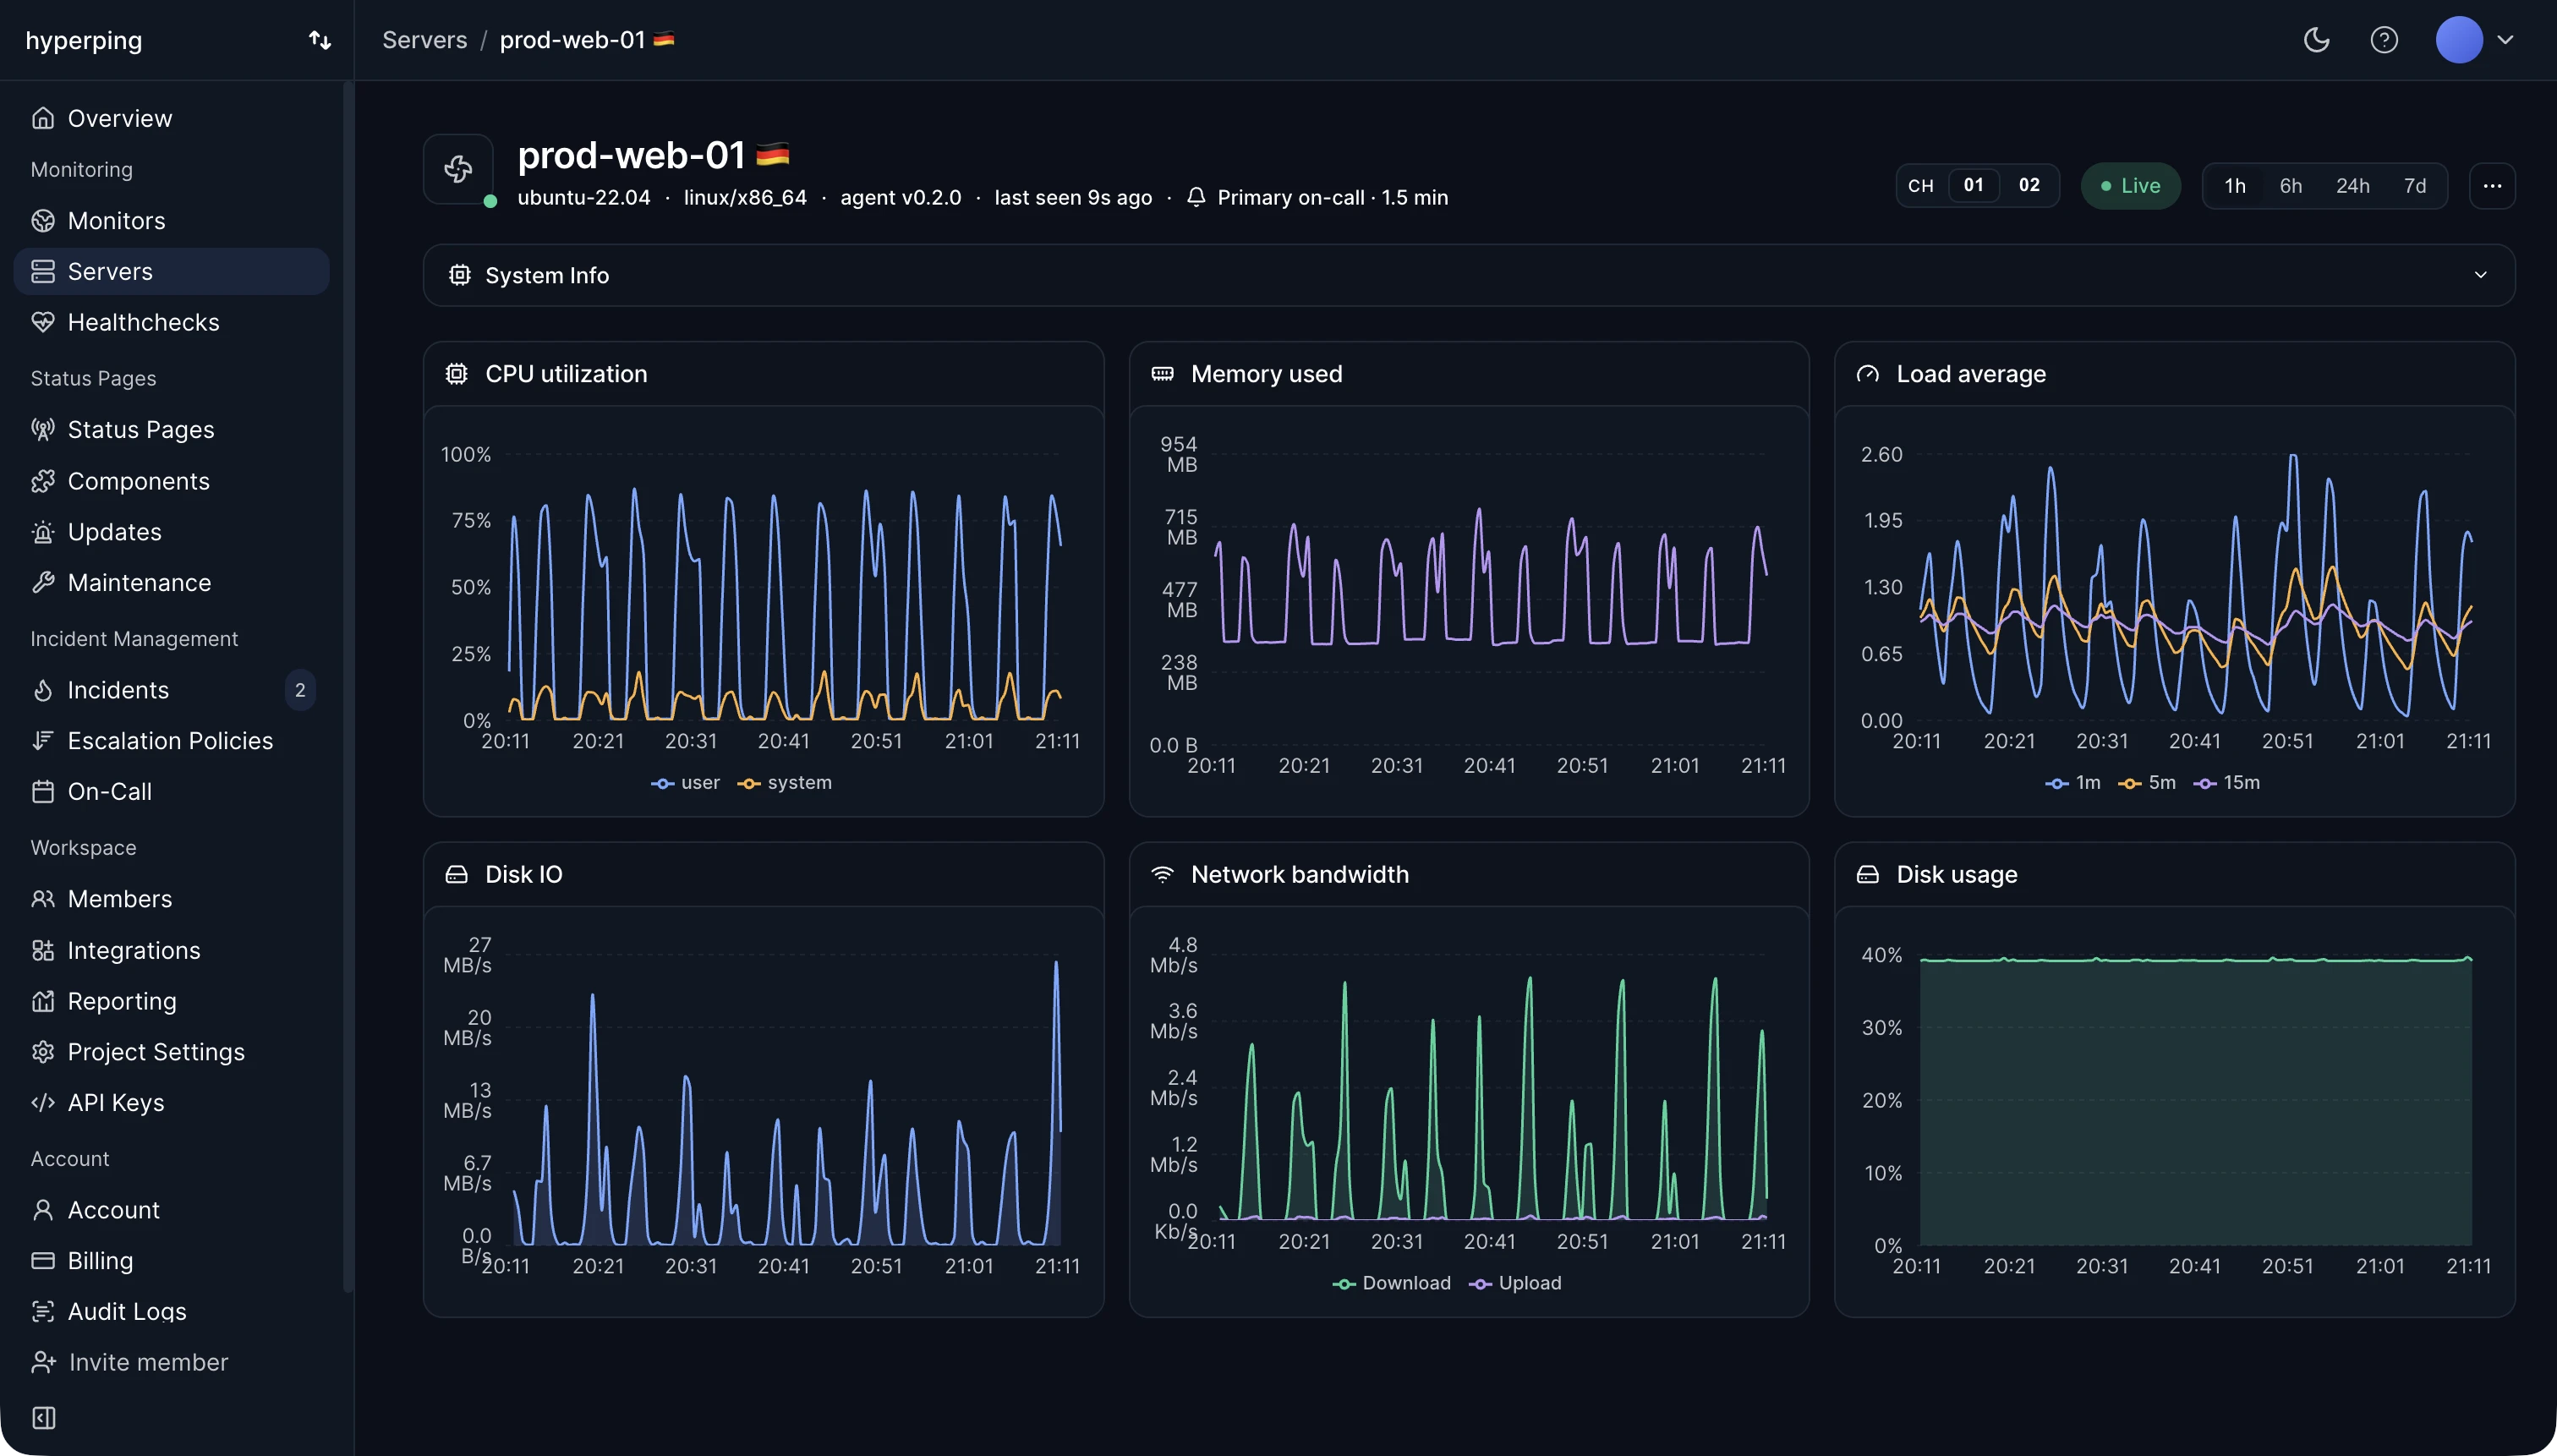
There is no separate heartbeat; a server is considered live as long as its metrics keep arriving. Anything outside the accepted set below is dropped silently server-side.
CPU
Processor metrics 3 metrics
system.cpu.utilizationpercentsystem.cpu.load_average.{1m,5m,15m}scalar/proc/loadavg on Linux and sysctl on macOS.system.cpu.logical.countcountMemory
Memory metrics 3 metrics
system.memory.usagebytesused, free, buffered, cached, slab_reclaimable, slab_unreclaimable), as reported by the kernel.system.memory.utilizationpercentsystem.memory.limitbytesFilesystem
Filesystem metrics 1 metric
system.filesystem.usagebytesdevice, mountpoint, mode, and type attributes. Rendered in the dashboard as a per-mount Filesystems table. The dashboard computes the utilization percentage from these two values, so there is no separate system.filesystem.utilization series to query.Disk I/O
Block device metrics 1 metric
system.disk.iobytesdirection attribute. Operation counts (system.disk.operations) are not ingested today.Network
Interface counters 1 metric
system.network.iobytesdirection. The dashboard derives TX and RX byte rates from this in the Network table. Packet counts, per-interface errors, and dropped-packet counters are not ingested today.Host metadata
Host metadata rides on every OTLP payload as resource attributes, so the dashboard stays accurate across reboots, kernel upgrades, and agent upgrades without any metadata-specific endpoint.
gethostname.Ubuntu 22.04 or macOS 14.5.uname -r).amd64 or arm64.Uptime
System lifetime 1 metric
system.uptimesecondsCollection cadence
30 seconds by the embedded OTel hostmetrics receiver./var/lib/hyperping/queue and retried automatically, so metrics survive ingest outages, reboots, and network blips.Retention
How far back the dashboard can scroll on each plan. High-resolution data ages out first; coarser rollups live longer, so a 6-month-old graph on Business still shows hourly points even after the minute-level data has been deleted.
The 48-hour raw-scrape cache is uniform across plans. It is what the live server view reads for the current values on each panel, not what backs the historical charts. If you need longer retention than Business offers (audit, compliance), reach out; custom retention windows are available on Enterprise.