The best Linux server monitoring tools in 2026 fall into two groups. For a spot check on one box, use the tools already in your distribution's repositories: htop or btop, vmstat, and the sysstat package (iostat, mpstat, sar), with glances if you want everything on one screen. For 24/7 monitoring with alerts, use a platform with an agent: Prometheus + node_exporter + Grafana or Zabbix if you want to self-host, Netdata for per-second dashboards, Datadog if you also need logs and APM, and Hyperping if you want a hosted agent, on-call paging and status pages in one account.
The split matters more than the tool you pick inside each group. CLI tools tell you what is happening right now, while you are logged in. They do not tell you anything at 3am, when the disk fills or the host stops answering and nobody has an SSH session open. For that, something has to keep collecting and someone has to be paged.
In this guide, you'll learn:
- Which command-line tools to use for which question, with real commands and output
- Five monitoring platforms for Linux, with pricing checked on September 28, 2026
- Which ones are open source and free, and what "free" costs you in maintenance
- How to set up Hyperping on a Linux server, and what it does not cover
Key takeaways
- htop, vmstat and iostat answer "what is this server doing right now" in under a minute, and cost nothing. They keep no history and alert no one.
- sar is the only built-in tool with history, and only after you enable the sysstat collector. It still alerts no one.
- Prometheus + node_exporter + Grafana is the open-source default for metrics, but you assemble and run four components, including Alertmanager for notifications.
- Zabbix is the strongest self-hosted all-in-one for large Linux fleets. Netdata gives per-second data with almost no setup. Datadog starts at $15/host/month billed annually and grows with every add-on.
- Hyperping pages your on-call when a Linux server stops reporting, from $24/month billed annually for 5 agents. It does not alert on metric thresholds like CPU above 90% today.
Why you should trust this guide
I'm Léo, founder of Hyperping. I have a stake in one of the tools on this list, so I've tried to be exact about where Hyperping stops: it collects host metrics and pages on liveness, and it has no threshold alerts, logs, APM or per-process metrics.
I checked every price and plan limit on the vendors' official pages on September 28, 2026, and read their Linux install and alerting documentation. The command output in this guide comes from Ubuntu and RHEL-family servers; your numbers will differ, the columns will not.
Top picks at a glance
| Best for | Tool |
|---|---|
| Interactive look at load, CPU and processes on one box | htop / btop |
| Run queue, blocked tasks and iowait on one line | vmstat |
| Per-disk latency and per-core CPU | iostat / mpstat (sysstat) |
| History on a single server without extra software | sar (sysstat) |
| Everything on one screen, locally or over a browser | glances |
| Open-source metrics and dashboards you control | Prometheus + node_exporter + Grafana |
| Per-second metrics with almost no configuration | Netdata |
| Self-hosted all-in-one for hundreds of Linux hosts | Zabbix |
| Host metrics, logs, traces and APM in one SaaS | Datadog |
| Hosted agent with on-call paging, uptime checks and status pages | Hyperping |
What to watch on a Linux server
Every tool below reads the same kernel files, mostly under /proc and /sys. Whatever you choose, it should cover these signals:
| Signal | The number that matters | Failure it catches |
|---|---|---|
| CPU | Time per state (user, system, iowait, steal), per core | Runaway process, noisy neighbour on a VM, storage stall |
| Load average | 1, 5, 15 minute values divided by core count | Queueing that a CPU percentage hides |
| Memory | MemAvailable as % of MemTotal, not used |
OOM killer about to terminate your process |
| Filesystem | Used and free bytes per mount | A full root partition taking down writes and logs |
| Disk I/O | Throughput and await per block device | Saturated or throttled volume |
| Network | Bytes in and out per interface | Saturated link, unexpected egress |
| Liveness | Time since the host last reported | The server is gone and nothing else will tell you |
The last row is the one CLI tools cannot give you. A dead server reports nothing, so noticing it has to happen somewhere else. For the thresholds worth alerting on per signal, see server monitoring alert thresholds.
Linux server monitoring tools compared
Prices checked on the vendors' official sites on September 28, 2026, in USD.
| Tool | Type | License / hosting | Alerting | Free option | Paid from |
|---|---|---|---|---|---|
| top / htop | CLI | GPL, in every distro | None | Free | Free |
| vmstat | CLI | GPL, procps (preinstalled) | None | Free | Free |
| iostat / mpstat / sar | CLI | GPL, sysstat package | None | Free | Free |
| glances | CLI + web UI | LGPL, pip or distro package | Colour thresholds on screen | Free | Free |
| btop | CLI | Apache 2.0, distro package | None | Free | Free |
| Prometheus + node_exporter + Grafana | Platform | Apache 2.0 / AGPLv3, self-hosted or Grafana Cloud | Alertmanager rules on any metric | Self-hosted; Grafana Cloud Free (10k series, 14 days) | Grafana Cloud Pro $19/mo + usage |
| Netdata | Platform | GPLv3 agent, Netdata Cloud or on-prem | Preconfigured alerts, anomaly detection | Community, 5 nodes | $4.50/node/mo billed annually |
| Zabbix | Platform | AGPLv3, self-hosted or Zabbix Cloud | Triggers, escalations | Free, self-hosted | Zabbix Cloud $50/mo |
| Datadog | Platform | SaaS | Monitors on any metric | 5 hosts, 1-day retention | $15/host/mo billed annually |
| Hyperping | Platform | SaaS | Pages on-call when a server stops reporting | 1 server agent | $24/mo billed annually (5 agents) |
Built-in and CLI tools: for checking one server right now
These are the tools to reach for when you are already logged in and something feels slow. They are free, most are one package away, and they share one limit: they only show the present, to whoever is looking.
top and htop: the first look
Perfect for: a 10-second answer to "is this box busy, and with what".
top ships with procps on every distribution. htop (apt install htop or dnf install htop) adds per-core bars, a process tree (F5), and mouse support. Both show load average, CPU split by state, memory, and the processes using the most of each.
$ top -bn1 | head -5
top - 10:12:41 up 41 days,  3:02,  1 user,  load average: 3.42, 2.87, 1.94
Tasks: 212 total,   2 running, 210 sleeping,   0 stopped,   0 zombie
%Cpu(s): 18.2 us,  4.1 sy,  0.0 ni, 54.5 id, 22.7 wa,  0.0 hi,  0.5 si,  0.0 st
MiB Mem :   7962.0 total,    318.4 free,   5421.2 used,   2222.8 buff/cache
MiB Swap:   2047.0 total,   1919.0 free,    128.0 used.   2097.6 avail Mem
Read wa (iowait) and st (steal) before blaming your application: 22.7% iowait points at storage. Read avail Mem, not free, because Linux fills spare RAM with page cache on purpose. How to monitor CPU usage on Linux and how to monitor memory usage on Linux go through each field.
Considerations: the CPU line is an average across cores, so one saturated core out of 8 reads as 12.5%. Press 1 in top, or use htop, to see each core.
vmstat: the one-line summary
Perfect for: telling CPU pressure from I/O pressure on an unfamiliar box.
vmstat is preinstalled (procps). It is the tool I reach for first, because it puts the run queue, blocked tasks and the CPU split on one line per second:
$ vmstat 1 5
procs -----------memory---------- ---swap-- -----io---- -system-- ------cpu-----
 r  b   swpd   free   buff  cache   si   so    bi    bo   in   cs us sy id wa st
 2  1 131072 325904 128444 2149832   0    0    12   380  742 1310 18  4 56 22  0
 3  2 131072 322108 128448 2151004   0    0     8  4210  981 1644 19  5 52 24  0
Column r is runnable processes, b is processes blocked on I/O, and wa is iowait. When b and wa are both non-zero, look at storage first. Compare r with the core count from nproc; Linux load average explained covers why load includes those blocked processes on Linux.
Considerations: the first line is an average since boot. Ignore it and read from the second line on.
iostat and mpstat (sysstat): per disk and per core
Perfect for: confirming a storage problem and finding the device.
Both come with the sysstat package (apt install sysstat or dnf install sysstat), which is not installed by default on Ubuntu Server or minimal RHEL images.
$ iostat -xz 2 3
Device     r/s   rkB/s  r_await    w/s     wkB/s  w_await  aqu-sz  %util
nvme0n1  12.00  480.00     0.42 310.50  22436.00    14.82    4.63  92.40
A w_await of 14.82 ms on NVMe is slow for that class of hardware, and it matches the 22% iowait above. Read await and aqu-sz rather than %util, which means little on multi-queue NVMe. mpstat -P ALL 2 3 gives the same CPU split as top, per core, which is how you find the one core stuck in iowait. The full walkthrough is in troubleshooting high iowait and disk I/O.
Considerations: the output above is trimmed to the useful columns; the real one has about 20.
sar (sysstat): history on one box
Perfect for: "what was this server doing at 3am" when nothing else was recording.
sar replays CPU, memory, disk and network from files the sysstat collector writes every 10 minutes by default. The collector is off until you enable it: systemctl enable --now sysstat on RHEL, Rocky, Alma and Fedora; on Debian and Ubuntu, set ENABLED="true" in /etc/default/sysstat and restart the service.
$ sar -u -f /var/log/sysstat/sa28 -s 02:50:00 -e 03:20:00
02:50:01 AM     CPU     %user     %nice   %system   %iowait    %steal     %idle
03:00:01 AM     all     12.40      0.00      3.10     41.85      0.00     42.65
03:10:01 AM     all     11.95      0.00      2.98     44.12      0.00     40.95
Files live in /var/log/sysstat/ on Debian and Ubuntu and /var/log/sa/ on RHEL-family systems. sar -n DEV 1 3 gives live per-interface throughput, covered in how to monitor network throughput on Linux.
Considerations: 10-minute averages hide short spikes, the data lives on the server it describes, and sar still alerts no one. If that server dies, so does its history.
glances: everything on one screen
Perfect for: a single dashboard view over SSH, or in a browser on a home lab.
glances (apt install glances, or pip install glances) shows CPU, load, memory, disk I/O, filesystems, network, sensors and processes in one terminal screen, and colours values that cross its thresholds. glances -w serves the same view over HTTP on port 61208, and it can export to InfluxDB or Prometheus.
Considerations: the colours are thresholds for your eyes, not notifications. Once you are exporting glances data to a time-series database, you are building a monitoring platform, and one of the tools below will do it with less glue.
btop: the nicest-looking top
Perfect for: reading CPU, memory, disk and network graphs at once in the terminal.
btop is packaged in Ubuntu 22.04+, Debian 12+ and Fedora (apt install btop). It draws per-core CPU graphs, memory, per-disk and per-interface activity next to a process list you can filter and kill from.
Considerations: same limit as htop. It shows the last few minutes to whoever has it open.
Where the CLI tools stop
Every tool above answers questions you already thought to ask, while you are connected. Nearly every team then writes a cron script that pipes df -h into a Slack webhook, and it breaks for the same reasons:
- No history. You cannot tell whether the disk was already climbing last week.
- No fleet view. Twenty servers means twenty scripts and twenty messages.
- No liveness. A script on a dead machine sends nothing, and silence looks like health.
- Nobody is paged. A message in a channel at 3am is read at 9am.
That last gap is where a monitoring platform earns its cost. An agent keeps collecting, a backend off the host keeps the history, and when the server stops reporting, an outage opens and your on-call is paged. If that is the job you need done, Hyperping's Linux server monitoring installs with one command and pages whoever is on call when a host goes silent.
Monitoring platforms: for 24/7 watching and alerting
Each platform below runs an agent (or exporter) on every Linux host, stores history off the host, and notifies someone when a rule fires. They differ on who runs the backend, what they alert on, and what they cost.
Prometheus + node_exporter + Grafana: best open-source stack you control
Perfect for
Teams that already run Kubernetes or containers, want monitoring defined as code, and have someone who will own the stack.
Notable features
- node_exporter runs as a systemd service on each host and exposes CPU, memory, filesystem, disk, network and many other kernel metrics on port 9100. The current release is 1.12.1 (July 14, 2026). Its optional
systemdcollector reports unit states, and the textfile collector lets cron jobs publish their own metrics. - Prometheus scrapes those endpoints and stores the time series. PromQL expressions become alert rules, for example
node_filesystem_avail_bytes / node_filesystem_size_bytes < 0.1for 10 minutes. - Alertmanager groups, silences and routes alerts to email, Slack, PagerDuty or webhooks.
- Grafana draws the dashboards; the community "Node Exporter Full" dashboard is where most people start.
Pricing
- Self-hosted: free, Apache 2.0 (Prometheus, node_exporter, Alertmanager) and AGPLv3 (Grafana)
- Grafana Cloud Free: 10k active metric series, 14-day retention, 3 users
- Grafana Cloud Pro: $19/month platform fee including 10k series and 13-month metric retention, then from $6.50 per 1k series (Grafana pricing, checked September 28, 2026)
node_exporter exposes several hundred series per host, more on machines with many cores, mounts or interfaces, so the free tier fits a small fleet.
Considerations
You run four components, plus their storage, upgrades and high availability. Alertmanager routes notifications but has no on-call schedules or status pages, so teams add PagerDuty, Grafana IRM or similar. And a Prometheus server that goes down stops alerting too, so it needs its own watcher.
Is Prometheus right for you?
Choose it if metrics as code and PromQL are what you want, and running the stack is part of someone's job. Skip it if you have five VPSs and want a page when one dies.
Netdata: best for per-second metrics with almost no setup
Perfect for
Engineers who troubleshoot performance often and want high-resolution charts to appear without building dashboards.
Notable features
- One-line install with the kickstart script, which sets up a systemd service and detects what runs on the host.
- Per-second collection of system metrics, plus auto-detected collectors for common services and systemd units.
- Preconfigured alerts out of the box, and machine-learning anomaly detection on every metric.
- Data stays on the node by default; Netdata Cloud (or the on-premises version) gives a fleet view on top.
Pricing
- Community: free, up to 5 active nodes
- Homelab: $90/year, unlimited nodes, non-commercial use
- Business: $4.50/node/month billed annually (25% off versus monthly)
- Enterprise On-Premises: quote, from 200 nodes
Source: Netdata pricing, checked September 28, 2026. The agent itself is open source (GPLv3).
Considerations
Per-second data is great for diagnosis and a lot of noise if all you want is a page when a host dies. The preconfigured alerts are many; expect to spend time silencing the ones that do not matter to you. The Community plan limits notification integrations; Slack, Teams and PagerDuty routing sits in Business.
Is Netdata right for you?
Choose Netdata if you often need to see what a Linux box did second by second. Pair it with a paging tool if your team rotates on-call.
Zabbix: best self-hosted all-in-one for large fleets

Perfect for
Ops teams with Linux skills monitoring hundreds or thousands of servers, network devices and services from one self-hosted product.
Notable features
- Zabbix agent 2 on each host, with the "Linux by Zabbix agent" template covering CPU, memory, filesystems, disks, network and processes.
- systemd monitoring through agent 2's systemd plugin, which discovers units and reports their state.
- Triggers and escalations: trigger expressions over history ("free space on / below 10% for 15 minutes") and actions with escalation steps.
- Proxies for remote sites, plus SNMP and IPMI for hardware.
- License: AGPLv3 since Zabbix 7.0; 7.4 is the current release.
Pricing
- Self-hosted: free, no host limits
- Zabbix Cloud: from $50/month (Nano, 50 new values per second) up to $5,000/month; 5-day trial, 10% off annual (Zabbix Cloud, checked September 28, 2026)
Considerations
The server and its database are yours to size, back up and upgrade. Templates, macros and trigger syntax take weeks to learn well. As with Nagios before it, the cost is the person who owns it, not the license.
Is Zabbix right for you?
Choose Zabbix if you have someone to own a monitoring server and you want full control over what is collected on every host. Skip it if nobody wants that job.
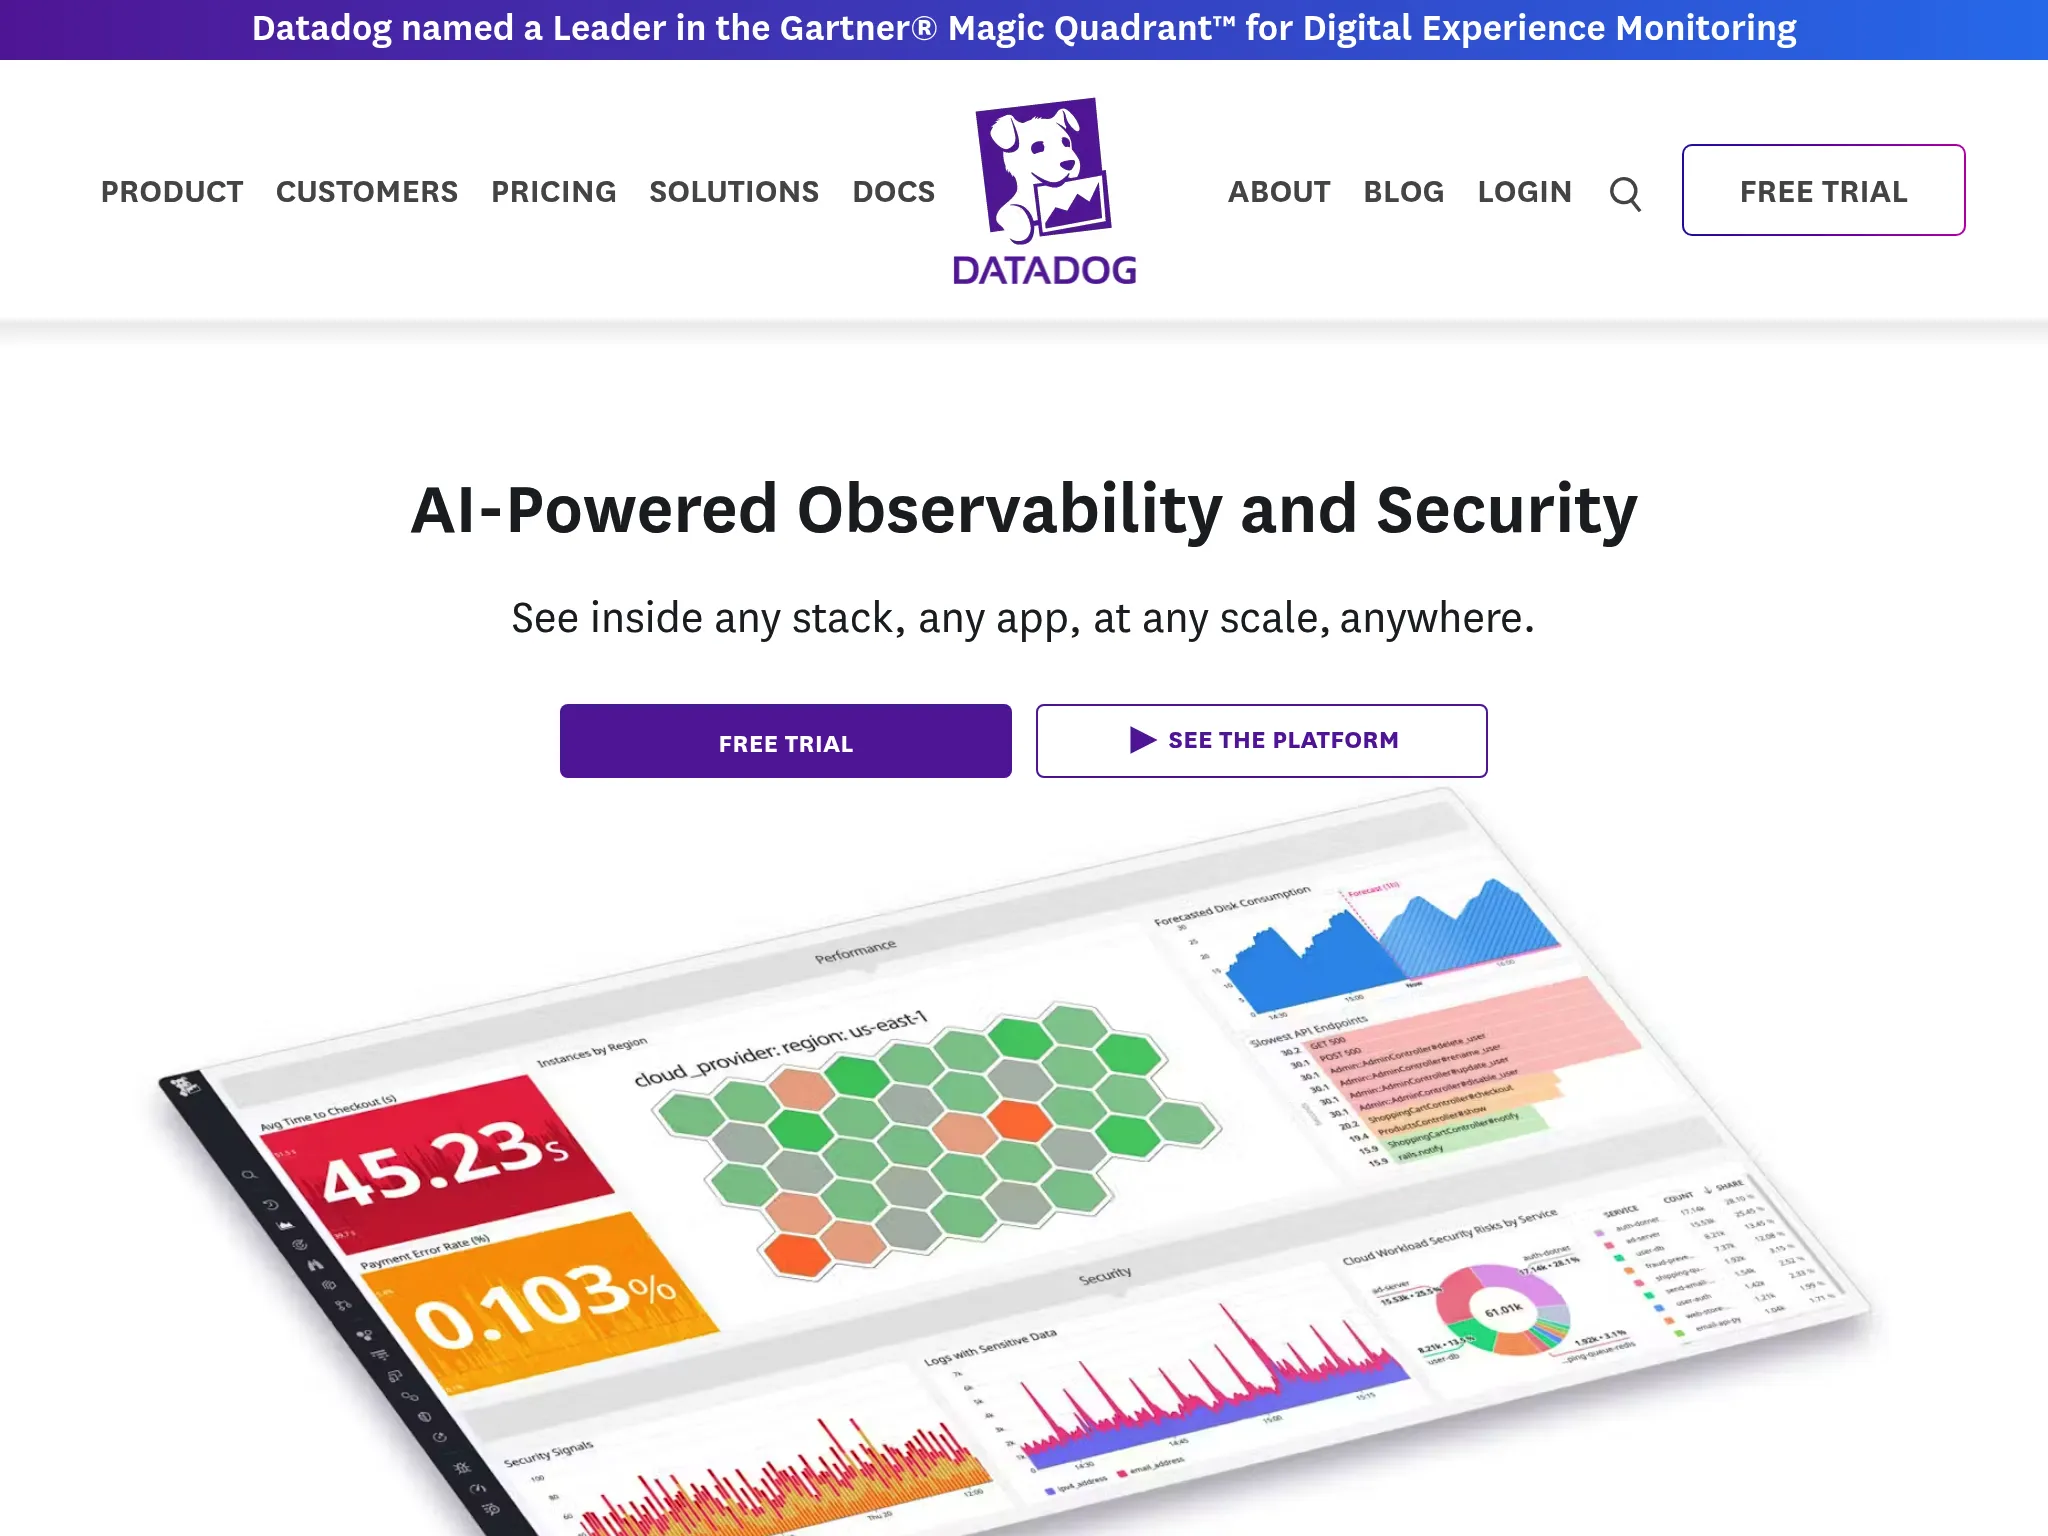
Datadog: best for full observability
Perfect for
Engineering teams whose Linux hosts sit inside a larger cloud stack, and who need host metrics, logs, traces and APM in one place.
Notable features
- Agent install with one shell command and an API key, with packages for every major distribution and configuration management modules.
- Integrations for systemd, process checks, and more than 1,000 services.
- Monitors on any metric, including anomaly and forecast alerts ("/ will be full in 3 days").
- Logs, APM and RUM on the same hosts, billed separately.
Pricing
- Free: up to 5 hosts, 1-day metric retention
- Pro: $15/host/month billed annually, $18 on demand, 15-month retention
- Enterprise: $23/host/month billed annually, $27 on demand
Source: Datadog pricing, checked September 28, 2026. Logs, APM, extra custom metrics and paging are separate line items; the Datadog pricing breakdown walks through a realistic bill.
Considerations
Cost grows with every host and every product you turn on. Twenty Linux servers on Pro is $300/month for infrastructure metrics alone, before logs or APM. The interface is dense if all you want to know is whether your servers are healthy.
Is Datadog right for you?
Choose Datadog when you need to follow an incident from a host metric to the log line and the trace. If you only need host health and paging, the Datadog alternative comparison covers the lighter options.
Hyperping: best for small teams that want paging, uptime checks and status pages with their host metrics
Perfect for
Small and mid-sized teams running a handful to a hundred Linux servers next to websites and APIs, who want someone paged when a box goes dark, without running a monitoring server.
Notable features
- One command, systemd service. The installer runs on Linux with systemd (amd64 and arm64), checks the download's SHA256 and registers
hp-agent.service. macOS and Windows agents exist too. - Metrics every 30 seconds from an embedded OpenTelemetry collector (about 50 MB of memory): CPU per state and per core, 1/5/15 minute load, memory per state, used and free space per mount, bytes read and written per disk, bytes in and out per interface, plus OS, kernel and CPU model.
- Paging when a server stops reporting. A server turns Stale after about 30 seconds without metrics (UI only) and Offline after its threshold (default 90 seconds, minimum 60). Offline opens an outage and runs the escalation policy bound to that server: email, SMS, phone calls, Slack, Teams, PagerDuty, OpsGenie, webhooks or an on-call schedule.
- No gaps after a network cut. Unsent metrics queue on disk at
/var/lib/hyperping/queueand are sent when the link returns. - Uptime monitors, on-call and status pages in the same account: HTTP, ping, port, SSL and cron heartbeat checks.
Pricing
- Free: 1 server agent, 20 monitors, 1 basic status page
- Essentials: $24/month billed annually ($29 monthly), 5 server agents, 50 monitors, on-call and escalation policies
- Pro: $74/month billed annually ($89 monthly), 20 server agents, 250 monitors
- Business: $249/month billed annually ($299 monthly), 100 server agents, 1,000 monitors
Server alerting is included on all paid plans. Per-minute history is kept 2 days on Free, 7 on Essentials, 14 on Pro and 30 on Business, and hourly rollups go back 6 months on Essentials and 13 months on Pro and Business. The pricing page has the full table.
Considerations
Alerting is based on liveness. Hyperping pages you when a server stops reporting, not when CPU crosses 90% or a disk crosses 85%: you see those numbers on the dashboard, but threshold alerts on metric values are not part of the product today. It also has no logs, traces, APM, per-process or container metrics, and swap and packet error counters are not ingested. There is no self-hosted edition.
Is Hyperping right for you?
Choose Hyperping if your main fear is a Linux server dying at 3am with nobody noticing until customers do, and you would rather run one command than operate Prometheus or Zabbix. It fits best when the same team also watches the websites those servers host and publishes a status page. If you need threshold alerts on disk or memory today, run it next to node_exporter rules, or pick Zabbix or Datadog.
Free and open-source Linux server monitoring tools
Everything in the CLI group is free and open source. For continuous monitoring:
- Free and open source, self-hosted: Prometheus + node_exporter (Apache 2.0), Grafana (AGPLv3), Zabbix (AGPLv3), Netdata agent (GPLv3). No host limits.
- Hosted, with a free tier: Netdata Community (5 nodes), Datadog (5 hosts, 1-day retention), Grafana Cloud Free (10k series, 14 days), Hyperping Free (1 server agent, 2 days of per-minute history, no server alerting).
Free to download is not free to run. A self-hosted stack needs a server, backups, upgrades and someone who notices when the monitoring itself is down. For two or three VPSs, how to monitor a VPS shows a lighter setup.
Which Linux server monitoring tool should you choose?
- Choose htop, vmstat and sysstat for diagnosing one server by hand. Install sysstat on every host anyway; it costs nothing.
- Choose Prometheus + Grafana if you run containers or Kubernetes and want metrics as code.
- Choose Netdata if per-second detail matters more than long-term history.
- Choose Zabbix for hundreds of hosts, one self-hosted product, and an owner to run it.
- Choose Datadog if you need logs, traces and APM correlated with host metrics, and the budget allows it.
- Choose Hyperping if you want someone paged when a Linux server goes silent, plus uptime checks and a status page, without running a monitoring server.
Nothing stops you from combining them: sysstat on every box for forensics, and a platform for alerting.
How to use Hyperping for Linux server monitoring
This takes about five minutes for the first server. Every command below is from the agent install docs.
1. Install the agent with one command
In Hyperping, open Servers, add a server and copy the install command. It already contains your token. Run it on the host:
curl -fsSL https://hyperping.com/install.sh | sh -s HP_INSTALL_xxxxxThe script is POSIX sh, needs root, curl and tar, and outbound HTTPS to api.hyperping.io and ingest.hyperping.io. For a fleet, pass --name, --policy and --group after the token, or the matching HP_DISPLAY_NAME, HP_POLICY_UUID and HP_GROUP_NAME environment variables, from Ansible or Terraform.
2. Check the service with systemctl
$ sudo systemctl status hp-agent.service
● hp-agent.service - Hyperping Agent (OpenTelemetry Collector)
     Loaded: loaded (/etc/systemd/system/hp-agent.service; enabled; preset: enabled)
     Active: active (running) since Mon 2026-09-28 09:14:02 UTC; 3min ago
       Docs: https://hyperping.com/docs/agent
   Main PID: 18342 (hp-agent)
     Memory: 48.6M
     CGroup: /system.slice/hp-agent.service
             └─18342 /usr/local/bin/hp-agent --config=/etc/hyperping/agent.yaml
If it is not running, sudo journalctl -u hp-agent.service -f shows why; a blocked egress firewall is the most common cause. Config lives in /etc/hyperping/, logs in /var/log/hyperping/.
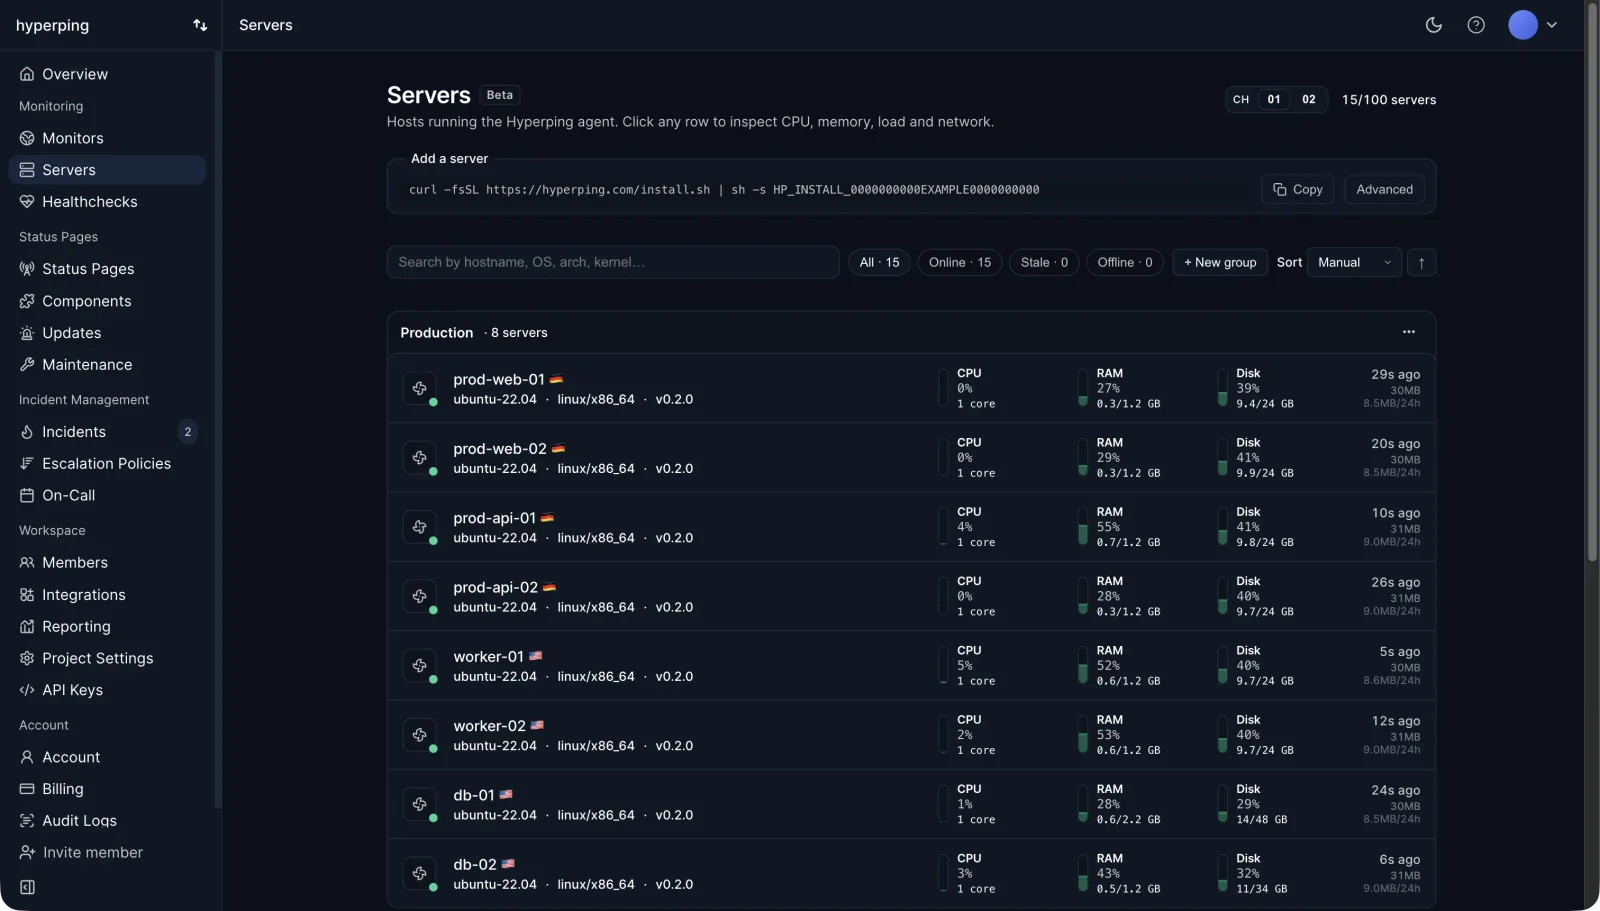
3. Read the metrics on the server page
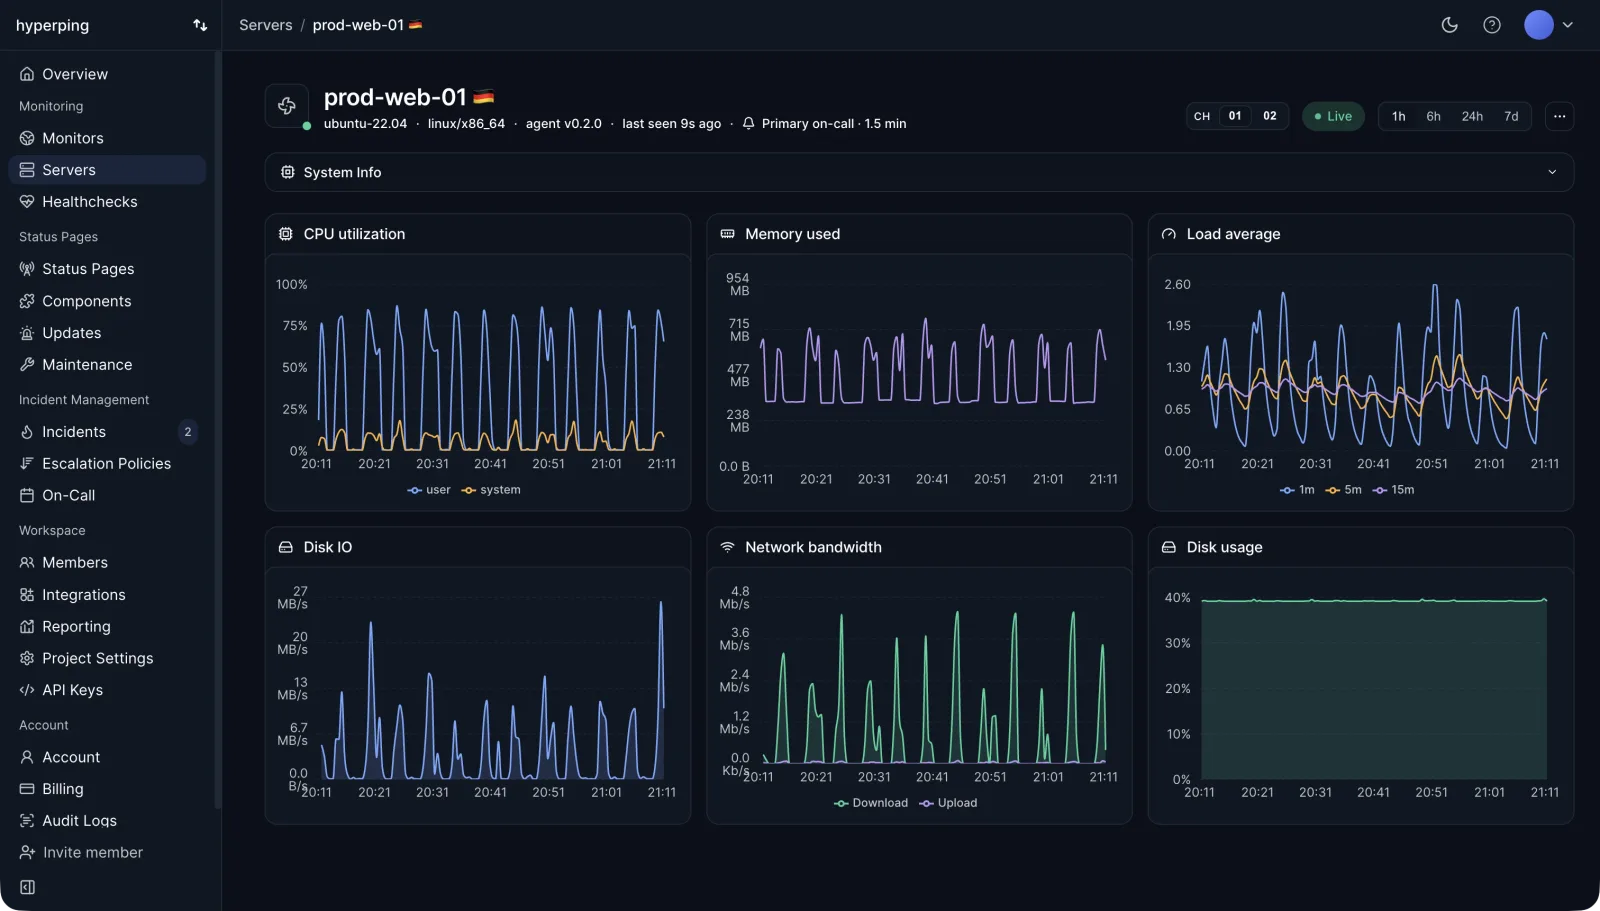
The first scrape shows up within seconds. The server page charts CPU per state, load averages, memory, disk I/O, network and disk usage over the same window, with a per-mount filesystem table and host details (OS, kernel, architecture, CPU model, boot time). The metrics collected reference lists every metric and retention per plan.
4. Bind an escalation policy and tune the offline threshold
On the server's Alerting panel, attach an escalation policy and set the offline threshold: longer than your worst network blip, shorter than you would want to wait before being paged. To test it, stop the agent on a non-critical server with sudo systemctl stop hp-agent.service and wait for the page; start it again for the recovery notification. Route the policy to an on-call schedule so the page reaches whoever is on duty. Details are in the server alerting docs.
5. Add uptime checks for the services on the box
Host metrics say the machine is unhealthy. Uptime monitoring says users cannot reach it. Add HTTP, port or ping monitors for what the server hosts, from several regions, on the same escalation policy.
6. Publish a status page
Add those monitors to a status page, so the incident that pages your on-call also tells customers what is going on.
You can start on the free plan with one server agent, or try a paid plan free for 14 days to get server alerting.
Where to start
Install sysstat and enable its collector on every Linux server today; it is free and it is the only history you will have if everything else fails. Then pick one platform for alerting, and make sure it covers the case CLI tools never will: a server that stops answering while nobody is logged in. Once that is in place, add threshold alerts for disk space and memory, starting from the values in how to monitor disk space and get alerted.
FAQ
What is the best Linux server monitoring tool? ▼
For a quick look at one server, htop or btop plus the sysstat tools (iostat, mpstat, sar) cover almost everything. For 24/7 monitoring with alerts, Prometheus with node_exporter and Grafana is the open-source default, Zabbix suits large fleets that want one self-hosted platform, Netdata gives per-second dashboards with little setup, Datadog fits teams that also want logs and APM, and Hyperping fits small teams that want a hosted agent, on-call paging and status pages in one account.
What are the best free and open-source Linux server monitoring tools? ▼
top, htop, btop, vmstat, iostat, sar and glances are all free and ship in the standard repositories of Debian, Ubuntu, RHEL and Fedora. For continuous monitoring, Prometheus and node_exporter (Apache 2.0), Grafana (AGPLv3), Zabbix (AGPLv3) and the Netdata agent (GPLv3) are free to self-host with no host limit. Hosted free tiers also exist: Netdata Community covers 5 nodes, Datadog 5 hosts with 1-day retention, and Hyperping 1 server agent.
How do I monitor a Linux server from the command line? ▼
Start with htop or top for load, CPU and the top processes, then vmstat 1 to see the run queue, blocked tasks and iowait on one line. Install sysstat for iostat -xz (per-disk latency), mpstat -P ALL (per-core CPU) and sar (history, once the sysstat collector is enabled). df -hT and free -m cover disk space and memory.
Do I need an agent to monitor a Linux server? ▼
You need one if you want to be told when something goes wrong rather than look for it. CLI tools only show what is happening while you are logged in. An agent keeps collecting when nobody is watching, stores history, and lets an external service notice when the server stops reporting at all, which is the one failure the server cannot report itself.
Is Prometheus or Zabbix better for Linux server monitoring? ▼
Prometheus is better if you already run Kubernetes or containers, want metrics as code, and are fine assembling node_exporter, Grafana and Alertmanager yourself. Zabbix is better if you want one self-hosted product with a web UI, ready-made Linux templates and built-in escalations for hundreds of servers. Both are free, and both need someone to own the monitoring server.
How much does Linux server monitoring cost? ▼
The CLI tools and self-hosted Prometheus, Zabbix and Netdata are free apart from your own server time. As of September 28, 2026, hosted options start at $4.50 per node per month for Netdata Business (billed annually), $15 per host per month for Datadog Pro (annual), $50 per month for Zabbix Cloud, $19 per month plus usage for Grafana Cloud Pro, and $24 per month billed annually for Hyperping Essentials with 5 server agents.