To get alerted when a server goes down, run a check from outside the server and send its result to a channel that reaches a human. That check can be a cron script on a second machine that pings the host and tests a port, an external ping or TCP port monitor, or an agent on the server whose silence opens an incident. Email and Slack are fine for the record. For a server that matters at 3am, the alert has to escalate to SMS and then a phone call when nobody acknowledges it. This guide covers all four approaches, the setup I would use in Hyperping, how to keep false alarms out, and message templates you can paste into your own scripts.
Key takeaways
- A server cannot report its own death. Every working "server down" alert runs from somewhere else, or treats the server's silence as the signal.
- Ping (ICMP) tells you the host is reachable. A TCP port check tells you a specific service accepts connections. Neither tells you the application behind it is healthy.
- An agent that pushes metrics out works on hosts in private networks. In Hyperping the server goes Offline after 90 seconds of silence by default (60 second floor), opens an outage and pages the escalation policy bound to it.
- Confirm before you page. Hyperping double-checks every failed ping, port or HTTP check from your other selected regions before any alert goes out.
- Slack and email do not wake anyone up. Put SMS and a phone call behind them in an escalation policy, targeted at an on-call schedule rather than a named person.
What counts as "down"?
"The server is down" covers at least three different failures, and each check type sees a different subset of them.
| What actually broke | Example | Ping | TCP port | Agent silence | HTTP check |
|---|---|---|---|---|---|
| The host is gone | Kernel panic, power loss, terminated instance | Yes | Yes | Yes | Yes |
| The network path is broken | Firewall change, lost route, DDoS mitigation | Yes | Yes | Only if egress is also cut | Yes |
| The host is up, a service died | nginx or PostgreSQL crashed | No | Yes, on that port | No | Yes, if it is behind the check |
| The service answers but is broken | 500 errors, stuck worker | No | No | No | Yes, with a status or body assertion |
Ping alone misses the failure I run into most often, a crashed service on a healthy host. And agent silence is the only one of these checks that works when the host is not reachable from the internet at all, such as a database or a worker in a private subnet. Most teams end up combining two of these columns.
The four ways to get a server down alert
| Approach | Cost | Catches | Misses | Wakes someone up |
|---|---|---|---|---|
| DIY cron script on a second machine | Free, plus your time | Host and port failures seen from one place | Its own death, regional network issues | Only if you build SMS or calls yourself |
| External ping or port monitor | Free tier to low monthly | Host reachability, service ports, network path | Private hosts, broken application logic | Yes, with escalation |
| Agent heartbeat | Paid plans | Host death, frozen hosts, lost egress, private hosts | A dead service on a live host | Yes, with escalation |
| Hosted HTTP uptime check | Free tier to low monthly | Everything a user would see over HTTP | Non-HTTP services, the reason behind the failure | Yes, with escalation |
The rest of this guide goes through them in that order, because each one fixes a gap in the previous one.
Option 1: a DIY cron script with email and Slack
The cheapest server down alert is a bash script run by cron on a machine that is not the one being watched. This version treats the host as down only when both ping and a TCP port fail, since plenty of networks drop ICMP, and it waits for three consecutive failures before sending anything.
#!/usr/bin/env bash
# server-down-check.sh
# Run from cron on a DIFFERENT machine than the one being watched.

HOST="203.0.113.10"
PORT=22
THRESHOLD=3                     # consecutive failures before alerting
STATE="/var/tmp/server-down-${HOST}.state"
ALERT_EMAIL="oncall@example.com"
SLACK_WEBHOOK="https://hooks.slack.com/services/T000/B000/XXXX"

notify() {
  local subject="$1"
  local body="$subject | $(date -u +%Y-%m-%dT%H:%MZ) | checked from $(hostname)"
  printf '%s\n' "$body" | mail -s "$subject" "$ALERT_EMAIL"
  curl -fsS -X POST -H 'Content-Type: application/json' \
    --data "{\"text\":\"$body\"}" "$SLACK_WEBHOOK" >/dev/null
}

fails=$(cat "$STATE" 2>/dev/null || echo 0)

if ping -c 3 -W 2 "$HOST" >/dev/null 2>&1 || nc -z -w 5 "$HOST" "$PORT" 2>/dev/null; then
  if [ "$fails" -ge "$THRESHOLD" ]; then
    notify "RESOLVED: $HOST is reachable again"
  fi
  echo 0 > "$STATE"
  exit 0
fi

fails=$((fails + 1))
echo "$fails" > "$STATE"

if [ "$fails" -eq "$THRESHOLD" ]; then
  notify "DOWN: $HOST failed ping and TCP $PORT $THRESHOLD times in a row"
fi
exit 0
Schedule it every minute:
# crontab -e on the watcher machine
* * * * * /usr/local/bin/server-down-check.sh
With a one minute schedule and a threshold of 3, you hear about a dead host after roughly three minutes, get exactly one DOWN message instead of one per minute, and get a RESOLVED message when it comes back. The -W flag is the per-reply timeout in seconds on Linux (iputils). On macOS it is in milliseconds, so adjust it if the watcher is a Mac.
Email is the fragile part. The mail command needs a working mail transfer agent, and AWS and Google Cloud both restrict outbound port 25 by default, so on cloud instances the message silently goes nowhere. Send through an SMTP relay on port 587, or rely on the Slack webhook, which only needs outbound HTTPS.
Where the script stops being enough
The script works until one of these happens, and in my experience the first one always does eventually:
- The watcher dies. If the machine running cron is down, nothing checks anything and the silence looks exactly like good health.
- One vantage point. A broken route between the watcher and the server pages you for an outage your users never see. A broken route everywhere else goes unnoticed.
- Nobody acknowledges. A Slack message at 3:14am sits unread until 8:30. There is no step two.
- No voice or SMS. Adding them means a telephony API, a paid account, and more code to maintain.
- Private hosts. A database with no public IP cannot be pinged from outside at all.
The first gap has a cheap fix: make the watcher report in. Chain a healthcheck ping after the script so you get alerted when it stops running:
* * * * * /usr/local/bin/server-down-check.sh && curl -fsS https://hc.hyperping.io/TOKEN_IDThe other four are why most teams move off the script once a server matters. What you want at that point is to get paged when the server stops reporting, from checks that confirm the failure elsewhere before anyone is woken up, with an escalation chain that ends in a phone call.
Option 2: external ping and TCP port monitors
A ping monitor sends an ICMP echo request to the host. It either gets an echo response (up) or it does not (down). A port monitor opens a TCP connection to a host and port, and a refused or timed out connection counts as a failure. Neither needs anything installed on the server.
Use ping for anything that should simply be reachable: a bare server, a gateway, a VPN endpoint. Use a port monitor for the service your users actually connect to:
| Service | Monitor | Port |
|---|---|---|
| SSH | Port | 22 |
| SMTP | Port | 25 or 587 |
| PostgreSQL | Port | 5432 |
| Redis | Port | 6379 |
| Host or gateway reachability | ICMP | none |
ICMP has no port number, which trips people up when they write firewall rules for it. The ICMP port number explainer covers what to open instead. If a cloud firewall filters ICMP entirely, a ping monitor reports a healthy host as down, so monitor a TCP port on that host instead.
The limit of both is that they check reachability, not correctness. A port monitor reports PostgreSQL as up as long as something accepts the TCP connection, even if every query is failing. If the service has any HTTP surface, an HTTP uptime check with an expected status code is the stronger test.
Option 3: an agent whose silence is the alert
An agent flips the direction. Instead of something outside probing the server, a small process on the server pushes metrics out on a schedule, and the alert fires when they stop arriving. That catches a kernel panic, a terminated instance, a host frozen by memory pressure, and a lost network path, and it works on hosts in private subnets because it only needs outbound HTTPS.
The Hyperping agent scrapes every 30 seconds and ships the metrics over OTLP/HTTP. There is no separate heartbeat: liveness comes from metric arrival. A server moves through three states:
| State | When | What happens |
|---|---|---|
| Online (green) | Metrics arrived within the last scrape window | Nothing |
| Stale (orange) | The first scrape gap crosses 30 seconds | Shown in the UI only, no alert |
| Offline (red) | No metrics for longer than the offline threshold, 90 seconds by default | An outage opens and the bound escalation policy pages its channels |
When metrics arrive again, the outage resolves and a recovery notification goes to the same channels. The agent also keeps unsent batches in an on-disk queue (/var/lib/hyperping/queue on Linux), so a short outage on the ingest side does not lose data.
To be precise about scope: Hyperping server alerting fires on agent liveness only. The agent collects CPU, memory, filesystem, disk I/O and network metrics for the dashboard, but there are no threshold alerts on them, so "CPU above 90%" or "disk above 85%" rules have to live in your own tooling. The server alert thresholds guide covers which of those rules are worth writing.
The agent also cannot tell you that nginx died on a host that is otherwise fine. Metrics keep flowing, so the server stays green. Pair it with a port or HTTP monitor on the service itself.
Option 4: hosted HTTP uptime checks
If the server runs a website or an API, an HTTP check is the closest thing to what a user experiences: it catches the dead host, the broken route, the crashed service and the 500 error in one test. It will not tell you why, which is where the agent's timeline helps, and it does not cover SSH, databases or mail servers, which is where port monitors come in.
In practice I set up two layers per important server: the agent for host death, plus one HTTP or port monitor on the service users depend on.
How to set up server down alerts in Hyperping
Here is the setup from an empty project to a phone that rings when a server dies. Server alerting, escalation policies, on-call schedules and phone calls are all included from the Essentials plan.
1. Connect your notification channels
Channels are where alerts land. Set them up before anything else so the first real outage has somewhere to go:
- Email goes to the address on your account.
- SMS goes to the phone number in your account settings. Include the country code.
- Slack or Microsoft Teams alerts go to the channel you pick when you connect the integration. Slack has a test button that sends a fake Down and Up alert, so use it once.
- Phone calls use the same phone number as SMS, and can only be sent from an escalation policy.
- PagerDuty, Opsgenie, Telegram, Discord and webhooks are available too if your team already routes alerts through one of them. The full list is in the notification channels docs.
Ask every teammate who will be on call to add their own phone number, otherwise the schedule pages someone who cannot receive it.
2. Build an escalation policy on top of an on-call schedule
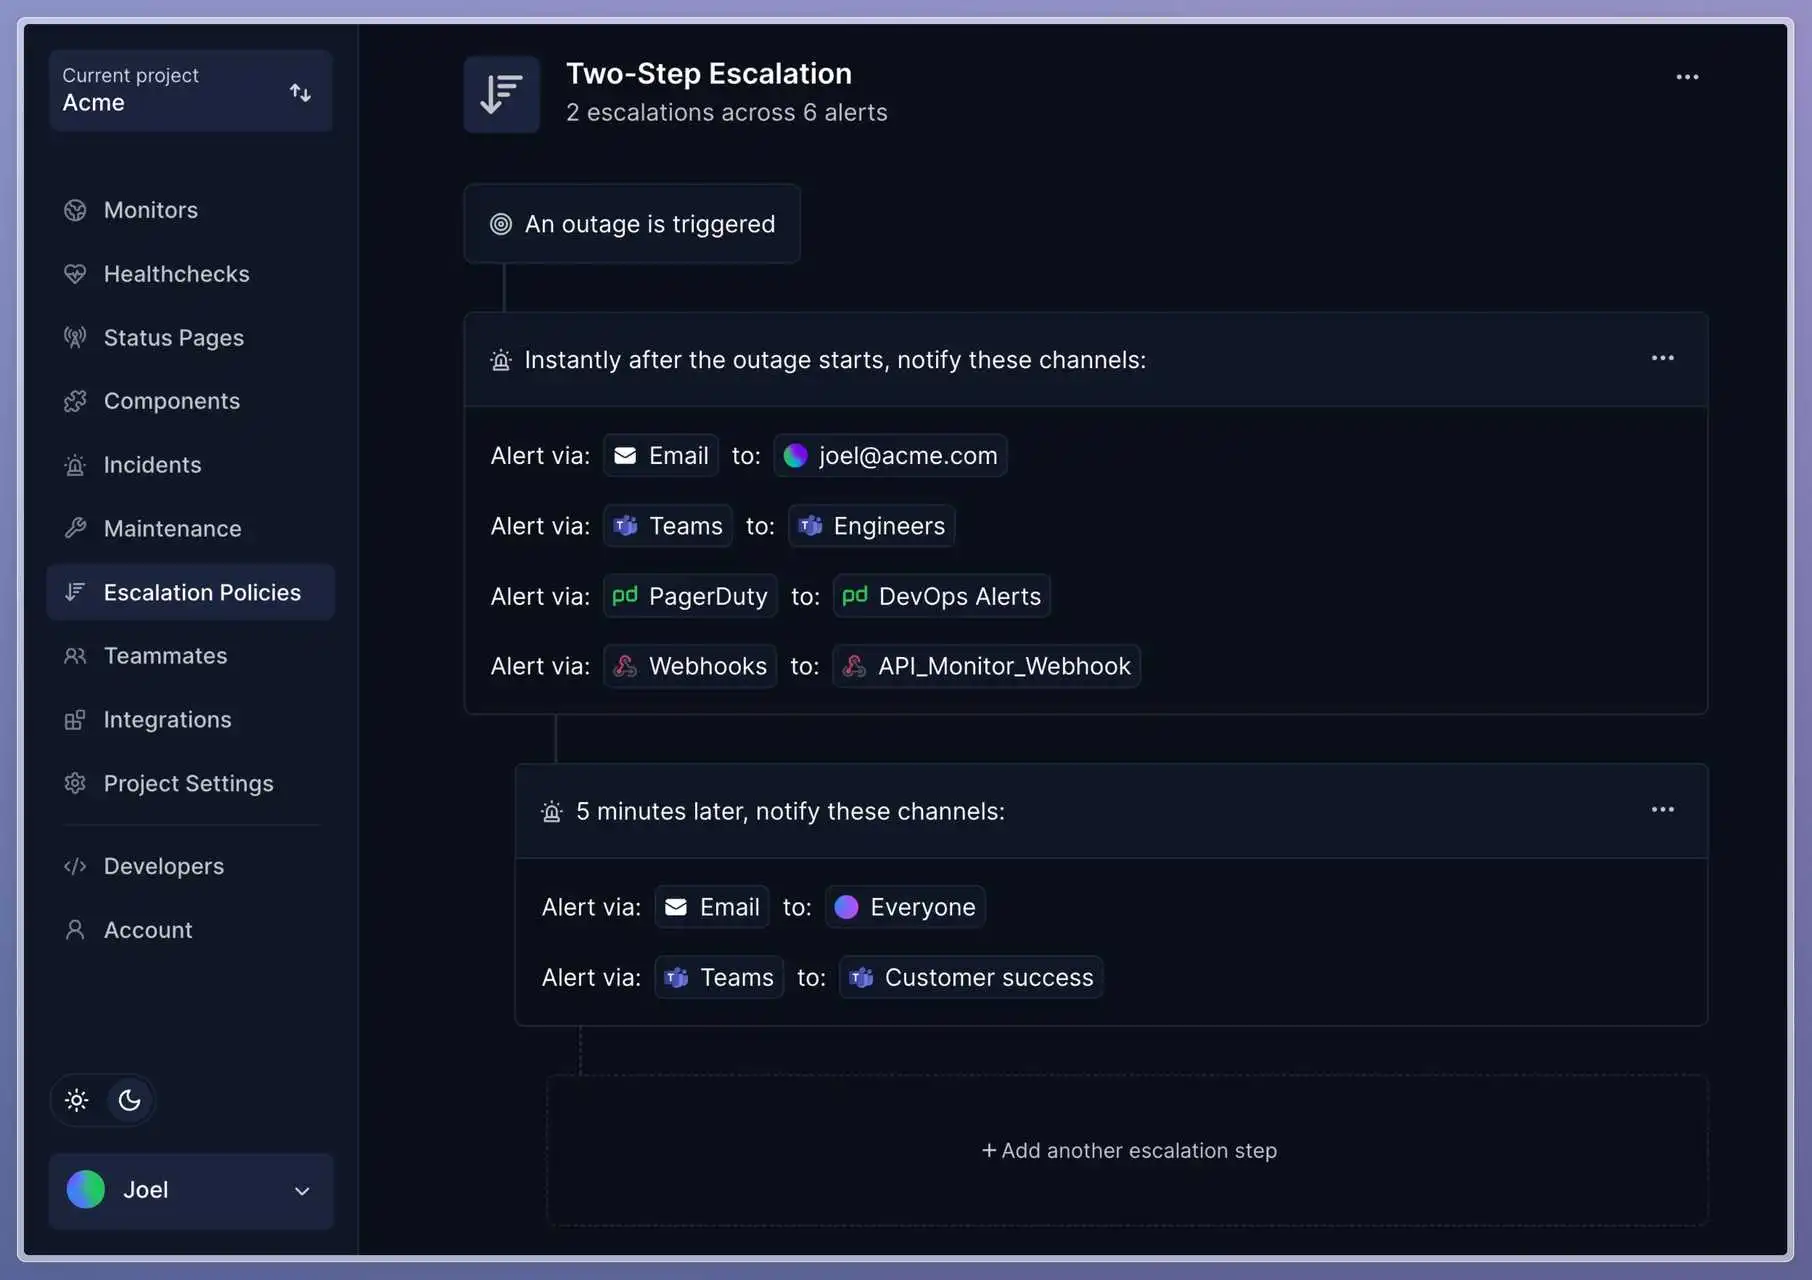
An escalation policy is a list of steps, each with a delay and a set of channels. If a step does not lead to an acknowledgement, the next one fires. If the incident resolves first, the remaining steps are cancelled.
Create an on-call schedule first, with one rotation per team or timezone, then select that schedule as the recipient for email, SMS and phone call steps. The alert then goes to whoever is on duty when the outage starts, including overrides for vacations and swapped shifts, rather than to a name you typed in months ago.
3. Install the agent and bind the policy
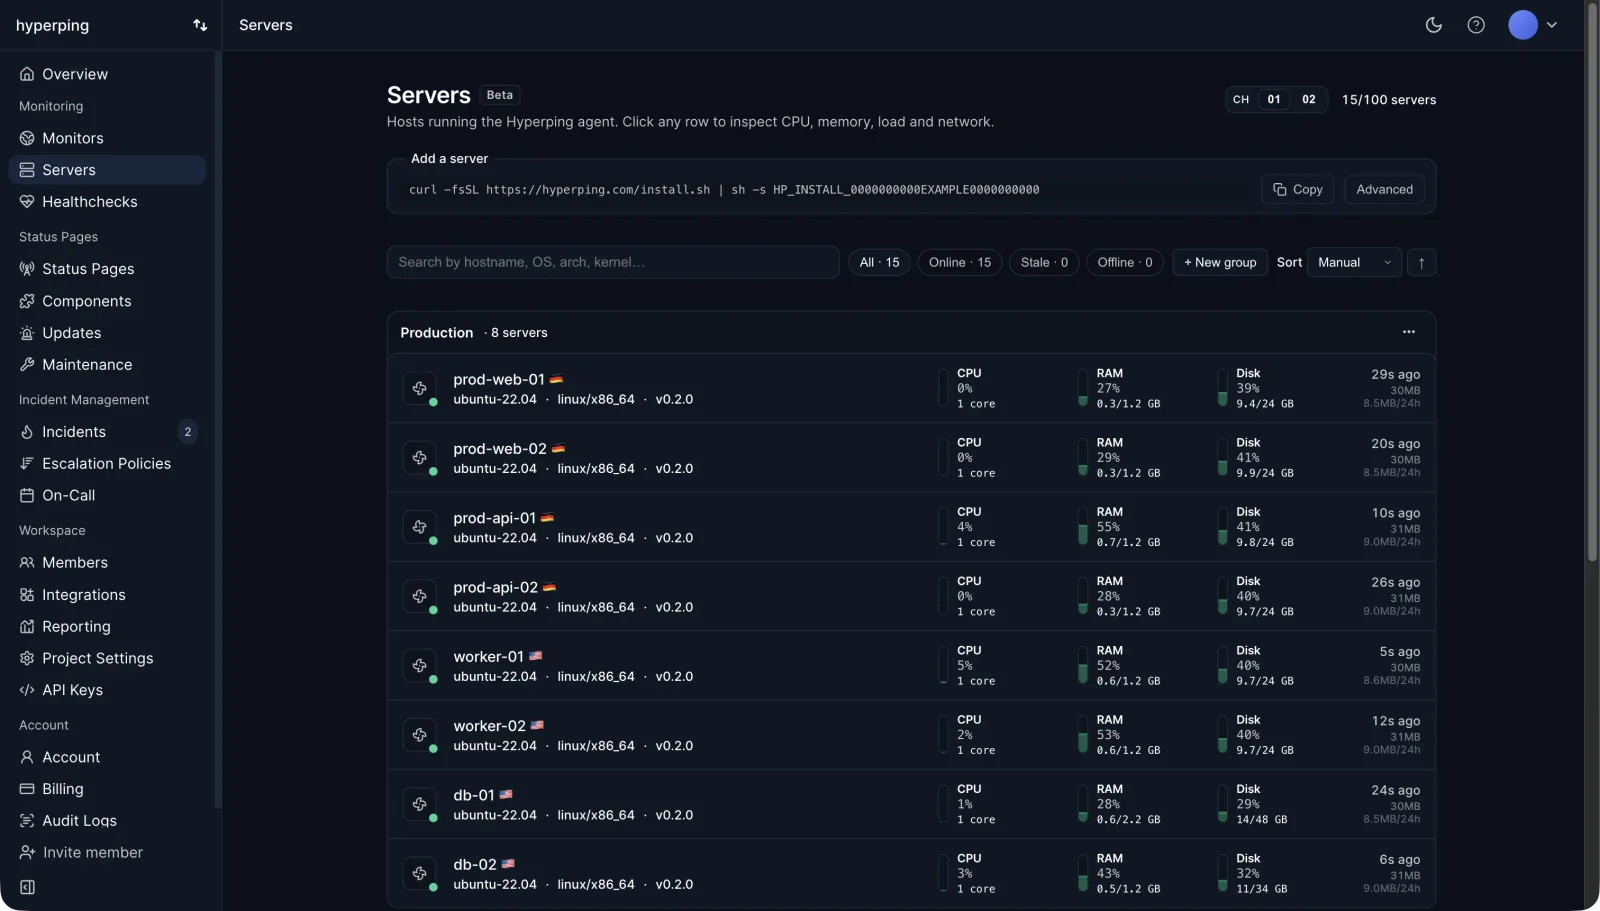
Add a server in the Servers view and run the install command on the host. Pass the policy's UUID (copy it from the policy detail page) with --policy so the server is protected from its first minute:
curl -fsSL https://hyperping.com/install.sh | sh -s -- \
  HP_INSTALL_xxxxx \
  --name "web-01" \
  --policy 6fe4c2e0-...
The installer supports Linux with systemd and macOS with launchd on amd64 and arm64, plus Windows 10 and Windows Server 2016 or later through a PowerShell script with the same options (-Name, -Policy). The host needs outbound HTTPS to api.hyperping.io and ingest.hyperping.io, and nothing inbound. If you skip the flag, bind the policy later from the Alerting panel on the server detail page. The install reference covers bound install tokens for fleets and re-enrollment.
4. Tune the offline threshold
The offline threshold is how long a server can go without sending metrics before it is marked Offline and pages someone. It is set per server from the same Alerting panel, defaults to 90 seconds, and cannot go below 60.
Pick a value longer than your worst expected network blip and shorter than you would want to wait before being paged. Keep planned reboots in mind too: a host that takes two minutes to come back will page on a 90 second threshold, so either raise the threshold for slow-booting machines or warn the on-call person before you reboot.
5. Add ping or port monitors for what the agent cannot see
Create a monitor, choose ICMP or Port as the protocol, and enter the hostname or IP without http://. For a port monitor, add the port number. Good candidates:
- The port your users connect to on each agent-monitored host, so a crashed service is caught even though the agent keeps reporting.
- Routers, firewalls, VPN endpoints and appliances where you cannot install an agent.
- Hosts at providers where you do not have root access.
Select three or four monitoring regions close to the server. The default check interval on paid plans is 30 seconds, and the free plan checks every 5 minutes. Assign the same escalation policy from the monitor's Notifications tab. Without a policy, a monitor alerts every configured channel at once.
6. Test the whole chain
An alert path you have never triggered does not work until proven otherwise. Pick a non-critical server and stop the agent:
# Linux
sudo systemctl stop hp-agent.service
# Windows, in an Administrator PowerShell window
Stop-Service hp-agentWait for the offline threshold to pass. You should get the first step, then each later step on schedule if you do not acknowledge. Start the agent again (sudo systemctl start hp-agent.service or Start-Service hp-agent) and check that the recovery notification arrives on the same channels.
Choosing channels so nobody misses the 3am alert
Each channel has a job. The mistake I see most often is picking one and expecting it to do all of them.
| Channel | Good for | Wakes someone up | Watch out for |
|---|---|---|---|
| Slack or Teams | Shared context, the team seeing the incident start | No | Muted channels, notifications off at night |
| A written record, recovery confirmation | No | Filters and folders, delivery delay | |
| SMS | Reaching the on-call person away from a laptop | Sometimes | Limited credits, silent mode |
| Phone call | The last step before a human is guaranteed to notice | Yes | Do Not Disturb, unknown numbers |
| PagerDuty, Opsgenie, webhook | Handing off to a paging tool you already run | Depends on that tool | Two tools to keep in sync |
A policy that holds up at night looks like this:
| Step | Delay | Channels | Recipient |
|---|---|---|---|
| 1 | 0 minutes | Slack #incidents and email |
The team |
| 2 | 5 minutes | SMS | On-call schedule |
| 3 | 5 more minutes | Phone call | On-call schedule |
| 4 | 10 more minutes | Phone call and SMS | Engineering lead |
A few details make the difference between a policy that exists and one that works:
- Page the schedule, not a person. A named recipient keeps getting paged after they change teams or go on vacation.
- Save the calling numbers in your contacts. Hyperping calls from +31 970 10 25 72 04 for European numbers and from +1 424 325 7650 for the US and other countries. Add them to contacts and allow them through Do Not Disturb or Focus, otherwise the phone may silence the call.
- Expect one call per 5 minutes at most. If a server flaps or several monitors fail together, you get a single call rather than a burst.
- Count your SMS credits. Teammate SMS alerts use plan credits: 20 per month on Essentials, 75 on Pro and 200 on Business. A flapping server can burn through 20 quickly, which is one more reason to put SMS behind Slack rather than in step 1.
- Keep the gaps short. Five minutes between steps means a missed page reaches the next person within ten. If the incident resolves before a step fires, that step and the ones after it are cancelled.
The escalation policies guide and the post on on-call rotations go deeper on delays, fallbacks and fair schedules.
How to avoid false server down alerts
A server down alert that turns out to be wrong costs more than the minutes spent checking it. After the third one, people start muting the channel, and then the real one gets missed. That pattern is alert fatigue, and most of it can be designed out.
Confirm from somewhere else before paging. Hyperping checks rotate through your selected regions one at a time. When a check fails, it is immediately rechecked from your other selected regions, and only if they all fail does an outage open. A monitor with one region has nothing to confirm against, so select three or four. The probes run on a mix of hosting providers across 18 regions, so a problem at one provider does not fail every check.
Use a port check where ICMP is filtered. Some networks and cloud firewalls drop ping entirely. The monitor then reports a healthy host as down on every check.
Size the offline threshold honestly. 60 seconds is the floor, and it is tight for hosts on flaky links. If a server pages you for 70 second network blips that fix themselves, raise its threshold rather than learning to ignore it.
Add an alert delay only to proven noisy monitors. Each monitor has an alert delay in its Notifications tab. With 5 minutes, a 2 minute outage never pages anyone. Every minute of delay is also a minute of real downtime nobody knows about, so start at zero.
Schedule maintenance windows for planned work on monitors, so a deploy or migration does not page the person on call.
Group related failures. When a rack or a region goes down, grouped alerts collapse several failing monitors into one notification instead of ten.
For your own scripts, the same rules apply: several consecutive failures before alerting, a second vantage point where you can, and a single message per incident rather than one per check. The false positive guide covers the rest.
Server down alert message templates
If you are writing your own alerts (in the cron script above, a webhook handler or a runbook), a good server down message answers five questions in the first line or two: which host, what failed, since when, seen from where, and what to open next. Copy these and replace the placeholders.
Slack or Teams
:red_circle: DOWN: web-01 (203.0.113.10)
Check: TCP 443 refused, ping timing out
Since: 2026-09-28 03:14 UTC (confirmed from 3 locations)
Impact: checkout API unreachable
Runbook: https://wiki.example.com/runbooks/web-01
On call: @alex
SMS (under 160 characters)
DOWN web-01 03:14 UTC. TCP 443 + ping failing from 3 locations. Runbook: ex.co/rb/web01 Reply in #incidentsPut the host and the word DOWN first. Lock screen previews cut long messages short, and the preview is often all the on-call person reads before deciding whether to get up.
Subject: [DOWN] web-01 unreachable since 03:14 UTC

web-01 (203.0.113.10) stopped responding at 03:14 UTC.

What failed:  TCP 443 connection refused, ICMP ping timing out
Checked from: Paris, Frankfurt, London (all failing)
Last good:    03:13 UTC
Impact:       checkout API, admin dashboard
Runbook:      https://wiki.example.com/runbooks/web-01
Dashboard:    https://monitoring.example.com/hosts/web-01

This alert repeats only if the state changes. A RESOLVED email follows on recovery.
For email alerts, keep the subject stable per incident ([DOWN] web-01 ...) so threads group correctly and filters can route them.
Recovery
:large_green_circle: RESOLVED: web-01 is reachable again
Down from 03:14 to 03:41 UTC (27 minutes)
Cause: pending, see #incidents thread
Always send the recovery message on the same channel as the alert. Without it, the person who was paged has to go and check whether it is safe to go back to sleep.
Customer-facing update
The internal alert is not what customers should read. When the outage is visible to users, post a short update on a status page instead:
Investigating: Checkout unavailable
We are seeing errors on checkout since 03:14 UTC and are investigating.
Next update within 30 minutes.
The incident communication templates cover the follow-up updates, from identified to resolved.
Where to start
If you have one server and no budget, run the cron script from a second machine, send to Slack, and chain a healthcheck ping onto it so you know when the watcher itself stops.
If the server matters to customers, move the check off your own infrastructure: an agent for host death, a port or HTTP monitor for the service on top, confirmation from several regions, and an escalation policy that ends in a phone call to whoever is on call. Then stop the agent on a test box once and make sure your phone rings.
FAQ
How do I get notified when my server goes down? ▼
Run a check from somewhere other than the server itself, because a dead server cannot report its own death. The options are a cron script on a second machine, an external ping or TCP port monitor, or an agent on the server whose silence triggers the alert. Route the result to Slack or email for the record, and to SMS or a phone call for anything that needs a human within minutes.
What should a server down alert message include? ▼
The host name, what failed (ping, a TCP port, an HTTP check or agent silence), when it started in UTC, where the check ran from, and a link to the runbook or dashboard. Put the host and the word DOWN at the very start so it survives a truncated lock screen preview, and send a matching RESOLVED message with the total duration when it recovers.
Can I get a server down alert by email for free? ▼
Yes. A bash script run from cron on a second machine can ping the server, test a TCP port and send mail with the mail command. It works as long as that second machine stays up and can deliver mail. AWS and Google Cloud both restrict outbound port 25 by default, so most setups send through an SMTP relay on port 587 instead.
How do I get a phone call when a server goes down? ▼
Use a monitoring tool that places voice calls, or build it yourself on a telephony API such as Twilio. In Hyperping, phone calls are a step in an escalation policy, available on all paid plans, and they can target whoever is on call through an on-call schedule. Save the calling numbers in your contacts so the phone does not silence them at night.
How do I stop false server down alerts? ▼
Require confirmation before anyone is paged: several consecutive failures, or a failure confirmed from a second location. Hyperping double-checks every failed ping, port or HTTP check from your other selected regions before it opens an outage. For agent-based alerts, set the offline threshold longer than your worst expected network blip.
What is the difference between ping monitoring and agent monitoring for server down alerts? ▼
A ping or port monitor probes the server from the internet, so it needs the host to be reachable from outside and it also catches network and firewall problems on the way in. An agent runs on the server and pushes metrics out, so it works on hosts in private networks with only outbound HTTPS, and the alert fires when those metrics stop arriving.