To monitor disk space on Linux, read used and free bytes per mount point rather than per host, check inodes separately with df -i, and alert on two conditions instead of one: a percentage threshold and an absolute free-space floor. A full disk is one of the most preventable outages there is, and almost every team that gets paged for one had a monitor watching the wrong number, or a static threshold that fired with no useful lead time.
Key takeaways
df -handdf -imeasure two different limits. A filesystem at 40% space used can still fail every write if inodes hit 100%, and the error is the same ENOSPC.- Alert per mount point. A host that averages 32% used can have a root filesystem with 8 GB left and a 500 GB data volume sitting idle.
- Percentage thresholds break at both ends of the scale: 5% free is 200 GB on a 4 TB volume (about 100 days of runway at 2 GB a day) and 1 GB on a 20 GB volume (about 12 hours).
- Use two rules. Warn at 75% used, page only when used is above 85% and free bytes are below a floor, and derive projected time to full from a trailing 7 day slope.
ducannot see deleted-but-open files. Whendfanddudisagree by gigabytes, runlsof +L1and look for a log file marked(deleted).
df -h tells you space, df -i tells you why writes are failing anyway
Start with space per mount, with pseudo-filesystems filtered out so you are not reading tmpfs entries that do not matter.
df -hT -x tmpfs -x devtmpfsFilesystem Type Size Used Avail Use% Mounted on
/dev/nvme0n1p2 ext4 78G 66G 8.1G 90% /
/dev/nvme0n1p1 vfat 511M 6.1M 505M 2% /boot/efi
/dev/mapper/data--vg-data xfs 500G 120G 380G 25% /var/lib/postgresqlTwo things in that output are worth pausing on. Averaged across the host, this machine is at roughly 32% used and looks healthy in any dashboard that reports a single number per server. Per mount, the root filesystem has 8.1 GB left.
The second is the reserve. On ext4, mkfs holds back 5% of blocks for root by default, and df excludes that reserve from Avail. So a volume can report 100% used while root still has room to write, and unprivileged processes have been failing for a while by then. On a 4 TB ext4 volume that reserve is 200 GB you are not using. tune2fs -m 1 /dev/sda1 drops it to 1% if the filesystem holds data rather than system files.
Now the failure most people never check for.
df -i -x tmpfs -x devtmpfsFilesystem Inodes IUsed IFree IUse% Mounted on
/dev/nvme0n1p2 5242880 5242871 9 100% /
/dev/mapper/data--vg-data 2621440 184220 2437220 8% /var/lib/postgresqlEvery write on / now fails with the No space left on device error, and df -h still shows 8.1 GB free. Inodes are a fixed count on ext2, ext3 and ext4, set when the filesystem is created and impossible to raise later without recreating it. One inode per file, per directory, per symlink. Millions of tiny PHP session files, an unrotated per-request log directory, or a mail queue that never drains will exhaust them long before the space runs out.
XFS allocates inodes dynamically up to imaxpct (25% of the filesystem by default), so inode exhaustion is much rarer there. On ext4, it is a real and regular incident.
Finding the culprit is a counting exercise, not a sizing one.
sudo find /var -xdev -type f | cut -d/ -f1-4 | sort | uniq -c | sort -rn | head -52841923 /var/lib/php
81244 /var/log/nginx
4102 /var/cache/apt
918 /var/lib/dpkg| Symptom | df -h |
df -i |
Usual cause |
|---|---|---|---|
| Writes fail, disk looks full | 100% | normal | Genuine space exhaustion |
| Writes fail, disk looks fine | 40% | 100% | Millions of small files, no cleanup |
df and du disagree by GB |
high | normal | Deleted file held open by a process |
| Root can write, app cannot | 100% | normal | ext4 5% root reserve |
Finding what filled the volume with du
du walks the tree and sums it. The flag that matters is -x, which keeps it on one filesystem so it does not follow you into another mount and confuse the arithmetic.
sudo du -xh --max-depth=1 / | sort -h | tail -61.2G /root
2.1G /usr
3.4G /home
8.9G /opt
42G /var
58G /Then descend into the biggest entry and repeat.
sudo du -xh --max-depth=1 /var | sort -h | tail -5124M /var/cache
1.1G /var/tmp
4.2G /var/lib
36G /var/log
42G /varTwo commands, and the answer is logs. On systemd hosts, check the journal before you start deleting files by hand:
journalctl --disk-usageArchived and active journals take up 3.8G in the file system.sudo journalctl --vacuum-size=1G reclaims most of that immediately. The permanent fix is SystemMaxUse=1G in /etc/systemd/journald.conf followed by sudo systemctl restart systemd-journald, because an unbounded journal defaults to 10% of the filesystem, capped at 4G, and climbs straight back to that ceiling. The cap is also why the journal is rarely the whole story on a volume this size: the remaining 32G here sits in /var/log/nginx, which is where the next section picks up.
Docker is the other usual suspect. docker system df breaks usage down into images, containers, local volumes and build cache, and build cache is regularly the largest line on a CI host. ncdu gives you an interactive version of the same walk (apt install ncdu or dnf install ncdu).
The space df sees and du does not
When df reports 66 GB used and du totals 58 GB, nothing is broken. Unix lets you unlink a file while a process still holds it open, and the blocks are only released when the last descriptor closes. du reads directory entries, so the file is invisible to it. df reads the filesystem's own accounting, so the blocks are still counted.
sudo lsof +L1COMMAND PID USER FD TYPE DEVICE SIZE/OFF NLINK NODE NAME
nginx 1487 www-data 5w REG 259,2 8589934592 0 262401 /var/log/nginx/access.log (deleted)NLINK 0 is the tell, and SIZE/OFF is 8 GB of space you cannot see in any directory listing. This is what a logrotate config without a postrotate signal produces: the file is renamed and removed, nginx keeps writing to the same descriptor forever, and the volume fills with a file nobody can find.
The safe fix is to make the process reopen its files: sudo systemctl reload nginx, or kill -USR1 for daemons that use it. Restarting works too. Truncating through /proc/<pid>/fd/<n> releases the space without a restart, but an appending writer keeps its old offset and leaves you with a sparse file, so I only reach for it when a restart is not an option. lsof is not always installed (apt install lsof or dnf install lsof), and find /proc/*/fd -ls 2>/dev/null | grep '(deleted)' covers you in the meantime.
Monitor per mount, never per host
A single "disk usage" number for a server is close to useless, because filling / and filling /var/lib/postgresql are different incidents with different owners and different fixes.
| Mount | What breaks when it fills | Typical cause |
|---|---|---|
/ |
Package installs, session setup, anything without its own volume | Everything that was not separated out |
/var |
Log writes, apt cache, Docker under /var/lib/docker |
Journal and log growth |
/var/lib/postgresql |
Postgres refuses writes, then stops | WAL retention, forgotten backups, bloat |
/boot |
Kernel upgrades fail, machine may not reboot cleanly | Old kernels never purged |
/tmp |
Builds, uploads, session files | A single runaway job |
The practical rule: every real mount point gets its own series and its own threshold. That is also why filesystem usage belongs in the same collection pass as disk I/O, CPU and memory, rather than in a separate script that only someone in the ops channel remembers exists.
Why a percentage threshold alone is wrong
The standard rule is "alert at 90% used". It fails in opposite directions depending on the size of the volume.
| Volume size | Free at 95% used | Runway at 2 GB a day | Verdict |
|---|---|---|---|
| 20 GB | 1 GB | about 12 hours | Fires far too late |
| 100 GB | 5 GB | 2.5 days | Roughly right |
| 500 GB | 25 GB | 12 days | Early |
| 4 TB | 200 GB | 100 days | Fires 3 months before it matters |
On the 20 GB root disk, 95% gives you half a day, most of it overnight. On the 4 TB data volume, the same rule pages someone about 200 GB of free space and 100 days of headroom, which is exactly how a team learns to ignore disk alerts. That habit then costs you the one time it was real, and alert fatigue is a much harder problem to undo than a threshold.
So use two conditions together:
- A percentage warning at 75% used, which catches small volumes early enough to act.
- A page only when used is above 85% and free space is below an absolute floor: roughly 5 GB on volumes under 100 GB, 20 GB up to 1 TB, 50 GB above that. Size it so the floor covers at least 72 hours of your observed growth.
Both rules are still static, and the duration window each one needs before it is allowed to wake anyone is in server monitoring alert thresholds, alongside the equivalent numbers for CPU, memory and load average. The one that actually prevents incidents is the third.
Growth rate is the metric that gives you lead time
Free space is a level. What you want to alert on is the slope. A volume with 8.1 GB free is fine if it has been flat for six months, and it is an incident tonight if it has been dropping 3 GB a day since Tuesday.
Time to full is the whole calculation:
hours_to_full = free_bytes / bytes_per_hourIf you have no history yet, start recording. One cron line per host is enough to get a slope within a week:
*/5 * * * * echo "$(date +\%s) $(df -P -B1 / | awk 'NR==2{print $4}')" >> /var/log/disk-free.logThe backslash is not optional. In a crontab command field an unescaped % is turned into a newline and everything after it is fed to the command as stdin, so the unescaped version never writes a line.
Two rules keep this honest. Compute the slope over at least 7 days, because a 5 minute window turns a single backup into a projection that the disk fills before lunch. And ignore sawtooth patterns: volumes that grow all day and drop when a nightly job runs need the slope measured trough to trough, not across the peak.
Once you have that, the alert becomes "this mount is projected to fill within 72 hours", which arrives during working hours with time to fix the cause instead of deleting files at 3 a.m. This is the same reasoning that applies to memory, and how to monitor memory usage on Linux covers the equivalent trap there, where used climbs by design and MemAvailable is the number that matters.
How to use Hyperping for disk space monitoring
Cron scripts get you a snapshot and a Slack message. They do not give you history, comparison across hosts, or a slope. This is the setup I would run instead, and the first host takes about ten minutes.
1. Install the agent on the host
Create a server in Hyperping, copy the install token, and run one line over SSH.
curl -fsSL https://hyperping.com/install.sh | sh -s HP_INSTALL_xxxxxThe agent is a compiled binary with an embedded OpenTelemetry collector, around 50 MB RSS and no JVM. It scrapes every 30 seconds and ships gzipped OTLP/HTTP, and if the network drops, samples queue on disk at /var/lib/hyperping/queue and survive reboots. Linux with systemd and macOS with launchd, amd64 and arm64. Windows is not supported yet. The agent install guide covers enrolment and the uninstall path.
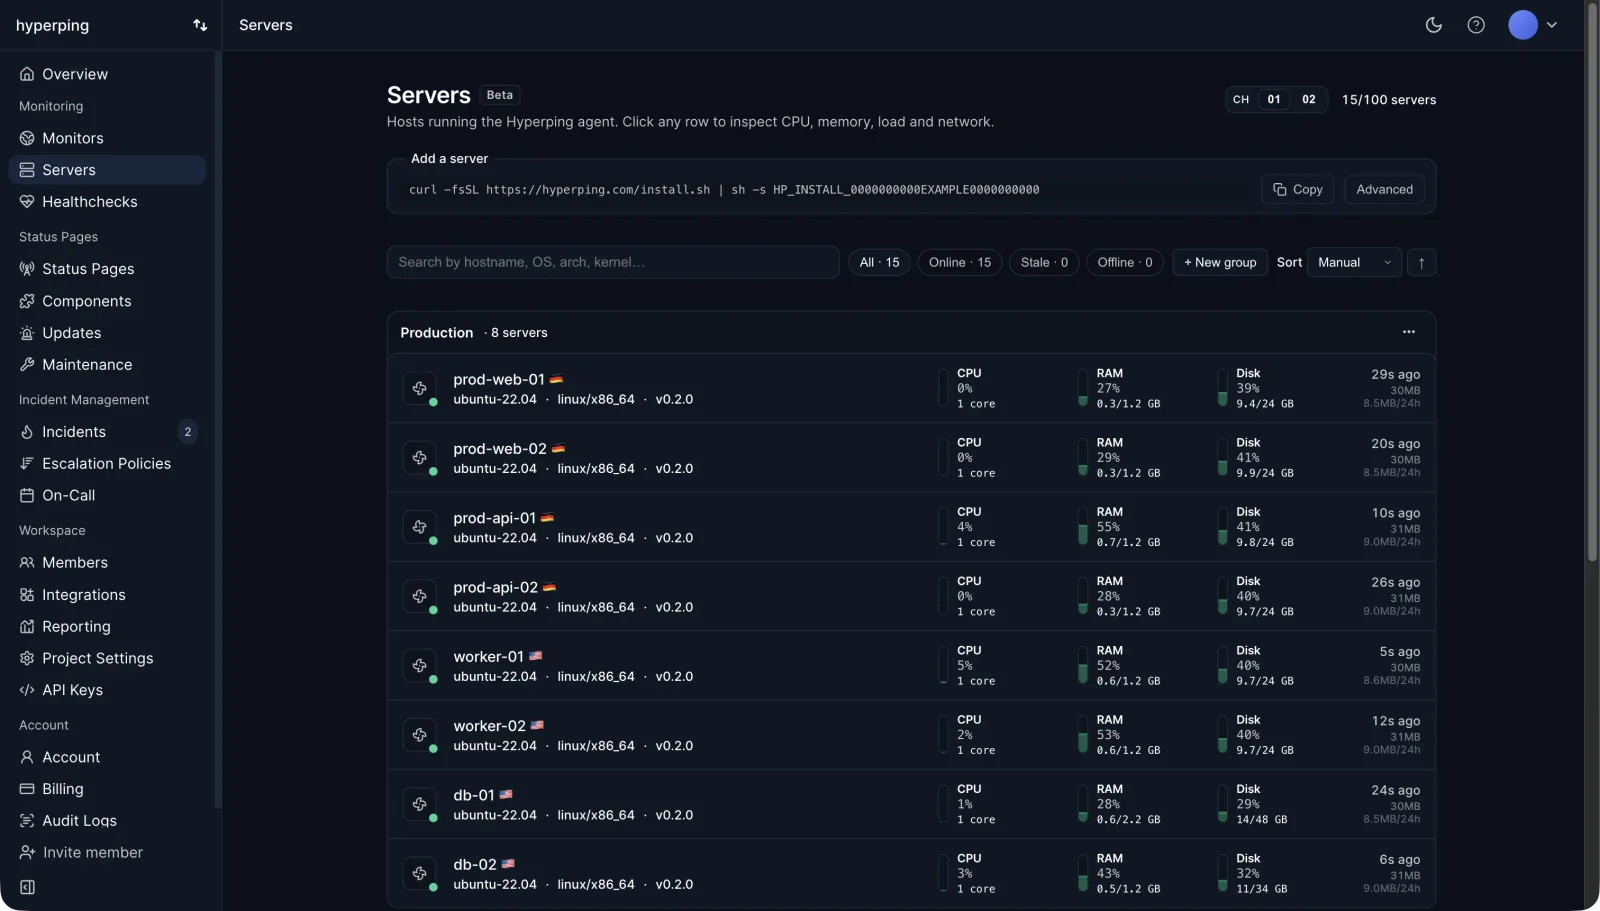
Run that line on a few more hosts and the Servers list gives you the whole fleet on one screen, with each machine's disk usage on its own row.
2. Watch every mount point separately
Filesystem usage is reported per real mount point with device, mountpoint and filesystem type, and pseudo-filesystems are filtered out so tmpfs noise never reaches the dashboard. That means / at 90% and /var/lib/postgresql at 25% show up as two separate series rather than one host average of 32%.
Disk I/O arrives with it as read and write bytes per block device, along with CPU time per state, memory used and available, network bytes per interface, and host metadata such as kernel, architecture and boot time. The full list is in metrics collected. Worth stating plainly: the agent does not ingest per-process or per-container metrics, swap, or inode counts, and it does not do logs, traces or APM. Keep a local df -i check for the inode case.
3. Use the stored history to pick a percentage and a floor
Apply the two-rule pattern from earlier: warn at 75% used so small volumes get caught early, and page only when used is above 85% and free bytes are below a fixed floor, so the 4 TB volume does not shout at you 100 days ahead of time. Both rules live in whatever alerting layer you already run, since Hyperping's server alerting fires on agent liveness rather than on resource thresholds. What the agent gives you is the input for both numbers, because history is stored per mount and you can look at the last two weeks before choosing a floor rather than guessing at one.
Metric history is 7 days on Essentials, 14 on Pro and 30 on Business, which is what makes a trailing 7 day slope possible on the paid plans.
4. Route agent outages to an escalation policy
Attach the server to an escalation policy and an on-call schedule so a server outage reaches whoever is on duty through email, SMS, phone, Slack, Teams, PagerDuty, OpsGenie or a webhook.
Server alerting is liveness based. When metrics stop arriving the server goes Stale after 30 seconds, then Offline past the server's threshold (90 seconds by default), which opens an outage and runs that policy. That covers the case a percentage threshold on the host itself can never report: the volume filled so completely that the machine stopped functioning.
5. Pair filesystem metrics with uptime checks and a status page
Host metrics tell you the machine is unhealthy. Uptime monitoring tells you customers cannot reach it, which is the part they notice. Run HTTP checks against the services on the box from multiple regions, and when both signals fire together you know it is the host rather than the network path.
Publish a status page on top so the incident that pages your on-call also tells customers what is happening.
Server alerting is on paid plans: $24 a month billed yearly on Essentials with 5 agents included, $74 on Pro with 20, $249 on Business with 100. Extra agents are $2 a month on Essentials and Pro, $1.50 on Business. The free plan includes 1 agent with 2 days of history and no server alerting, which is enough to see whether the data is worth paying for. Details are on the pricing page and the server monitoring product page.
Where to start
If you only do one thing today, run df -i on every production host. Inode exhaustion is the failure that skips every dashboard, and I have watched teams spend an hour on a "disk full" incident with 8 GB free on the screen the whole time.
After that, move filesystem usage into whatever already collects host metrics for you, per mount, and replace the single 90% rule with a percentage warning, an absolute floor, and a projected time to full. The Linux server monitoring guide covers the other five metric families the same agent collects, and reducing false positive alerts covers what to do when the thresholds you picked turn out to be noisier than you expected.
FAQ
How do I check disk space on Linux? ▼
Run df -hT -x tmpfs -x devtmpfs to see used and free space per mount point with the filesystem type, and skip the pseudo-filesystems that add noise. Then run df -i for inode usage, which is a separate limit that fails writes with the same error message. Use du -xh --max-depth=1 /var | sort -h to find which directory grew.
Why does df show free space but I still get 'No space left on device'? ▼
Two causes account for almost all of these. Either the filesystem ran out of inodes, which df -i shows as 100% IUse% while df -h still reports free gigabytes, or a process is holding a deleted file open, so the space is unreclaimed until the process closes the descriptor. lsof +L1 lists the second case.
What percentage of disk usage should trigger an alert? ▼
A percentage on its own is the wrong rule, because 5% free is 200 GB on a 4 TB volume and 1 GB on a 20 GB volume. Warn at 75% used, and page only when used is above 85% and free space is also below an absolute floor sized to your growth rate, such as 5 GB on small volumes and 50 GB on large ones. Best of all, alert on projected time to full.
How do I find what is using disk space on Linux? ▼
Start at the mount point and walk down with sudo du -xh --max-depth=1 / | sort -h, then repeat inside the largest directory. The -x flag keeps du on a single filesystem so it does not wander into other mounts. On most servers the answer is /var/log, the systemd journal, or Docker images under /var/lib/docker.
Why does du report less space used than df? ▼
du walks directory entries, so it cannot see files that have been unlinked but are still held open by a running process. df reads the filesystem's own accounting, which still counts those blocks. A gap of several gigabytes between the two usually means a log file was deleted without restarting or signalling the process writing to it.
How do I get alerted before a disk fills up? ▼
You need history, not a snapshot. Record free bytes per mount every 30 seconds, compute the trailing 7 day slope, and alert when the projection crosses zero inside your response window, usually 72 hours. An agent that stores per-mount filesystem metrics gives your alerting layer that history without any cron scripts to maintain.