On Linux, the number that tells you whether a server has memory left is available, not free. The free column counts only pages the kernel is currently holding for nobody. A healthy Ubuntu or RHEL box that has been up for a week shows a few hundred megabytes free out of 16 GB, because the kernel spent the rest on page cache it can give back the instant an application asks. Alert on the free column and you will page your on-call at 3am for a server that is working perfectly.
Key takeaways
- The
freecolumn excludes page cache and buffers. On a 16 GB server holding 12 GB of cache, 238 MB free is normal andavailablestill reads about 12 GB. MemAvailablein/proc/meminfois the kernel's own estimate of what a new workload can allocate without swapping. It landed in Linux 3.14 and every current distro kernel exposes it.- Alert when available memory stays under 10% of total for 10 minutes. A single 30 second sample below the line is noise.
- Non-zero
siandsocolumns invmstat 5mean the machine is already paging, which is a harder signal than any percentage. - The Hyperping agent scrapes memory used, available and total every 30 seconds and reports utilization as a percentage of installed RAM. Swap and paging are not ingested.
Why free memory on a Linux server is always near zero
Linux treats idle RAM as wasted RAM. Every file read populates the page cache, every write is buffered before it reaches the disk, and directory metadata lands in reclaimable slab. None of that memory is locked. When a process calls malloc() and there are no free pages, the kernel drops clean cache pages and hands the memory over, typically in microseconds.
That is why free memory drops toward zero on any server that has been doing work, and why it stays there. A database host that has read 12 GB of table files will keep those pages cached until something needs the space.
The practical consequence is that free memory has almost no diagnostic value. It tells you how much of the machine has never been touched since boot, which on a busy server is a number that trends to zero and then stays flat regardless of health. This is one of the most common sources of false positive monitoring alerts on Linux fleets.
Read free -h correctly
free is the fastest way to see the whole picture. Use -h for human units, or -m if you are piping into something.
$ free -h
               total        used        free      shared  buff/cache   available
Mem:            15Gi       2.7Gi       238Mi       412Mi        12Gi        12Gi
Swap:          2.0Gi       131Mi       1.9Gi
Here is what each column actually counts on procps-ng 3.3.10 and later, which is what ships on Debian, Ubuntu, RHEL 8 and RHEL 9.
| Column | What it counts | What it is good for |
|---|---|---|
total |
Installed RAM the kernel can address | Capacity planning |
used |
total minus free minus buff/cache |
Rough application footprint |
free |
Pages held for nobody | Almost nothing |
shared |
tmpfs and shared memory segments | Catching a runaway /dev/shm or /run |
buff/cache |
Page cache, buffers and reclaimable slab | Confirming the kernel is caching rather than leaking |
available |
Kernel estimate of what a new process can get without swapping | Dashboards and alerts |
Two flags worth knowing. free -w splits buff/cache into separate buffers and cache columns, which helps when you suspect a specific I/O pattern. free -h -s 5 reprints every 5 seconds, which is a poor man's trend view while you reproduce a problem.
What MemAvailable actually estimates
free reads /proc/meminfo, so you can go straight to the source.
$ grep -E '^(MemTotal|MemFree|MemAvailable|Buffers|Cached|SReclaimable|SwapTotal|SwapFree):' /proc/meminfo
MemTotal:       16092136 kB
MemFree:          243912 kB
MemAvailable:   12704128 kB
Buffers:          412356 kB
Cached:         12180440 kB
SReclaimable:     441220 kB
SwapTotal:       2097148 kB
SwapFree:        1963132 kB
MemAvailable is not a simple sum. The kernel starts from free pages, subtracts the low watermark it refuses to dip below, then adds back the portion of page cache and reclaimable slab it believes it can actually free. It deliberately assumes it cannot reclaim all of the cache, because some of it is in active use.
That makes it an estimate rather than a guarantee, and it is still by far the best single number available. Compute your alert as MemAvailable / MemTotal, which in the output above is 79%.
One caveat that catches people out. Inside a container, free and /proc/meminfo report the host's memory, not the cgroup limit. For a container you want /sys/fs/cgroup/memory.current and /sys/fs/cgroup/memory.max on cgroup v2. Host agents, including Hyperping's, report host-level memory utilization and do not ingest per-container metrics, so container limits need a Kubernetes-aware setup like the one in our Kubernetes monitoring guide.
Watch the trend with vmstat, PSI and sar
A snapshot tells you where you are. A trend tells you where you are going.
$ vmstat 5
procs -----------memory---------- ---swap-- -----io---- -system-- ------cpu-----
 r  b   swpd   free   buff  cache   si   so    bi    bo   in   cs us sy id wa st
 2  0 134016 236792 412356 12180440   0    0    12    45  892 1543  6  2 91  1  0
 1  0 134016 235112 412356 12181204   0    0     0    38  871 1502  5  2 92  1  0
Ignore the first line, which averages everything since boot. The columns that matter are si and so, pages swapped in and out per second. On a healthy server both sit at 0. Anything sustained above zero means the kernel is evicting anonymous memory to disk, and latency across the whole box is about to suffer.
Kernels 4.20 and later expose pressure stall information, which is the most direct measurement of memory starvation Linux offers.
$ cat /proc/pressure/memory
some avg10=0.00 avg60=0.00 avg300=0.00 total=0
full avg10=0.00 avg60=0.00 avg300=0.00 total=0
some is the percentage of time at least one task was stalled waiting on memory. full is the percentage of time every task was stalled. A some avg60 climbing past 10 means real work is being delayed. On a few older kernels PSI is compiled in but disabled, and needs psi=1 on the kernel command line.
For historical data without an agent, sar from the sysstat package keeps rolling stats on disk. It needs installing: sudo apt install sysstat on Debian and Ubuntu, sudo dnf install sysstat on RHEL and Fedora. On Debian and Ubuntu you also need to set ENABLED="true" in /etc/default/sysstat, then run sudo systemctl enable --now sysstat.
$ sar -r 5 3
Linux 6.8.0-45-generic (web-01)   07/25/2026   _x86_64_   (4 CPU)

10:14:26    kbmemfree   kbavail kbmemused  %memused kbbuffers  kbcached
10:14:31       243912  12704128   2814208     17.49    412356  12180440
Read kbavail, which matches MemAvailable. %memused is safe to read on any current sysstat: since 11.7.4 it excludes buffers, page cache and reclaimable slab, which is why 17.49% here lines up with what the machine is really using. On sysstat 10.x, the RHEL 7 era, the same column was total minus free and sat near 100% on a healthy box, so the number is not comparable across versions.
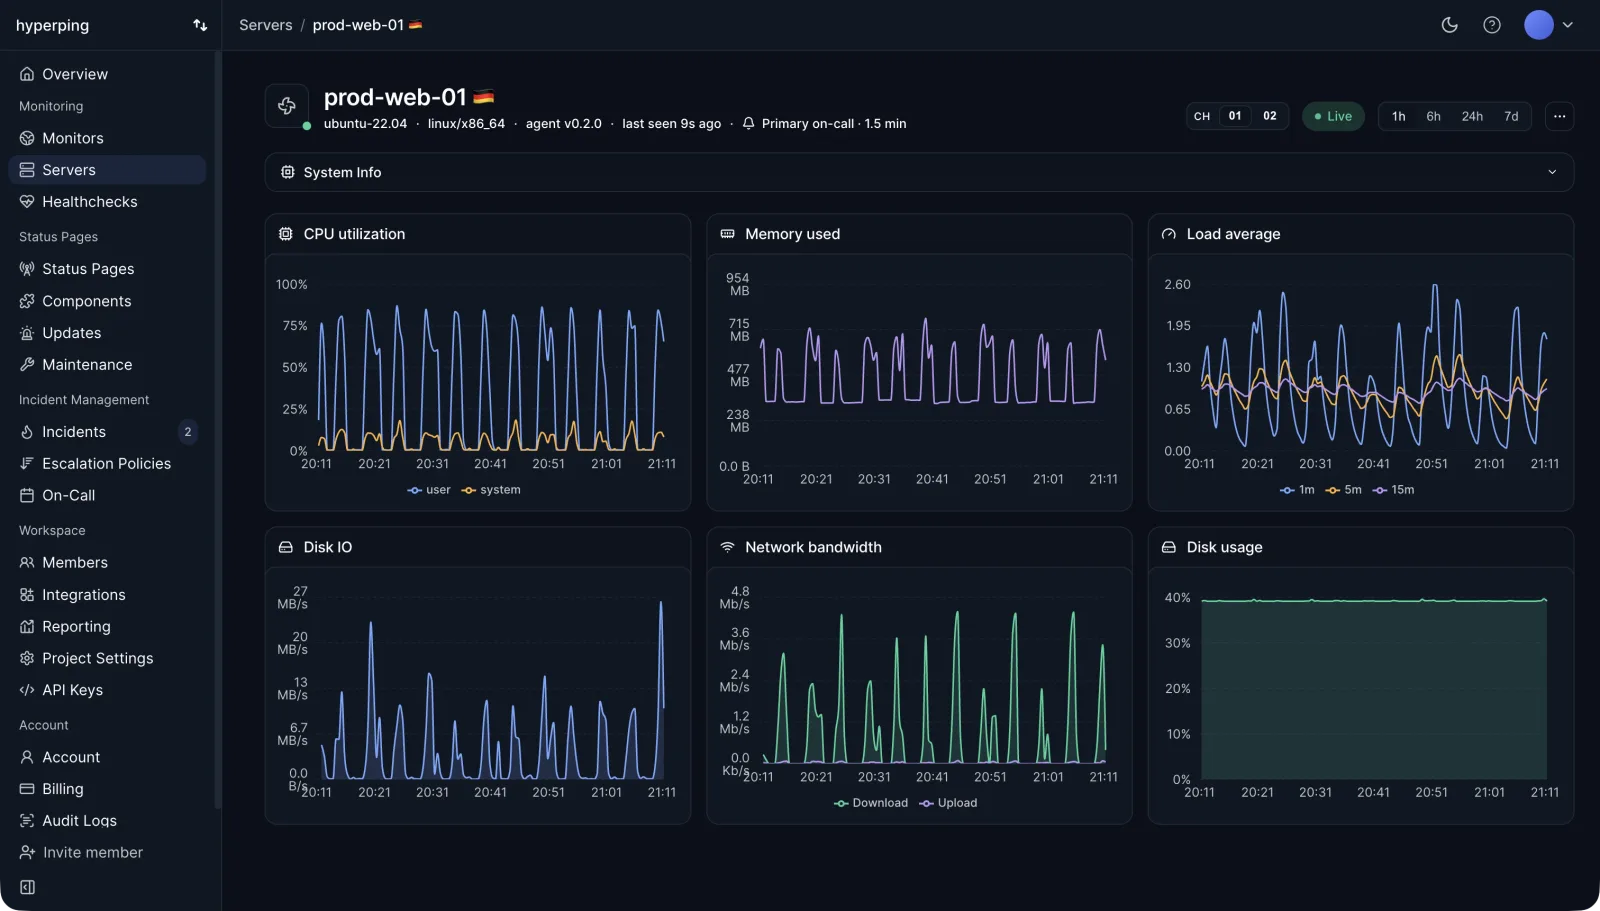
An agent records the same numbers continuously, so the trend is already on screen when you go looking for it instead of starting a vmstat loop after the fact.
Find the processes actually holding memory
Once available memory really is falling, you need the culprit. Sort by RSS, which is resident set size in kilobytes.
$ ps -eo pid,ppid,comm,rss,%mem --sort=-rss | head -n 6
    PID    PPID COMMAND              RSS %MEM
   1423       1 postgres         1842332 11.4
   2871       1 java              986104  6.1
   3012    2871 node               412884  2.5
    904       1 redis-server       238120  1.4
    612       1 systemd-journal     41208  0.2
RSS counts every shared page in full against every process that maps it, so summing the column overcounts badly. For a fair per-process number use PSS, which divides shared pages between the processes sharing them.
$ sudo grep -E '^(Rss|Pss):' /proc/1423/smaps_rollup
Rss:             1842332 kB
Pss:             1203344 kB
smaps_rollup needs kernel 4.14 or later. For a fleet-wide view, smem -rs pss gives the same accounting across all processes, and systemd-cgtop -m sorts systemd units by memory so you can attribute usage to a service rather than a PID.
When the OOM killer steps in
If available memory hits zero and there is nothing left to reclaim, the kernel picks a victim and kills it. The evidence lands in the kernel ring buffer.
$ sudo dmesg -T | grep -iE "out of memory|killed process"
[Sat Jul 25 03:14:22 2026] Out of memory: Killed process 1423 (postgres) total-vm:2841236kB, anon-rss:1842332kB, file-rss:0kB, shmem-rss:8192kB, UID:26 pgtables:4096kB oom_score_adj:0
On any systemd distro, journalctl keeps the same records across reboots, which matters because dmesg does not survive one.
$ journalctl -k --since "24 hours ago" | grep -iE "out of memory|oom-kill"A line reading Memory cgroup out of memory means a cgroup limit was hit rather than the whole machine, which is what you see when a systemd unit has MemoryMax= set or a container hit its limit. You can bias the kernel's choice of victim with oom_score_adj in /proc/<pid>/oom_score_adj, from -1000 (never kill) to 1000 (kill first), or OOMScoreAdjust= in a unit file. Reading the full kill report, from the Tasks state table to cgroup and Kubernetes OOMKilled events, is covered in how to find what the OOM killer killed.
An OOM kill means the box already lost. The point of alerting on available memory is to reach the on-call engineer before this line is written.
What to alert on, and what to ignore
| Signal | Where to read it | Page the on-call when |
|---|---|---|
| Available memory as a share of total | available in free -h, MemAvailable in /proc/meminfo |
Below 10% of total for 10 minutes |
| Swap in and out | si and so in vmstat 5 |
Non-zero across 5 consecutive samples |
| Memory pressure stall | some avg60 in /proc/pressure/memory |
Above 10 for 5 minutes |
| OOM kills | dmesg -T, journalctl -k |
Any occurrence, immediately |
| Free memory | free column |
Never on its own |
The 10 minute qualifier matters more than the threshold. Memory on a busy server is spiky, and a rule that fires on one sample will train your team to ignore it. The reasoning behind that window, and the equivalent numbers for CPU, filesystem and load average, is in server monitoring alert thresholds. If you are choosing between tools for this, our roundup of server performance monitoring tools covers the tradeoffs.
How to use Hyperping for Linux memory monitoring
Running these commands by hand works when you already suspect a problem. To catch memory trends across a fleet, you need an agent recording host metrics continuously.
1. Install the agent on the host
Create a server in Hyperping, copy the install token, and run one command on the box.
curl -fsSL https://hyperping.com/install.sh | sh -s HP_INSTALL_xxxxxThe installer detects the OS and init system, then registers a service under systemd on Linux or launchd on macOS. It runs on amd64 and arm64, sits at roughly 50 MB RSS, and carries an embedded OpenTelemetry collector rather than a JVM. Windows is not supported yet. Full options are in the agent install docs.
2. Read memory as used, available and total
The agent scrapes every 30 seconds and ships gzipped OTLP over HTTP, using metric names that follow the OpenTelemetry hostmetrics conventions. Memory arrives as used, available and total in bytes plus a utilization percentage against installed RAM, which is exactly the ratio described earlier in this post. If ingest is unreachable, the agent buffers to an on-disk queue at /var/lib/hyperping/queue that survives reboots, so a network blip does not leave a hole in the graph. The full list is in metrics collected.
Two gaps to plan around: swap and paging are not ingested, and per-process memory is not either. Keep vmstat and ps for the drill-down.
3. Correlate memory with CPU, disk I/O and network
Memory rarely fails alone. When the page cache gets squeezed, read disk I/O climbs because files that used to be served from RAM now come off the device, and iowait rises with it. The agent collects CPU time per state, 1, 5 and 15 minute load averages, filesystem usage per real mount point, read and write bytes per block device, and bytes in and out per interface, all on the same timeline. Reading the memory chart next to disk I/O is usually what separates a healthy cache from a leak. The server monitoring product page shows the full panel layout, and the Linux server monitoring guide walks through the other five metric families the same agent collects.
4. Page the on-call when a server goes offline
Server alerting in Hyperping is based on agent liveness. Metrics go stale after 30 seconds of silence, and the server flips to offline after a tunable threshold that defaults to 90 seconds. That opens an outage and runs the escalation policy bound to the server, through email, SMS, phone, Slack, Teams, PagerDuty, OpsGenie or webhooks, respecting the on-call schedule. When memory exhaustion takes a host down hard enough to stop the agent, this is the alert that fires.
5. Pair host metrics with uptime checks and a status page
Host metrics tell you the machine is sick. An external uptime check from 18 regions tells you customers can no longer reach the service, which is the fact that decides severity. Point a check at the health endpoint of the app running on that server, then publish a status page so customers see the incident without opening a ticket. Server alerting is included from the Essentials plan at $24 per month billed yearly, with 5 agents and 7 days of metric history, up to 100 agents and 30 days on Business.
Start with available, then watch the trend
If you change one thing after reading this, change the metric behind your memory alert from free to available, and require it to stay low for 10 minutes before it pages anyone. Add vmstat swap activity and OOM kills as secondary signals, keep ps and smaps_rollup for the investigation, and let an agent hold the history so you can see whether today's number is unusual.
For more background on the terms above, see the glossary entries for server monitoring and agent-based monitoring.
FAQ
Why does my Linux server show almost no free memory? ▼
Because the kernel spends idle RAM on page cache and buffers instead of leaving it empty. Cached pages are reclaimable, so the kernel hands them back the moment a process asks for memory. A server with 238 MB free and 12 GB in cache is healthy, not out of memory.
What is the difference between free and available memory on Linux? ▼
Free memory counts only pages the kernel is holding for nobody. Available memory is the kernel's estimate of how much a new process could allocate without pushing the system into swap, which includes reclaimable page cache and slab. Available is the number you graph and alert on.
How do I check memory usage on Linux from the command line? ▼
Run free -h for a snapshot, grep MemAvailable /proc/meminfo for the raw kernel value, and vmstat 5 to watch the trend and the swap in and out columns. To find the heaviest processes, use ps -eo pid,comm,rss,%mem --sort=-rss | head.
What memory threshold should trigger an alert on Linux? ▼
Alert when available memory stays below 10 percent of total for 10 minutes or more, rather than on a single sample. Add a second alert on sustained swap in and out activity in vmstat, and treat any OOM kill in the kernel log as an immediate page.
How do I tell if the OOM killer killed my process? ▼
Check the kernel ring buffer with sudo dmesg -T | grep -i 'killed process' or read the kernel journal with journalctl -k --since '24 hours ago' | grep -i oom. The log line names the PID, the command, and the anon-rss it held when it was killed.
Does Hyperping monitor swap usage on Linux servers? ▼
No. The Hyperping agent reports memory used, available and total in bytes plus a utilization percentage, but swap and paging are not ingested today. Alert on available memory instead, and read swap activity locally with vmstat.