To see CPU usage on Linux right now, run top, or htop if you have it installed. For a per-core breakdown, run mpstat -P ALL 2 3. For a short time series that also shows the run queue and disk activity, run vmstat 1 5. When you are writing a script or an exporter, read /proc/stat directly. And when you need last Tuesday's numbers or a page at 3am, none of those work, because none of them store anything, so you need an agent that ships the metrics off the box. Those five methods cover every CPU question I have had to answer on a Linux server.
Key takeaways
topandhtopanswer "what is happening right now" and keep nothing once you close the terminal.mpstat -P ALL 2 3splits usage per logical core. Its first report covers time since boot, so read the second one onward. Same rule forvmstatandiostat./proc/statcounters are in USER_HZ units, 100 ticks per second on essentially every Linux build. Confirm withgetconf CLK_TCK.- A single "CPU %" is an average across all cores. On a 4 vCPU box, one fully saturated single-threaded process reads as 25% overall while that core is pinned at 100%.
- Sustained
%stabove 5 on a cloud VM means the hypervisor is not giving you the cycles you are paying for. It is invisible in most application dashboards.
The five methods, side by side
| Method | Install needed | Best for | Per-core view | Keeps history |
|---|---|---|---|---|
top |
No, ships with procps | A live snapshot during an incident | Yes, press 1 |
No |
htop |
Usually yes | Reading the same data faster, sorting, killing | Yes, by default | No |
mpstat |
Yes, sysstat |
Per-core split and steal time | Yes | No, use sar |
vmstat |
No, ships with procps | Run queue, context switches and I/O next to CPU | No | No |
/proc/stat |
No, kernel interface | Scripts, exporters, custom alerting | Yes | No |
| Agent | One line | 2 to 30 days of history, alerting, correlation | Yes | Yes |
Method 1: top for what is happening right now
top is on every Linux install. Run it with no arguments.
$ top

top - 14:22:31 up 12 days,  3:41,  2 users,  load average: 3.94, 2.71, 1.88
Tasks: 214 total,   2 running, 212 sleeping,   0 stopped,   0 zombie
%Cpu(s): 24.4 us,  2.9 sy,  0.0 ni, 70.6 id,  1.7 wa,  0.0 hi,  0.4 si,  0.0 st
MiB Mem :  15884.1 total,   1042.3 free,   6721.8 used,   8120.0 buff/cache
MiB Swap:   2048.0 total,   2048.0 free,      0.0 used.   8742.6 avail Mem

    PID USER      PR  NI    VIRT    RES    SHR S  %CPU  %MEM     TIME+ COMMAND
   1842 postgres  20   0 1320368 422500  39120 R  98.7   2.6 418:22.14 postgres
   3310 www-data  20   0  712344 198220  22140 S  12.0   1.2  96:04.55 nginx
   9921 root      20   0   12648   4120   3280 R   1.3   0.0   0:00.21 top
The %Cpu(s) line is the one that matters. It reports how the CPUs spent the last refresh interval, which defaults to 3 seconds. Press 1 to expand it into one line per logical core, which is the single most useful key in the program.
%Cpu0  : 91.5 us,  6.5 sy,  0.0 ni,  0.0 id,  1.0 wa,  0.0 hi,  1.0 si,  0.0 st
%Cpu1  :  2.5 us,  1.5 sy,  0.0 ni, 95.5 id,  0.5 wa,  0.0 hi,  0.0 si,  0.0 st
%Cpu2  :  2.0 us,  2.5 sy,  0.0 ni, 92.6 id,  3.0 wa,  0.0 hi,  0.0 si,  0.0 st
%Cpu3  :  1.5 us,  1.0 sy,  0.0 ni, 94.5 id,  2.5 wa,  0.0 hi,  0.5 si,  0.0 st
The per-process %CPU column is scaled to one core, not to the whole machine. A process at 98.7 is saturating a single core, and a multi-threaded process on that same 4 core box can legitimately show 380.2. If you want the whole-machine scale instead, press I to toggle Irix mode off.
For scripting, use batch mode. The first iteration reports values accumulated since boot, so always take two and keep the second.
top -b -n 2 -d 1 | grep '^%Cpu' | tail -1Method 2: htop when you want to read it faster
htop shows the same kernel counters as top with per-core bars, a tree view and mouse support. It is not installed by default on most server images.
# Debian and Ubuntu
sudo apt update && sudo apt install htop

# RHEL, Rocky, AlmaLinux (htop lives in EPEL)
sudo dnf install epel-release && sudo dnf install htop

# Fedora
sudo dnf install htop
Two things it does better than top: the colored core bars separate user time (green) from system time (red) at a glance, and F6 sorts by any column without remembering a keystroke. On a box with 64 cores, press Shift+H to hide user threads first, otherwise the process list is unreadable. Like top, it stores nothing once you close the session.
Method 3: mpstat for a per-core breakdown
mpstat comes from the sysstat package, which also gives you iostat, pidstat and sar.
# Debian and Ubuntu
sudo apt install sysstat

# RHEL, Rocky, AlmaLinux, Fedora
sudo dnf install sysstat
Then sample every 2 seconds, 3 times, with one row per logical CPU.
$ mpstat -P ALL 2 3
Linux 6.8.0-45-generic (web-01)   07/25/2026   _x86_64_   (4 CPU)

02:14:31 PM  CPU    %usr   %nice    %sys %iowait    %irq   %soft  %steal  %guest  %gnice   %idle
02:14:33 PM  all   24.37    0.00    2.88    1.75    0.00    0.38    0.00    0.00    0.00   70.62
02:14:33 PM    0   91.46    0.00    6.53    1.01    0.00    1.00    0.00    0.00    0.00    0.00
02:14:33 PM    1    2.51    0.00    1.51    0.50    0.00    0.00    0.00    0.00    0.00   95.48
02:14:33 PM    2    1.98    0.00    2.48    2.97    0.00    0.00    0.00    0.00    0.00   92.57
02:14:33 PM    3    1.51    0.00    1.01    2.51    0.00    0.50    0.00    0.00    0.00   94.47
I trimmed the remaining two reports and the closing Average block. Note the trap: when you pass an interval, the first report covers the time since system startup, so on a host that has been up for 12 days that row is a 12 day average and tells you nothing about now. Read from the second report.
This output is the clearest illustration of why the all row is dangerous. Overall usage looks like a comfortable 24%, while CPU0 is at 0.00% idle. That is a single-threaded workload pinned to one core, and the machine-level average hides it completely. Use mpstat -P ALL whenever an application feels slow but the dashboard says the server is fine.
Method 4: vmstat for a short time series
vmstat ships with procps, so it is already on the box. It prints CPU next to the run queue, memory, swap and block I/O, which makes it good for deciding what kind of problem you have.
$ vmstat 1 5
procs -----------memory---------- ---swap-- -----io---- -system-- ------cpu-----
 r  b   swpd   free   buff  cache   si   so    bi    bo   in   cs us sy id wa st
 1  0      0 1067520 184320 8314880   0    0    12    48  842 1620 19  4 75  2  0
 4  0      0 1061248 184320 8316928   0    0     0    92 1204 2411 62  6 31  1  0
 5  1      0 1058176 184320 8318976   0    0     8   140 1388 2790 71  7 20  2  0
 4  0      0 1055104 184324 8321024   0    0     0    76 1301 2644 68  6 25  1  0
 3  0      0 1052032 184324 8323072   0    0     4   108 1256 2502 65  5 29  1  0
The first line is an average since boot, same rule as mpstat, so ignore it. After that, r is the number of tasks waiting for CPU time and b is the number blocked on I/O. On this 4 core host, an r of 4 or 5 means the run queue is at or above core count and work is queuing.
cs (context switches per second) climbing while us stays flat usually points at lock contention or too many threads rather than genuine CPU demand.
Method 5: /proc/stat when you are writing a script
Every tool above reads the same file. /proc/stat exposes cumulative counters since boot, in USER_HZ units.
$ head -3 /proc/stat
cpu  11975110 8444 2807825 404970432 189007 0 58879 14303 0 0
cpu0 3163749 2200 712068 101054618 50344 0 19299 3722 0 0
cpu1 2985323 2086 696881 101259264 45264 0 13698 3484 0 0

$ getconf CLK_TCK
100
The fields, in order, are user, nice, system, idle, iowait, irq, softirq, steal, guest and guest_nice. Because they are counters, a single read tells you nothing useful. You need two samples and a delta.
#!/bin/bash
# CPU utilization over a 1 second window, straight from /proc/stat

sample() {
  awk '/^cpu / { idle  = $5 + $6
                 total = $2 + $3 + $4 + $5 + $6 + $7 + $8 + $9
                 print idle, total }' /proc/stat
}

read idle1 total1 < <(sample)
sleep 1
read idle2 total2 < <(sample)

awk -v i1="$idle1" -v t1="$total1" -v i2="$idle2" -v t2="$total2" \
    'BEGIN { printf "%.1f\n", 100 * (1 - (i2 - i1) / (t2 - t1)) }'
$ ./cpu.sh
81.4Two details worth keeping. Idle here is idle + iowait, because iowait is idle time. And the total deliberately stops at field 9, since guest time is already counted inside user and nice, so summing every field double counts it on virtualized hosts.
What user, system, iowait and steal actually mean
The percentages only help once you know which bucket is which, and that is where the diagnosis lives.
| top column | /proc/stat field | What it counts | What a high value usually means |
|---|---|---|---|
us |
user | Application code in user space | Your code, a runtime, or a regex doing real work |
ni |
nice | User time for processes with a positive nice value | Batch jobs and backups that were deprioritized |
sy |
system | Kernel code: syscalls, drivers, memory management | Syscall-heavy I/O, too many small writes, container churn |
wa |
iowait | Idle time with a task blocked on disk I/O | Storage is slow, not the CPU |
hi / si |
irq / softirq | Hardware and software interrupt servicing | High si is usually network packet processing at high pps |
st |
steal | Time the hypervisor gave to another guest | Noisy neighbour, or exhausted CPU credits |
id |
idle | Nothing runnable | Headroom |
Two of these get misread constantly.
iowait is not CPU work. It is a flavor of idle. When wa is 30%, the CPU is sitting on its hands 30% of the time because something is blocked on a disk. Adding cores does not help. Look at disk I/O latency and queue depth instead, which is the walkthrough in high iowait on Linux.
steal only exists on VMs. Your kernel wanted to run, the hypervisor scheduled another tenant, and those cycles are gone. On AWS T-series instances, %st climbing is often burst credits running out rather than a bad neighbour. I treat sustained %st above 5 as a reason to check the credit balance or move to a dedicated instance type, because no amount of application tuning recovers cycles you never received.
Why a single CPU percentage is misleading
The number in your dashboard is an average across every logical core over some window. Both of those hide real problems.
Averaging across cores is the mpstat example above: 24% overall, one core pinned. Any single-threaded hot path (a Node.js event loop, a Ruby process, a Python GIL-bound worker) hits its ceiling long before the machine average looks concerning. This is exactly the failure mode I see teams miss in Kubernetes monitoring setups too, where node-level averages smooth over one saturated container.
Averaging over time is the second problem. A 60 second average of 40% can be steady work or 20 seconds pinned at 100% followed by 40 seconds idle. Users feel the second one, which is why CPU utilization should always be read next to latency.
Averaging across hosts is the third. Six web servers at 30% with one at 95% is not a fleet at 30%.
Load average is not CPU usage
uptime gives you the 1, 5 and 15 minute load average.
$ uptime
 14:22:31 up 12 days,  3:41,  2 users,  load average: 3.94, 2.71, 1.88

$ nproc
4
Compare that against nproc, never against 100. A load average of 3.94 on a 4 core box means the run queue is roughly at capacity. The same 3.94 on a 32 core box is idle.
Linux load average is also unusual: it counts runnable tasks plus tasks in uninterruptible sleep (state D), which is mostly disk and NFS wait. That is why a server can show a load average of 12 with 85% idle CPU. The rising trend across 1, 5 and 15 minute values tells you whether you are heading into trouble or recovering from it. Linux load average explained covers the per-core division and the D state case in full.
What if you need yesterday's numbers?
Every method so far is live only. sar, from the same sysstat package, is the standard answer for local history. Enable the collector first, since Debian and Ubuntu ship it disabled.
# Debian and Ubuntu: set ENABLED="true" in /etc/default/sysstat
sudo systemctl enable --now sysstat

# Live: 3 samples, 1 second apart
sar -u 1 3

# Yesterday, from the daily binary file (day 24 of this month)
sar -u -f /var/log/sysstat/sa24    # Debian and Ubuntu
sar -u -f /var/log/sa/sa24         # RHEL and derivatives
Default retention is 7 days on Debian and Ubuntu, 28 on RHEL, controlled by HISTORY in the sysstat config.
sar has three limits that matter. The history lives on the host, so it dies with the host. There is no alerting, so nobody learns about a CPU problem unless they SSH in and look. And correlating twelve servers means twelve SSH sessions. That is the gap agent-based monitoring fills, and it is why most teams eventually add one of the server performance monitoring tools on top of the built-in commands.
How to use Hyperping for continuous CPU monitoring
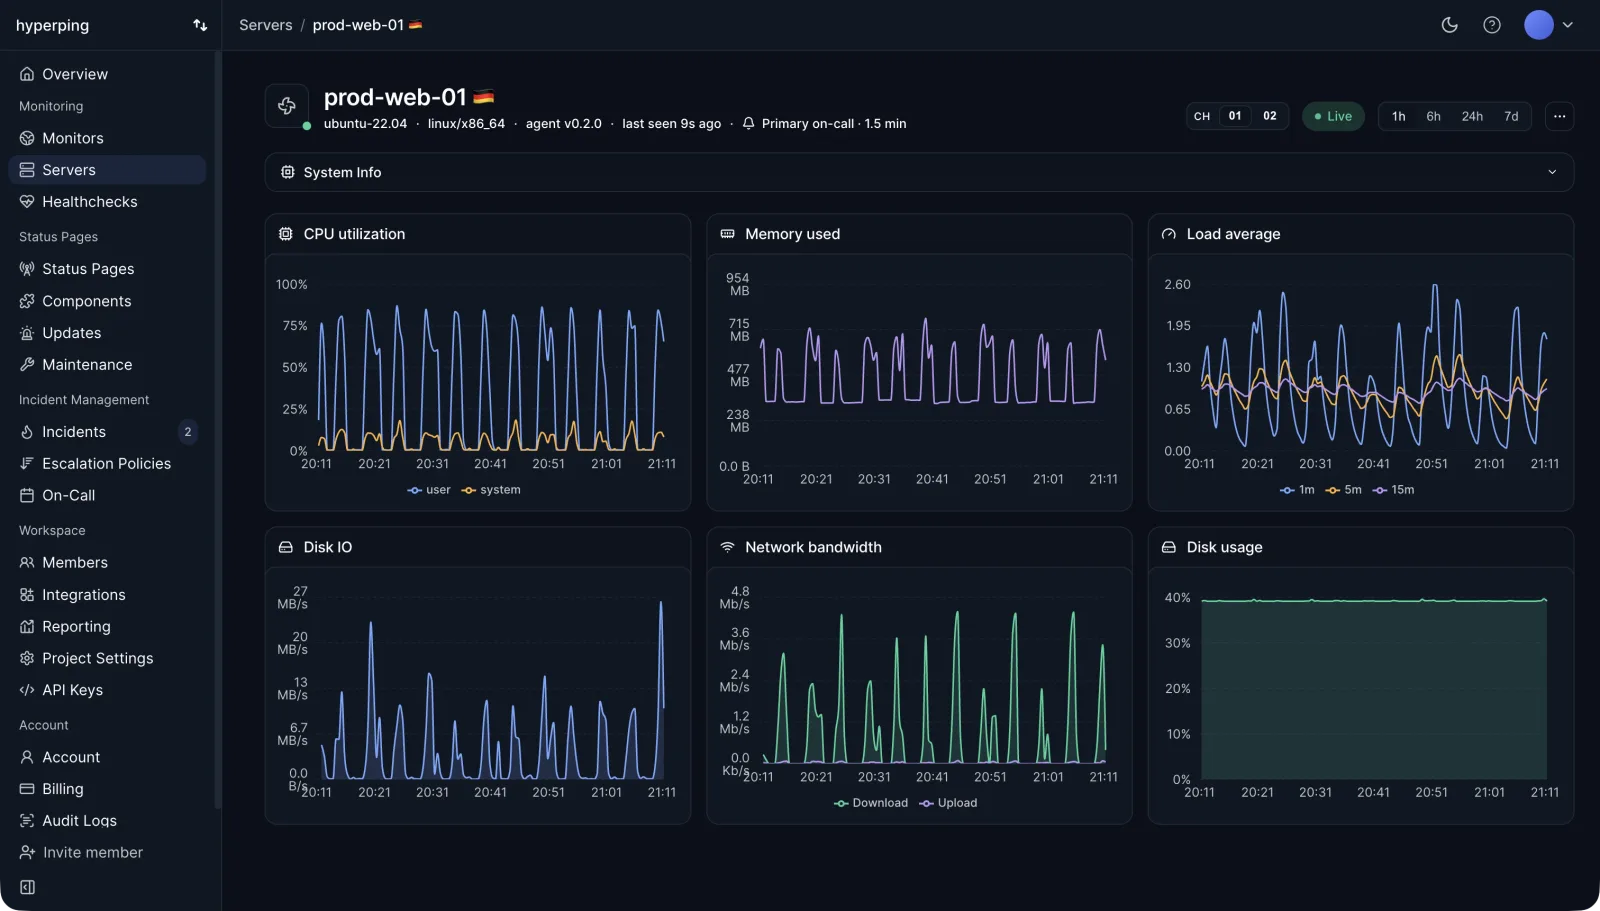
The commands above tell you what a server is doing this second. An agent turns that into a timeline you can query after the fact and alert on before customers notice. Here is the setup I would run on a Linux fleet.
1. Install the agent on the server
Create a server in Hyperping, copy the install command, and run it on the host.
curl -fsSL https://hyperping.com/install.sh | sh -s HP_INSTALL_xxxxxThe agent embeds an OpenTelemetry collector, registers itself with systemd on Linux and launchd on macOS, and runs on amd64 and arm64. It sits around 50 MB RSS with no JVM, scrapes every 30 seconds, and ships gzipped OTLP/HTTP payloads that arrive within a couple of seconds. If ingest is unreachable, samples buffer in an on-disk queue at /var/lib/hyperping/queue that survives reboots. Re-running the installer rotates credentials while keeping the same server UUID and history. Full steps are in the install the agent docs. Windows is not supported yet.
2. Read CPU alongside memory, filesystem, disk I/O and network
The agent collects CPU time per state (user, system, iowait) as a percentage of wall clock, the 1, 5 and 15 minute load averages, the logical core count and a per-CPU breakdown, so the "one pinned core" case is visible without an SSH session. On the same timeline you get memory used, available and total, per-mount filesystem usage with device and filesystem type, read and write bytes per block device, and bytes in and out per interface. Metric names follow the OpenTelemetry hostmetrics semantic conventions, which the metrics collected reference lists field by field. Per-process, per-container and swap metrics are not ingested, so keep top and htop for that level of detail.
3. Alert on agent liveness and route it to on-call
Hyperping's server alerting fires on agent liveness, not on resource thresholds. A server stays green while metrics keep arriving, goes Stale in the UI once the scrape gap crosses 30 seconds, and goes Offline when nothing has arrived past the server's offline threshold, 90 seconds by default. Offline opens an outage and pages the channels on the escalation policy bound to that server, following your on-call schedules. That covers the failure a CPU rule cannot catch: a box saturated hard enough that it stops reporting at all. If you also want a numeric rule, sustained high CPU over several consecutive samples rather than a single spike is the shape to aim for, and it belongs in your own alerting layer on top of the history the agent records. Server alerting is on the paid plans: Essentials at $24/mo billed yearly includes 5 agents and 7 days of metric history, Pro at $74/mo includes 20 agents and 14 days, Business at $249/mo includes 100 agents and 30 days. The free plan gives you 1 agent and 2 days of history with no server alerting, which is enough to try it on one box. Details are on the pricing page.
4. Pair host metrics with external uptime checks
Host metrics tell you the machine is struggling. Uptime checks from 18 regions tell you whether users noticed. Point HTTP checks at the endpoints that server hosts, and a CPU spike sitting next to flat response times becomes a capacity ticket instead of a page. The server monitoring page shows both views on one timeline.
5. Publish a status page when the pressure becomes user visible
When CPU saturation does turn into slow responses, connect the affected monitors to a status page so customers see the incident without opening a ticket. Uptime history is published automatically, which saves the manual reporting most teams do by hand.
Where to start
If you are debugging right now, run mpstat -P ALL 2 3 before anything else, because the per-core split answers the question the machine average obscures. Then read wa and st before you conclude the CPU is the bottleneck.
If you are setting up monitoring rather than debugging, sar gets you a week of local history for free, and an agent gets you fleet-wide history, alerting and correlation with what users actually experience. Most teams need both: the commands for the incident, the agent so somebody knows there is one. For the rest of the host picture, memory, filesystem, disk I/O and network on the same timeline, the Linux server monitoring guide covers the full setup.
FAQ
What command shows CPU usage on Linux? ▼
Run top for a live view of overall and per-process CPU usage. Press 1 inside top to split the summary line per core. If you only want a single number for a script, read /proc/stat and compute the delta between two samples.
How do I check CPU usage per core on Linux? ▼
Run mpstat -P ALL 2 3, which prints one row per logical CPU. mpstat comes from the sysstat package, so install it first with apt install sysstat or dnf install sysstat. Inside top, pressing 1 gives you the same per-core split without installing anything.
What does a high wa value in top mean? ▼
iowait is idle time where at least one task on that CPU was blocked waiting on disk I/O. It is not CPU work. A high wa figure means storage is the bottleneck, so look at disk latency and queue depth rather than adding CPU.
What is steal time on a Linux VM? ▼
Steal time (%st) is time your virtual CPU was ready to run but the hypervisor gave the physical core to someone else. It only appears on virtualized hosts. Sustained steal above 5% usually means a noisy neighbour or an exhausted burst credit balance on instances like AWS T-series.
Is load average the same as CPU usage? ▼
No. On Linux, load average counts tasks that are runnable plus tasks in uninterruptible sleep, which is mostly disk and NFS wait. A server can show a load average of 8 with 90% idle CPU if the disks are slow. Compare load average against the output of nproc, not against 100%.
How do I keep a history of CPU usage on Linux? ▼
Enable the sysstat collector and query it with sar, which retains 7 days on Debian and Ubuntu and 28 days on RHEL by default. That history lives on the host itself, so it disappears with the host. An agent that ships metrics off the box gives you history plus alerting.