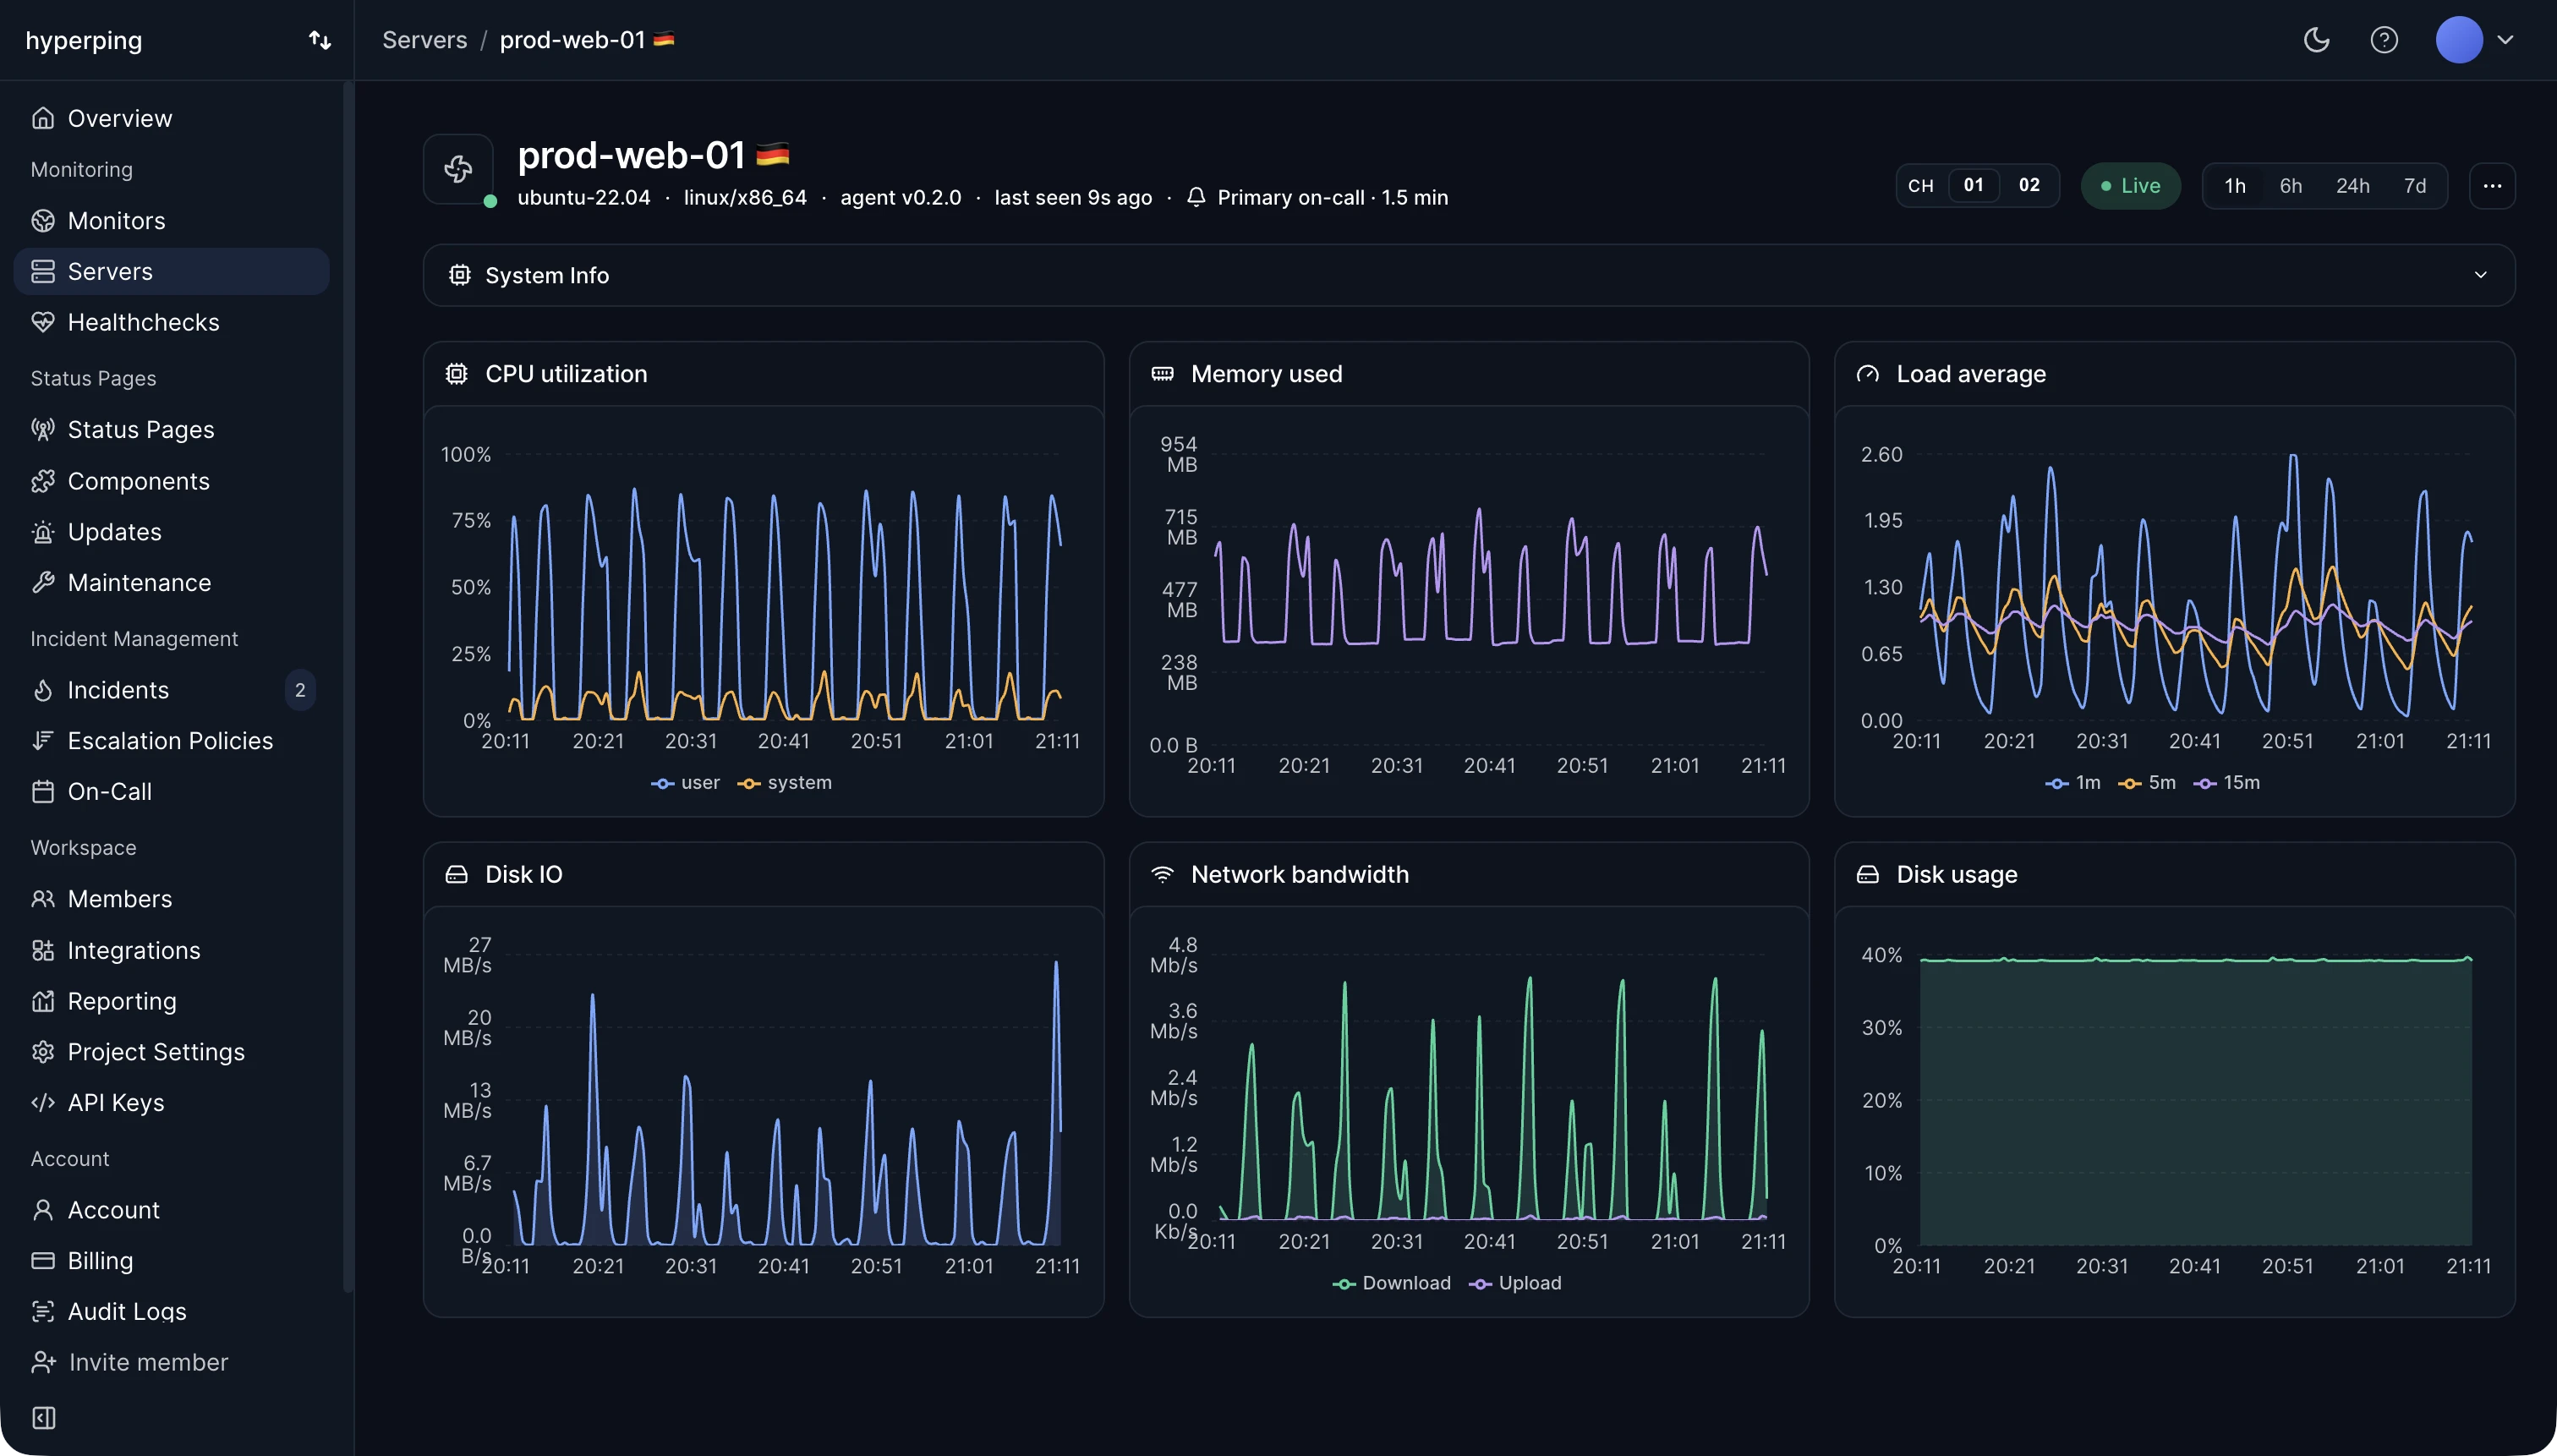
Hyperping's server agent records CPU time per state, including iowait, every 30 seconds next to per-device disk I/O, so both sides of the comparison sit on one timeline. That matters, because iowait alone rarely tells you what's wrong.
iowait as a CPU state
iowait is one of the CPU time states, alongside user, system, and idle. It measures the time a CPU had nothing else to run while an I/O operation it issued was still pending. It's a percentage of CPU time, not a queue depth and not a latency, so it tells you the CPU was idle while storage was busy, never how slow the storage actually is.
Misreading iowait
The number moves with how much other work is running. A host with one blocked process and nothing else to do can show 25% iowait on a 4-core machine and be completely healthy. A busy host with the exact same storage problem shows almost no iowait, because the scheduler always has another thread to run. Treat iowait as a symptom that points at the storage layer, not as a cause you can fix directly.
Diagnosing high iowait
- Rising iowait, a climbing load average, and a jump in read or write bytes on one block device: a local storage bottleneck.
- Rising iowait with flat disk throughput: usually a remote filesystem such as NFS, or a saturated network path.
- High iowait on a cloud volume after hours of normal behavior: often the volume used up its burst credits and fell back to its baseline speed.
The troubleshooting guide walks through the tools (iostat, iotop, pidstat) for each case.
FAQ
What is a normal iowait percentage?
Below 5% on most servers. Sustained values above 10 to 20% on a busy host deserve a look at disk I/O, but always compare with throughput before concluding anything.
Does high iowait mean the disk is slow?
Not by itself. It means CPUs were idle while waiting for I/O. The disk can be fast and simply overloaded, or the wait can be on a network filesystem.
How do I check iowait on Linux?
Run top and read the wa value in the CPU line, or vmstat 1 and the wa column. iostat -x 1 then shows which device is busy.