OpenTelemetry host metrics are the CPU, memory, disk, filesystem, network and load numbers that the OpenTelemetry Collector's hostmetrics receiver reads straight from the kernel, named according to the OpenTelemetry semantic conventions and shipped over OTLP. On Linux the receiver reads the same files you would read by hand, /proc/stat, /proc/meminfo, /proc/diskstats, /proc/net/dev and /proc/loadavg, then emits metrics with fixed names such as system.cpu.time and system.memory.usage. The names are the whole point. They are identical on every host, in every collector build, and at every backend that accepts OTLP.
Key takeaways
- The
hostmetricsreceiver has nine scrapers: cpu, memory, disk, filesystem, network, load, paging, processes and process. None of them run until you name them in config, and the defaultcollection_intervalis 1 minute. - Metric names come from the OpenTelemetry semantic conventions, so
system.cpu.timeis always in seconds andsystem.memory.usageis always in bytes, on any distro and any collector version. host.name,host.idandos.typeare resource attributes added by theresourcedetectionprocessor, not by the receiver. Onlyhost.nameandos.typeare on by default.- Changing backends is an exporter change, not an instrumentation change. Point the same pipeline at Prometheus and
system.cpu.timearrives assystem_cpu_time_seconds_total. - The Hyperping agent embeds a collector running the same receiver at a 30 second cadence over OTLP/HTTP with gzip, and its ingestor accepts a subset: no paging, no per-process, no container metrics.
What the hostmetrics receiver actually scrapes
Each scraper is an independent reader with its own source and its own set of metrics. You enable them individually, which matters because the process scraper alone can multiply your data point count by a hundred on a busy host.
| Scraper | Source on Linux | Headline metrics |
|---|---|---|
| cpu | /proc/stat |
system.cpu.time |
| load | /proc/loadavg |
system.cpu.load_average.1m, .5m, .15m |
| memory | /proc/meminfo |
system.memory.usage |
| filesystem | mount table plus statfs |
system.filesystem.usage, system.filesystem.inodes.usage |
| disk | /proc/diskstats |
system.disk.io, system.disk.operations, system.disk.io_time |
| network | /proc/net/dev plus socket tables |
system.network.io, system.network.packets, system.network.errors, system.network.connections |
| paging | /proc/vmstat and swap state |
system.paging.usage, system.paging.operations, system.paging.faults |
| processes | /proc |
system.processes.count, system.processes.created |
| process | /proc/[pid] |
process.cpu.time, process.memory.usage |
The receiver is part of the collector-contrib distribution, not the core one. If otelcol rejects your config with an unknown receiver error, you are running the core build.
You can see where the cpu scraper gets its numbers in one command:
head -2 /proc/statcpu 4821331 12044 1503992 98421107 331204 0 41822 9911 0 0
cpu0 613002 1477 189214 12301884 42193 0 6702 1244 0 0Those counters are in USER_HZ ticks (getconf CLK_TCK returns 100 on almost every Linux build). The scraper divides by that value and reports seconds, one data point per CPU per state. That is exactly the arithmetic mpstat does for you when you want percentages instead:
sudo apt install sysstat   # Debian, Ubuntu
sudo dnf install sysstat   # RHEL, Rocky, Fedora
mpstat -P ALL 1 1
Linux 6.8.0-45-generic (web-01) 07/25/2026 _x86_64_ (8 CPU)
15:42:13 CPU %usr %nice %sys %iowait %irq %soft %steal %guest %gnice %idle
15:42:14 all 6.41 0.00 2.13 0.75 0.00 0.25 0.00 0.00 0.00 90.46
15:42:14 0 7.14 0.00 2.04 1.02 0.00 0.00 0.00 0.00 0.00 89.80Both read the same kernel counters. The difference is that mpstat prints to your terminal and the receiver ships the raw cumulative seconds to a backend that can do the rate calculation over any window you ask for later. If you want the full command-line version of this, the guide on how to monitor CPU usage on Linux walks through each tool.
The metric names are the standard, not the vendor's
This is the part worth internalizing. A metric name in OpenTelemetry carries a defined type, a defined unit and a defined attribute set. system.cpu.time is a cumulative monotonic sum in seconds, always.
| Metric | Instrument type | Unit | Key attributes |
|---|---|---|---|
system.cpu.time |
monotonic sum | s |
cpu, state (user, system, idle, wait, nice, softirq, interrupt, steal) |
system.cpu.load_average.15m |
gauge | {thread} |
none |
system.memory.usage |
up-down sum | By |
state (used, free, cached, buffered, slab_reclaimable, slab_unreclaimable) |
system.filesystem.usage |
up-down sum | By |
device, mountpoint, type, mode, state (used, free, reserved) |
system.disk.io |
monotonic sum | By |
device, direction (read, write) |
system.network.io |
monotonic sum | By |
device, direction (receive, transmit) |
The state attribute on system.cpu.time is where iowait lives, under the name wait. The state attribute on system.memory.usage is why you can reconstruct the free, cached and buffered split without a second metric.
Some metrics are defined but disabled by default because they are derived rather than read, system.cpu.utilization and system.memory.utilization among them. Enabling one is three lines:
receivers:
  hostmetrics:
    scrapers:
      cpu:
        metrics:
          system.cpu.utilization:
            enabled: true
One honest caveat: the system.* group in the OpenTelemetry semantic conventions is still marked as development, so names can shift between major releases. In practice the six above have been stable for years, and the collector ships translation for the ones that did change.
Resource attributes turn a metric into a host
The receiver emits system.cpu.time with a cpu and a state attribute. It does not tell the backend which machine that was. Identity is a resource-level concern, handled by the resourcedetection processor.
The system detector fills in host.name and os.type by default. host.id, host.arch and os.description exist but are off, which trips people up when hosts get renamed and the backend suddenly shows a new server.
processors:
  resourcedetection:
    detectors: [env, system]
    system:
      resource_attributes:
        host.id:
          enabled: true
        host.arch:
          enabled: true
Put env first and the collector picks up anything you set in OTEL_RESOURCE_ATTRIBUTES, which is the clean way to tag a fleet by role or environment:
OTEL_RESOURCE_ATTRIBUTES="deployment.environment=production,service.namespace=api"host.id is the attribute that survives a rename. On Linux it comes from /etc/machine-id or the DMI product UUID, so a host keeps its identity across a hostname change, a reboot or a collector upgrade.
A minimal collector config that ships host metrics over OTLP
Install the contrib build. Check the releases page for the current version rather than copying a number out of a blog post:
OTELCOL_VERSION=0.109.0
curl -fsSLO "https://github.com/open-telemetry/opentelemetry-collector-releases/releases/download/v${OTELCOL_VERSION}/otelcol-contrib_${OTELCOL_VERSION}_linux_amd64.deb"
sudo dpkg -i "otelcol-contrib_${OTELCOL_VERSION}_linux_amd64.deb"
On RHEL, Rocky and Fedora, take the .rpm from the same release and install it with sudo rpm -ivh. Both packages create a systemd unit named otelcol-contrib and read /etc/otelcol-contrib/config.yaml.
Here is a complete config: six scrapers, host identity, batching, and an OTLP/HTTP exporter with gzip.
receivers:
  hostmetrics:
    collection_interval: 30s
    scrapers:
      cpu:
      load:
      memory:
      disk:
      filesystem:
      network:

processors:
  resourcedetection:
    detectors: [env, system]
    system:
      resource_attributes:
        host.id:
          enabled: true
  batch:
    timeout: 10s
    send_batch_size: 1000

exporters:
  otlphttp:
    endpoint: https://otel.example.com
    compression: gzip
    headers:
      authorization: "Bearer ${env:OTEL_TOKEN}"
    retry_on_failure:
      enabled: true
    sending_queue:
      enabled: true
      storage: file_storage

extensions:
  file_storage:
    directory: /var/lib/otelcol/queue

service:
  extensions: [file_storage]
  pipelines:
    metrics:
      receivers: [hostmetrics]
      processors: [resourcedetection, batch]
      exporters: [otlphttp]
Two details that matter in production. The otlphttp exporter appends /v1/metrics to your endpoint, so set endpoint to the base URL and not to the full path. And sending_queue with file_storage is what keeps a network blip from costing you data, because the queue lands on disk instead of in memory.
Validate before you restart anything:
otelcol-contrib validate --config file:/etc/otelcol-contrib/config.yamlTo see what is actually being produced, add a debug exporter with verbosity: detailed and run the binary in the foreground. The output is verbose but unambiguous:
Resource attributes:
     -> host.name: Str(web-01)
     -> host.id: Str(4f2a9c1e8b7d4a3f9e0c15d6b8a37c42)
     -> os.type: Str(linux)
Metric #0
Descriptor:
     -> Name: system.cpu.time
     -> Unit: s
     -> DataType: Sum
     -> IsMonotonic: true
     -> AggregationTemporality: Cumulative
NumberDataPoints #0
Data point attributes:
     -> cpu: Str(cpu0)
     -> state: Str(user)
Value: 48213.310000
Once it is running under systemd, journalctl is where export failures show up:
sudo systemctl restart otelcol-contrib
journalctl -u otelcol-contrib -n 20 --no-pager
Why OTel-native beats a proprietary agent
The commercial argument is simpler than the technical one. Instrumentation and backend are separate decisions, and OpenTelemetry keeps them separate.
If you install a vendor's own agent, the metric names, the wire format and the dashboards belong to that vendor. Migrating means reinstalling an agent on every host and rewriting every alert rule. If you install a collector, migrating means editing one exporter block.
| Where you want data | Exporter | Name you query |
|---|---|---|
| Any OTLP backend | otlphttp |
system.cpu.time |
| Prometheus scrape | prometheus |
system_cpu_time_seconds_total |
| Prometheus remote write | prometheusremotewrite |
system_cpu_time_seconds_total |
| Grafana Cloud | otlphttp to the OTLP path, or remote write |
either of the above |
The Prometheus translation is mechanical: dots become underscores, the unit is appended as a suffix, and monotonic sums get _total. Nothing about the host changes. You can also run two exporters in the same pipeline during a migration and compare the two backends against each other for a week before cutting over.
That portability is what agent-based monitoring built on OpenTelemetry buys you, and it is the reason I would not install a closed agent on a fleet today.
What host metrics will not give you
The hostmetrics receiver is a host-level reader, and that boundary is worth stating plainly.
It does not know about containers. Inside a container it reports whatever the container's mount namespace exposes, which is usually the host's /proc unless you configure otherwise. Running it in a pod means mounting the host root read-only and setting root_path: /hostfs. For per-pod data you want the kubeletstats receiver instead, which the Kubernetes monitoring guide covers.
It also has no idea what your application is doing. A saturated disk shows up as system.disk.io climbing and iowait rising, but not as the slow query that caused it. Host metrics answer "which resource is exhausted", traces and application metrics answer "which code path did it".
And the process scraper deserves a warning. It emits one set of data points per process, so a host running 400 processes produces hundreds of series that mostly churn. Enable it deliberately, with include/exclude filters, or not at all.
How Hyperping uses the same receiver
The Hyperping agent embeds an OpenTelemetry collector rather than wrapping a homegrown one, so the metric names arriving at the backend are the same ones in the tables above. Install is one line and there is no config file to maintain:
curl -fsSL https://hyperping.com/install.sh | sh -s HP_INSTALL_xxxxxIt scrapes every 30 seconds, exports OTLP/HTTP with gzipped payloads, and keeps an on-disk queue at /var/lib/hyperping/queue so an ingest outage or a reboot does not cost you the gap. Footprint is around 50 MB RSS with no JVM behind it. Linux with systemd and macOS with launchd, on amd64 and arm64. Windows is not supported yet.
The ingested set is deliberately narrower than what the receiver can emit: system.cpu.utilization with per-state and per-CPU attributes, the three load averages, logical core count, system.memory.usage and system.memory.limit, system.filesystem.usage per real mount point, system.disk.io per block device, system.network.io per interface, and system.uptime. Paging, per-process and process count metrics are not ingested today, and neither are packet or dropped-packet counters. The exact list lives in metrics collected, and the enrollment flow is in install the agent.
Those names land on the host page as one chart per scraper family, with the raw counters already turned into rates and percentages.
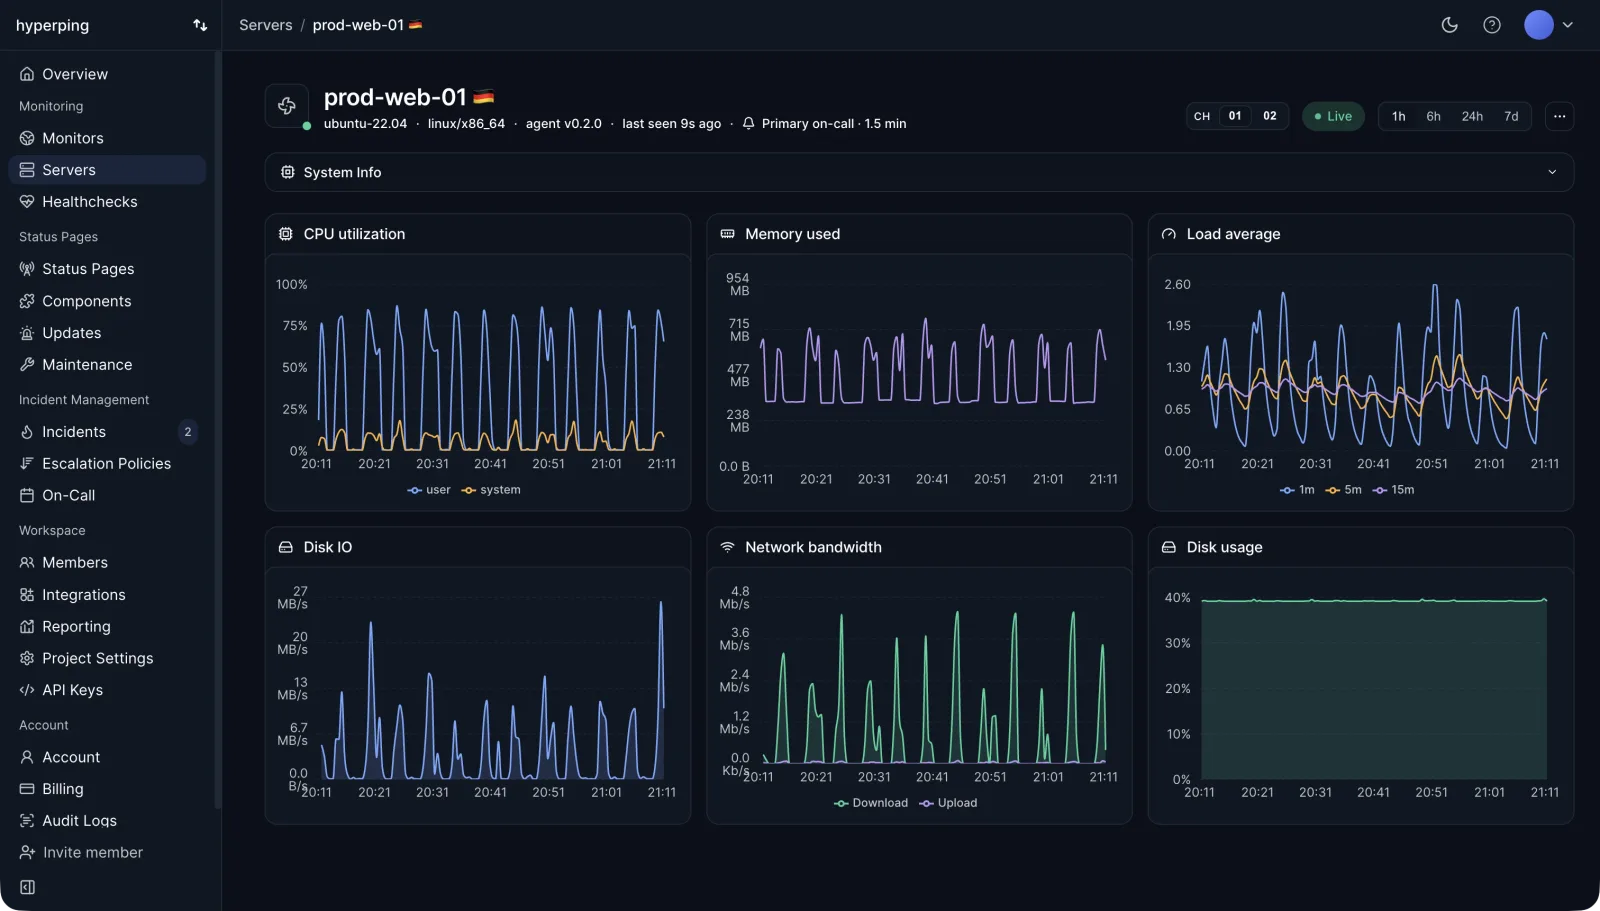
On top of the raw series, the agent's own liveness is a signal. When metrics stop arriving the host goes Stale, then Offline, which opens an outage and runs your escalation policy. That is the case a self-hosted collector will not cover for you, because a collector that dies stops reporting and stops complaining at the same moment.
If you would rather own the pipeline, run the config above and point it wherever you like. If you would rather not maintain a collector per host and a metrics store behind it, an embedded collector gives you identical host metrics with a managed backend. Either way the names are the same, which was the argument all along.
The short version
Pick your scrapers, add resourcedetection so the data has a host attached to it, export over OTLP/HTTP with a disk-backed queue, and read system.cpu.time in seconds rather than trusting a vendor's renamed version of it. Start with cpu, load, memory, filesystem, disk and network, leave process off until you have a reason, and check the numbers against mpstat and df on one host before you trust the dashboard on 400. For thresholds worth alerting on once the data is flowing, the Linux server monitoring guide and the breakdown of load average per core are the next two things to read.
FAQ
What are OpenTelemetry host metrics? ▼
They are the CPU, memory, disk, filesystem, network and load numbers that the OpenTelemetry Collector's hostmetrics receiver reads from the kernel, named according to the OpenTelemetry semantic conventions. On Linux the receiver reads /proc/stat, /proc/meminfo, /proc/diskstats, /proc/net/dev and /proc/loadavg. The output is metrics with fixed names such as system.cpu.time and system.memory.usage that mean the same thing on every host.
Which scrapers does the hostmetrics receiver support? ▼
Nine: cpu, memory, disk, filesystem, network, load, paging, processes and process. None of them run until you list them in the receiver config, and the per-process scraper usually needs elevated privileges to see other users' processes. The default collection interval is 1 minute unless you set collection_interval yourself.
Where do host.name and host.id come from in an OpenTelemetry pipeline? ▼
Not from the hostmetrics receiver. They come from the resourcedetection processor with the system detector, which attaches them as resource attributes to every metric in the pipeline. Only host.name and os.type are enabled by default, so host.id needs two lines of config to turn on.
Can I send OpenTelemetry host metrics to Prometheus? ▼
Yes. Swap the otlphttp exporter for the prometheus or prometheusremotewrite exporter and keep the same receiver. The names get normalized on the way out, so system.cpu.time becomes system_cpu_time_seconds_total, with dots turned into underscores plus a unit suffix and _total for monotonic sums.
Does the hostmetrics receiver collect container or per-pod metrics? ▼
No. It reads the host, so inside a container it reports the container's view of the kernel unless you mount the host filesystem and set root_path. For per-container and per-pod data you need the kubeletstats receiver or the Docker stats receiver, which are separate components in the collector-contrib distribution.
Do I have to run my own OpenTelemetry Collector to get host metrics? ▼
No. Any agent that embeds a collector gives you the same metric names without a config file to maintain. The Hyperping agent does this: it runs the hostmetrics receiver internally on a 30 second cadence and exports OTLP/HTTP with gzip, so the names match the semantic conventions but the backend is managed.