Monitoring a VPS takes two things your provider does not hand you: metrics collected from inside the guest operating system, and something that wakes a human when they go bad. DigitalOcean, Hetzner and Linode all give you graphs measured at the hypervisor, so they describe the virtual machine from the outside. They will not tell you that / is at 95%, that the OOM killer took your Postgres process, or that nginx is returning 502 to every visitor while CPU sits at 12%.
This guide covers what each provider gives you, which numbers you collect yourself, the commands that read them on Debian, Ubuntu and RHEL, and how to wire it all to an alert that reaches a person.
Key takeaways
- Provider dashboards show the hypervisor view. Memory, per mount filesystem usage and inode usage do not exist outside the guest, so no provider charts them without an agent on the box.
- DigitalOcean gives the most by default: CPU, bandwidth and disk I/O free, plus memory, disk usage and load average with the metrics agent, over 1 hour to 14 day windows, with alert policies to email or Slack.
- Hetzner Cloud gives CPU, network traffic and disk IOPS graphs, no in-guest memory or disk usage, and no threshold alert builder in the Cloud Console.
- CPU steal is the VPS-specific number nobody shows you. Sustained steal above 10% on a shared vCPU plan means neighbours are taking your cycles, and it is only visible from inside with
mpstatorvmstat. - A VPS can look 100% healthy on every provider graph while serving 502s. Host metrics plus external HTTP checks plus on-call routing is the full set, and splitting them across three tools is how alerts get missed.
What each provider gives you for free
The built-in tooling stops in a different place on each provider. Here is where.
DigitalOcean: Droplet graphs plus the metrics agent
Every Droplet gets CPU, public and private bandwidth, and disk I/O graphs with no setup, over selectable windows from 1 hour to 14 days. The DigitalOcean metrics agent adds the numbers that only exist inside the guest, and recent marketplace images ship with it already running.
# Install the DigitalOcean metrics agent (do-agent)
curl -sSL https://repos.insights.digitalocean.com/install.sh | sudo bash

# Confirm it is running
systemctl status do-agent --no-pager
With it installed you get memory utilization, disk usage per filesystem and load average alongside the hypervisor metrics, plus alert policies on those thresholds that notify email or Slack. For a single Droplet that is a usable free setup, and the strongest of the three defaults.
Hetzner Cloud: graphs from the hypervisor, nothing from inside
Hetzner Cloud servers get CPU usage, network traffic in and out, and disk IOPS and throughput in the Cloud Console. All three are measured outside the guest, which is why there is no memory or disk usage graph. Hetzner ships no official metrics agent and the Console has no threshold alert builder, so nothing there will contact you when a number goes bad.
The same data comes out of the Cloud API if you want it in your own tooling:
curl -s -H "Authorization: Bearer $HCLOUD_TOKEN" \
  'https://api.hetzner.cloud/v1/servers/12345678/metrics?type=cpu&start=2026-07-25T09:00:00Z&end=2026-07-25T10:00:00Z'
{
"metrics": {
"start": "2026-07-25T09:00:00+00:00",
"end": "2026-07-25T10:00:00+00:00",
"step": 60,
"time_series": {
"cpu": {
"values": [
[1784970000.0, "12.43"],
[1784970060.0, "11.87"],
[1784970120.0, "34.02"]
]
}
}
}
}One number, hypervisor measured, no memory anywhere in the response. Hetzner dedicated root servers are thinner still, with Robot showing traffic accounting and little else.
Linode: Cloud Manager analytics and Longview
Every Linode gets CPU, IPv4 network traffic and disk I/O charts in Cloud Manager over 24 hour, 30 day and 1 year views, plus per-Linode email alert thresholds for CPU usage, disk I/O rate, inbound and outbound traffic and transfer quota.
Longview, Linode's own agent, goes further than the other two defaults: CPU, memory, network, disk, listening services and process data, with modules for nginx, Apache and MySQL. The free tier keeps 12 hours of data, which is fine for live debugging and useless for answering "when did this disk start filling".
The gap they all share
| DigitalOcean | Hetzner Cloud | Linode | |
|---|---|---|---|
| CPU (hypervisor) | yes | yes | yes |
| Network bytes | yes | yes | yes |
| Disk I/O | yes | yes (IOPS) | yes |
| Memory in guest | agent only | no | Longview only |
| Filesystem usage per mount | agent only | no | Longview only |
| CPU steal visible | no | no | no |
| Threshold alerts | alert policies | none | per-Linode email alerts |
| On-call routing | no | no | no |
| History window | 14 days | limited | 1 year charts, 12h Longview |
| Multi-provider fleet view | no | no | no |
Three limits repeat. The dashboard describes the virtual machine rather than the operating system, so a full partition or an out of memory kill stays invisible. Alerting stops at an email address, with no acknowledgement, escalation or schedule. And one box on Hetzner plus one on DigitalOcean means two dashboards and no combined view.
The numbers to collect from inside the guest
Five families are worth collecting on a VPS. The general version of this list, with thresholds per workload, is in the Linux server monitoring guide.
CPU, and specifically steal time
On shared vCPU plans (DigitalOcean Basic, Hetzner CX and CPX shared, Linode Shared), cores are oversubscribed by design. When neighbours get busy the hypervisor takes time away from you and the kernel records it as steal. Your provider's CPU graph does not show it, because from the hypervisor's side nothing is wrong.
# mpstat ships in sysstat: apt install sysstat / dnf install sysstat
$ mpstat -P ALL 2 2
Linux 6.8.0-45-generic (web-01)   07/25/2026   _x86_64_   (2 CPU)

10:41:02 AM  CPU    %usr   %nice    %sys %iowait    %irq   %soft  %steal  %guest  %gnice   %idle
10:41:04 AM  all   31.28    0.00    6.12    1.53    0.00    0.77   14.29    0.00    0.00   46.01
10:41:04 AM    0   30.41    0.00    5.67    1.55    0.00    0.52   18.56    0.00    0.00   43.29
10:41:04 AM    1   32.14    0.00    6.58    1.51    0.00    1.01   10.05    0.00    0.00   48.71
14.29% steal means roughly one seventh of the CPU time this box paid for went to someone else. Sustained double-digit steal is the signal to move to a dedicated vCPU plan, and it explains the incidents where response times degrade and nothing in your code changed. How to monitor CPU usage on Linux covers the other states, and CPU utilization has the definition.
Load average is the companion number. Divide it by core count before judging it:
$ cat /proc/loadavg
2.81 2.44 1.62 3/198 14207

$ nproc
2
That is 1.40 per core on the 1 minute value, so the run queue is ahead of capacity. Linux load average explained covers the arithmetic and the uninterruptible sleep trap, and load average has the definition.
Memory, where small VPS instances actually die
A 1 GB or 2 GB VPS is the size where the OOM killer shows up. Read available, never used, because Linux spends idle RAM on page cache by design.
$ free -m
               total        used        free      shared  buff/cache   available
Mem:            1963        1204          98          31         661         589

$ grep -i 'killed process' /var/log/syslog | tail -2
Jul 24 03:41:12 web-01 kernel: Out of memory: Killed process 2841 (postgres) total-vm:912348kB, anon-rss:684204kB
98 MB free looks alarming and is not. 589 MB available out of 1963 MB total, roughly 30%, is the real number. On RHEL, Rocky and Alma the OOM evidence lands in /var/log/messages, or use sudo dmesg -T | grep -i 'killed process' anywhere. Most VPS images ship with no swap, so a small swapfile buys you a slow server instead of a dead process. How to monitor memory usage on Linux covers the accounting, and memory utilization has the short version.
Filesystem usage per mount, and inodes
This is the single most common way a small VPS goes down, and it is entirely predictable in advance. Alert per mount point, never on a host average.
$ df -hT -x tmpfs -x devtmpfs
Filesystem     Type  Size  Used Avail Use% Mounted on
/dev/sda1      ext4   38G   34G  2.1G  95% /
/dev/sda15     vfat  253M  6.1M  247M   3% /boot/efi

$ df -i /
Filesystem      Inodes  IUsed   IFree IUse% Mounted on
/dev/sda1      2457600 421093 2036507   18% /
2.1 GB left on root, and unrotated logs or one Docker image pull will take it. Inodes exhaust independently of space, and that failure is confusing: writes fail with ENOSPC while df -h shows free gigabytes. See filesystem usage for the definition.
Disk I/O
Cloud block storage is throttled, and the throttle is what you feel. Read wait times rather than %util, which lost its meaning on multi-queue devices.
# iostat also comes from sysstat. Columns trimmed for width.
$ iostat -xz 2 2
Device     r/s   rkB/s  r_await     w/s    wkB/s  w_await  aqu-sz  %util
sda       4.50  180.00     0.88   96.00  4820.00    18.41    1.86   84.20
18.41 ms average write wait on network-attached SSD means you are at the plan's IOPS ceiling. The provider's disk I/O graph shows the throughput but not the latency, which is the half your application experiences. Disk I/O covers the terminology.
Network throughput and your transfer quota
VPS plans include a monthly transfer allowance and bill overage, so bandwidth is a billing metric as well as a performance one. DigitalOcean charges $0.01 per GB over the pooled allowance, and Hetzner bills per additional TB.
# apt install vnstat, then wait for the database to fill
$ vnstat -m

 eth0  /  monthly

       month        rx      |     tx      |    total    |   avg. rate
    ------------------------+-------------+-------------+---------------
      2026-06     412.31 GiB |    1.21 TiB |    1.62 TiB |    5.21 Mbit/s
      2026-07     301.77 GiB |  944.18 GiB |    1.22 TiB |    5.02 Mbit/s
vnstat reads the same kernel counters as /proc/net/dev and keeps them in a small local database, so it survives reboots and gives you month-to-date against your allowance.
A VPS that is up but broken looks perfect in every graph
Everything above is the inside-out half. The other half is whether anyone can actually use the thing. Take the most common small-server failure I see: the application process exits, systemd fails to restart it, nginx keeps listening and returns 502 to every request. CPU, memory and disk I/O all drop, so every provider graph looks better than it did an hour ago while your site is down.
An external check catches it in one request:
$ curl -o /dev/null -s -w 'code=%{http_code} dns=%{time_namelookup}s tls=%{time_appconnect}s total=%{time_total}s\n' \
  https://example.com/health
code=502 dns=0.004s tls=0.081s total=0.146s
Running that from cron on the same VPS is not enough, because a check on the machine it is checking dies with the machine. It also misses a DNS failure, an expired certificate, or a route broken from Europe but fine from your laptop in the same datacenter. The outside-in half has to run elsewhere, from more than one region, and it belongs next to your host metrics rather than in a separate tool.
Where the DIY setup stops working
Almost every VPS owner writes the same shell script eventually: df -h piped into a Slack webhook from cron. It works, then it stops working, always for the same reason. A cron script has no memory.
- No history, so you cannot see that root has been filling at 1.4 GB a day and hits zero on Thursday.
- No liveness detection, because a script on a dead machine sends nothing, and silence looks exactly like health.
- No buffering during a network drop, so the window you most want to inspect afterwards is the one with no data.
An agent-based setup fixes those by keeping a process on the host, buffering to disk when the link is down, and holding the history and the liveness check off the box so a dead machine still produces an alert.
How to use Hyperping for VPS monitoring
This is the setup I run on a small VPS fleet, from install to on-call routing. The first host takes five minutes.
1. Install the agent on the VPS
Create a server in Hyperping, copy the install command, and run it over SSH. The installer configures a systemd service on Linux and launchd on macOS, on both amd64 and arm64. Windows is not supported yet.
curl -fsSL https://hyperping.com/install.sh | sh -s HP_INSTALL_xxxxxThe agent is a compiled binary with an embedded OpenTelemetry collector, around 50 MB RSS, no JVM. It scrapes every 30 seconds and ships gzipped OTLP/HTTP, with metric names following the OpenTelemetry hostmetrics semantic conventions. If the network drops, samples queue on disk at /var/lib/hyperping/queue and survive reboots. Re-running the installer rotates credentials and keeps the same server UUID and history. The agent install docs cover the flags and the uninstall path.
Run the same command on the next box and it joins the same list, whatever provider or region it sits in.
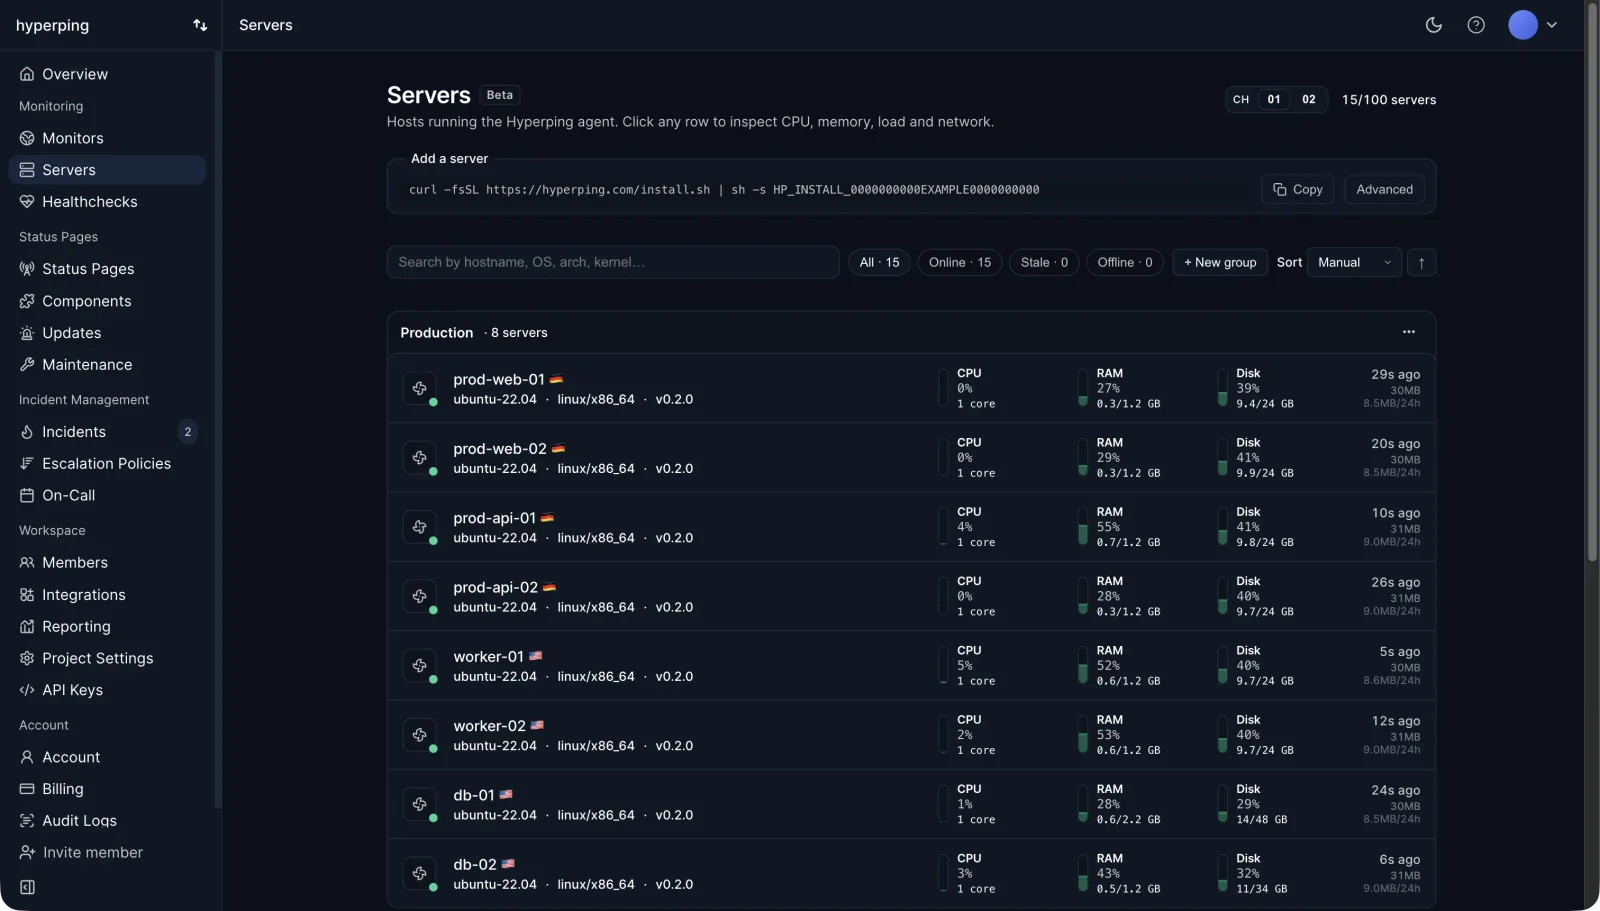
The status pills at the top are the liveness view across the fleet: Online, Stale and Offline counts, with each row carrying its own last seen timestamp. That is the combined picture two provider consoles cannot give you.
2. Watch CPU, steal time, load and memory from inside the guest
The server page shows CPU time per state as a percentage of wall clock, including user, system and iowait, with a per-CPU breakdown and the logical core count. Load averages appear as 1, 5 and 15 minute values next to that core count, and memory shows used, available and total in bytes plus utilization.
Host metadata arrives with it: hostname, OS, kernel, architecture, CPU model, boot time and agent version. On a mixed Hetzner and DigitalOcean fleet, that is the single view neither console gives you.
3. Track filesystem, disk I/O and network per device
Filesystem usage is reported per real mount point with device, mountpoint and filesystem type, and pseudo-filesystems are filtered out so you are not staring at tmpfs rows. Disk I/O is read and write bytes per block device, and network is bytes in and out per interface with TX and RX rates derived in the dashboard. The full list is in the metrics collected reference.
Stated plainly: the agent does not ingest per-process or per-container metrics, swap, or packet error counters, and it does no logs, traces or APM. On macOS, disk available is an approximation.
4. Route server outages to on-call
Server alerting is available on Essentials and above, and it fires on agent liveness rather than on resource levels. A scrape gap past 30 seconds marks the host Stale in the UI and alerts nobody. No metrics past the server's offline threshold, 90 seconds by default with a 60 second floor, opens an outage. That is the one number you tune, and on a VPS the default is the right answer.
Attach the server to an escalation policy and an on-call schedule so the outage reaches whoever is awake instead of an inbox nobody watches at 3 a.m. On a small box that single rule catches most of what actually takes it down, because a filesystem full enough or a memory squeeze bad enough will stop the agent too. The numeric rules on filesystem and available memory belong in whatever alerting layer already reads the metrics, sized the way server monitoring alert thresholds sets out.
5. Add uptime checks and a status page
Add HTTP checks against the services running on the VPS from 18 check regions, with retries so a single blip does not page anyone. That is the half that catches the 502 while CPU looks calm, and SSL monitoring covers the certificate expiry that takes down a hobby project every year. Publish a status page on top and the incident that pages your on-call also tells your users what is happening, with no manual update.
Pricing for context: Free covers 1 server agent, 20 monitors and 1 status page with 2 days of history and no server alerting. Essentials is $24 a month billed yearly with 5 agents and 7 days of history, Pro is $74 with 20 agents and 14 days, Business is $249 with 100 agents and 30 days. Extra agents are $2 a month on Essentials and Pro. The server monitoring cost calculator compares that against your own stack, and the server monitoring page has the detail.
Where to start
If you own one VPS, install your provider's free agent today and read the guest by hand with free -m, df -hT and mpstat -P ALL 2 2 until you know what normal looks like on your hardware. That costs nothing and is enough for a side project. If the VPS runs Ubuntu, how to monitor an Ubuntu server walks through the same checks step by step, including the snap mounts that make df look full.
The moment a second box appears, or someone else notices an outage before you do, the DIY version costs more than it saves. Collect all five families from an agent, page on the host going silent, and keep the external check and the on-call rotation next to the host metrics so one incident produces one page.
FAQ
Does DigitalOcean monitor my Droplet for free? ▼
Yes, up to a point. Every Droplet gets CPU, bandwidth and disk I/O graphs from the hypervisor, and installing the free DigitalOcean metrics agent adds memory, disk usage and load average. You can build alert policies on those metrics and send them to email or Slack. What you do not get is on-call routing, acknowledgements, or history beyond the 14 day window in the console.
Why does Hetzner Cloud not show memory usage? ▼
Because the Hetzner Cloud Console graphs are measured outside your server, at the hypervisor. CPU, network traffic and disk IOPS are visible from there. Memory and filesystem usage only exist inside the guest OS, so no provider can chart them without an agent running on the machine.
How do I monitor a VPS for free? ▼
Start with the provider graphs, then read the guest with free -m, df -hT, vmstat 1 and mpstat -P ALL from the sysstat package. That covers a single box you look at manually. The gap opens when you want history that survives a reboot, a fleet view across providers, and an alert that fires when the machine stops answering entirely.
What is the difference between provider metrics and a monitoring agent? ▼
Provider metrics describe the virtual machine from the outside: how much CPU the hypervisor scheduled for it, how many bytes crossed its virtual NIC. An agent runs inside the guest and reads /proc and /sys, so it sees available memory, per mount filesystem usage, per device disk I/O and CPU steal time. Both views are useful, but only the guest view tells you a partition is 95% full.
How much RAM does a monitoring agent use on a small VPS? ▼
The Hyperping agent sits at roughly 50 MB RSS with a 30 second scrape interval, which is about 2.5% of a 2 GB VPS. It is a compiled binary with an embedded OpenTelemetry collector and no JVM, so there is no runtime to size on top of it. On a 1 GB box that is still comfortable next to nginx and a small application process.
Do I still need uptime monitoring if I collect server metrics? ▼
Yes. Host metrics tell you the machine is healthy, not that customers can reach it. A VPS with 20% CPU and 60% memory can be serving 502s because the application process died behind nginx, and every provider graph will look perfect. External HTTP checks from multiple regions are what catch that.