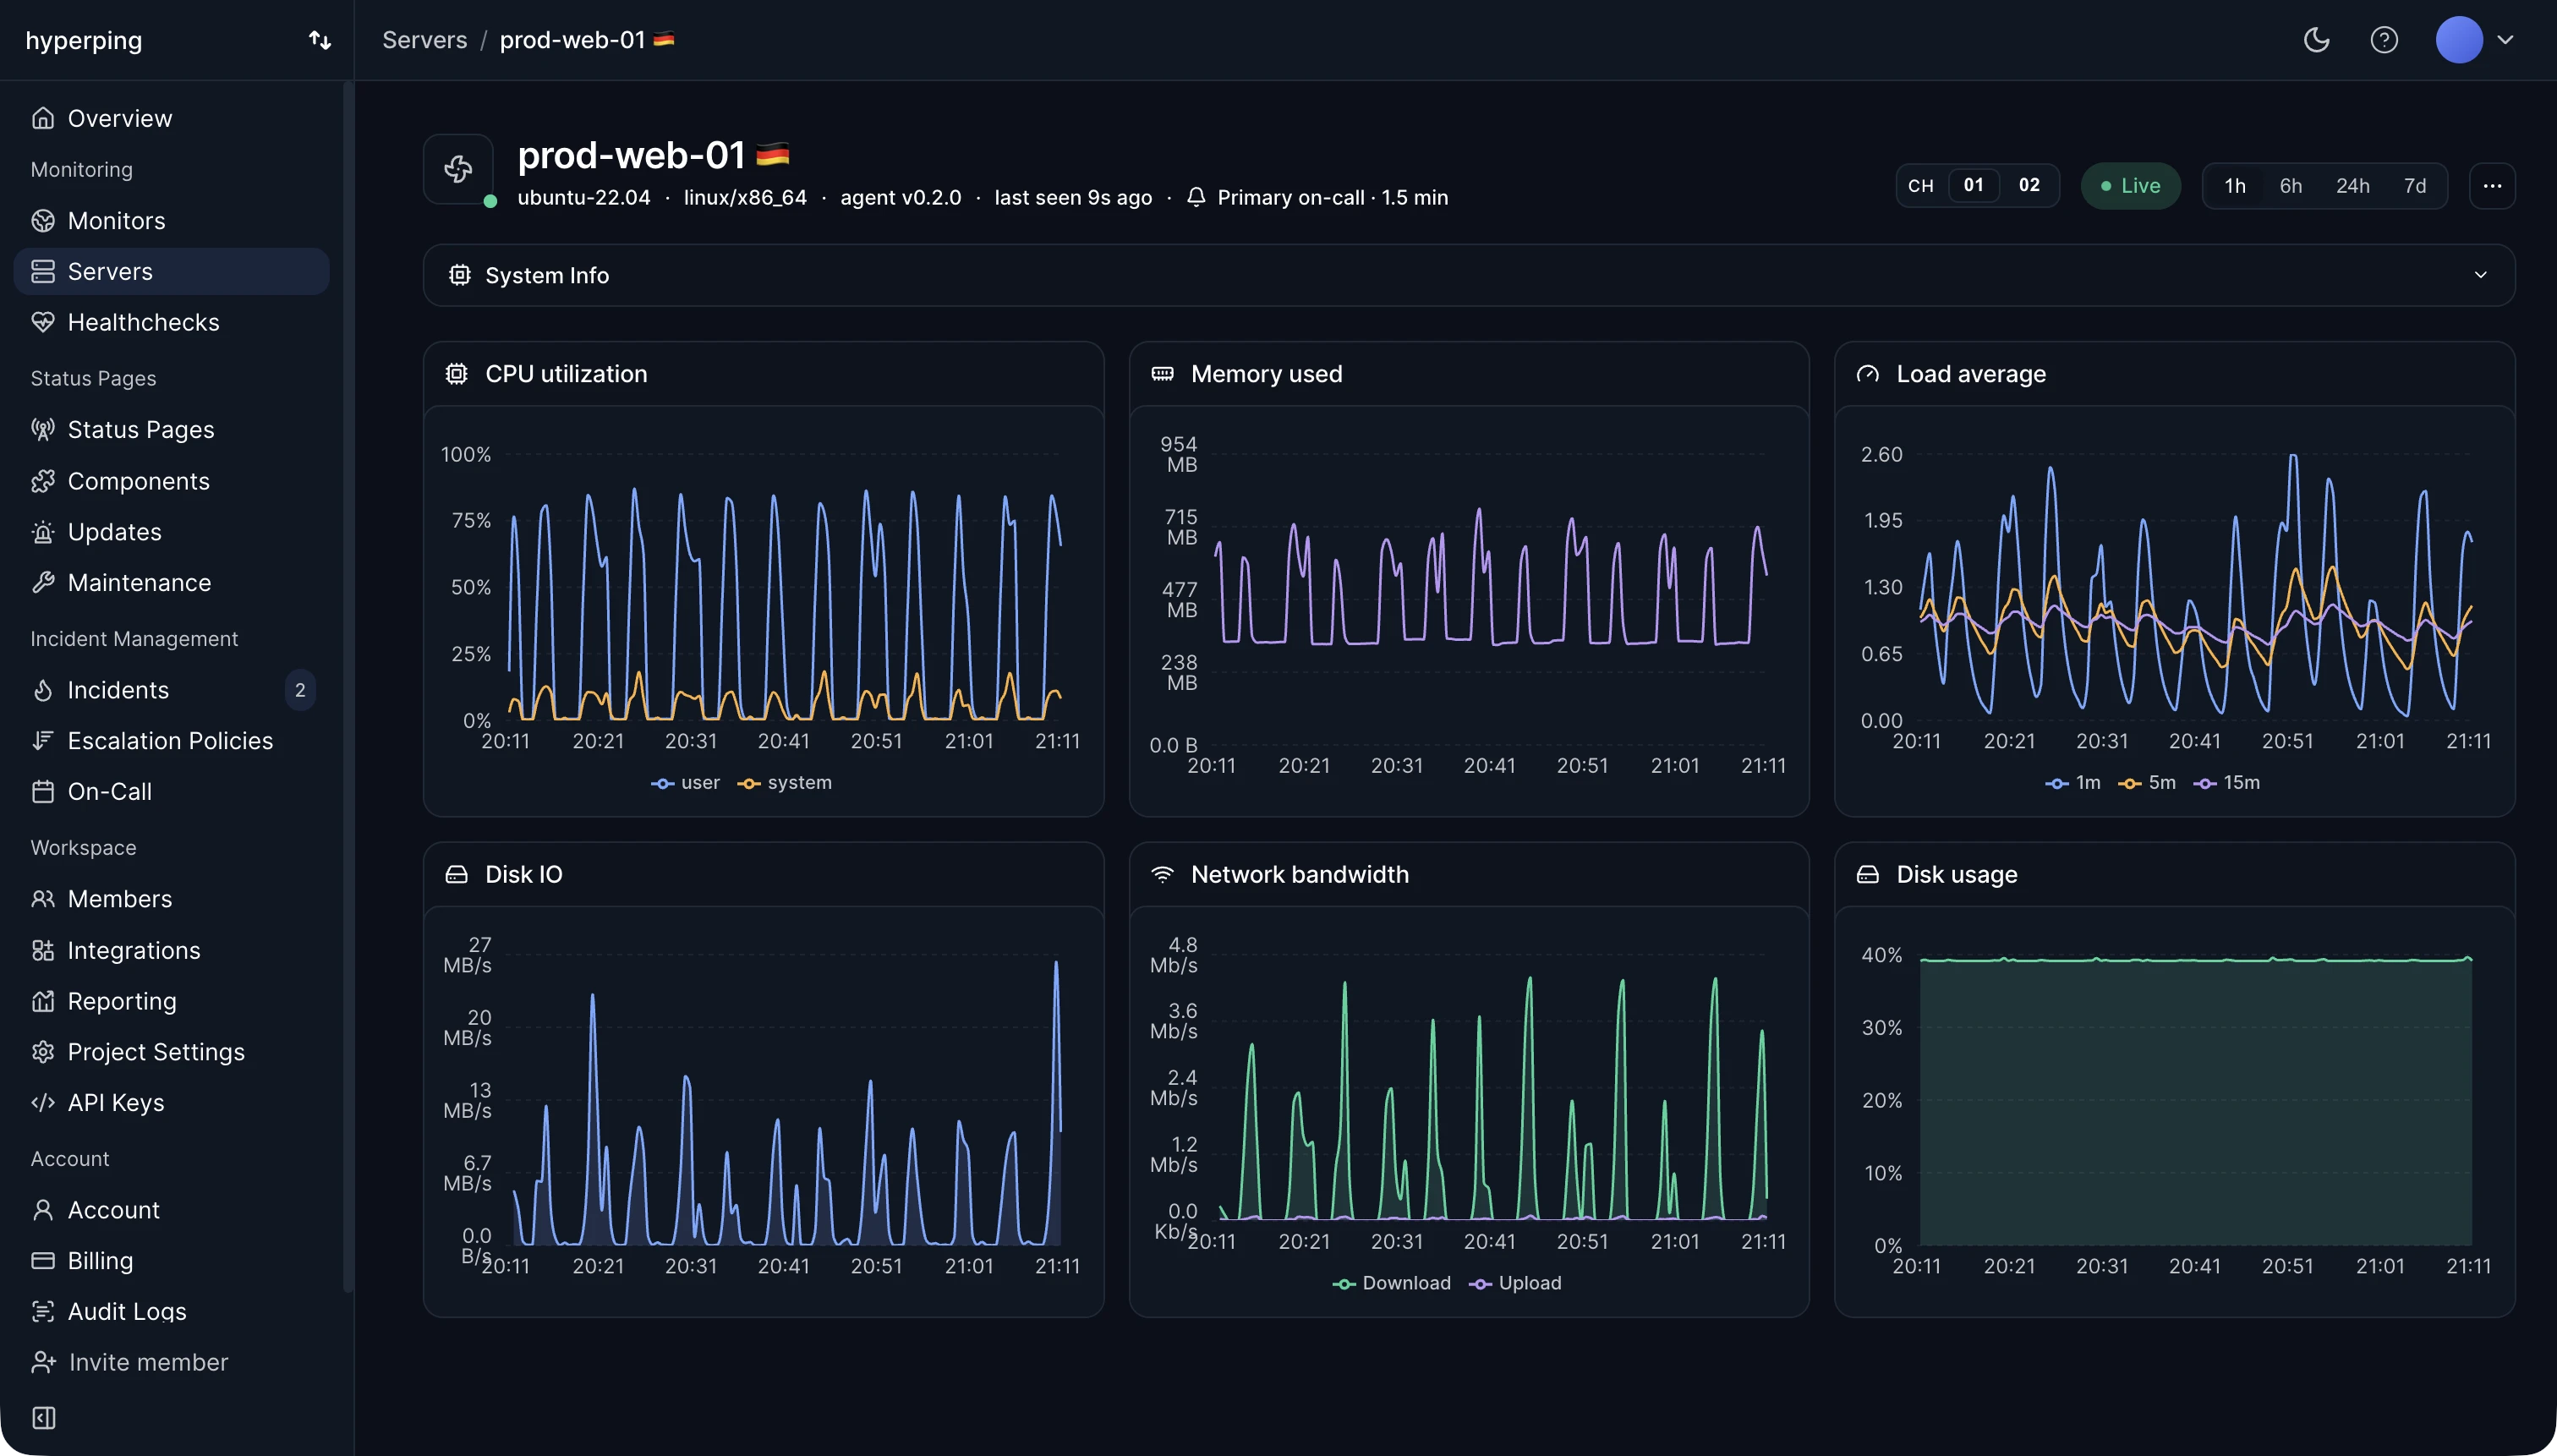
Hyperping's server agent embeds an OpenTelemetry collector and exports OTLP over HTTP with gzipped payloads, using the metric names of the OpenTelemetry hostmetrics receiver. You don't run a collector of your own, and the signals stay portable if you later want to send them somewhere else as well.
The parts of OpenTelemetry
- The specification and semantic conventions: agreed names for metrics and attributes.
- SDKs for each language, to instrument applications.
- The collector, a standalone process that receives, batches, filters, and forwards telemetry, possibly to several destinations at once.
- OTLP, the protocol that carries data over HTTP or gRPC.
Semantic conventions
The part that matters day to day is the naming. system.cpu.time or system.memory.usage means the same thing no matter who collected it or where it's stored. Instrumentation lives in your code and on your hosts, the backend becomes a routing decision, and switching vendors turns into a configuration change instead of a re-instrumentation project.
For infrastructure, the hostmetrics receiver defines the standard CPU, memory, filesystem, disk, and network metrics. Any agent that follows it produces host metrics you can compare across tools.
Limits of OpenTelemetry
It isn't a backend. OpenTelemetry produces and moves telemetry, and something else has to store it, chart it, and alert on it. It also doesn't decide what to measure for you: a service instrumented with OTel but no useful spans or metrics tells you as little as before.
FAQ
Is OpenTelemetry free?
Yes. It's open source under the Apache 2.0 license. You pay for wherever you send the data.
What is the difference between OpenTelemetry and Prometheus?
Prometheus is a metrics backend and a pull-based collection model. OpenTelemetry covers traces, metrics, and logs, and pushes data over OTLP. They work together: the collector can scrape Prometheus endpoints, and Prometheus can ingest OTLP.
Do I need OpenTelemetry for server monitoring?
No, but it's worth choosing an agent that follows its conventions, so your metric history means the same thing if you change tools.