To monitor an Ubuntu server, watch seven things: CPU, load average, memory, disk space, disk I/O, network and whether the machine is up at all. You can check all of them in under a minute with commands that ship with Ubuntu (top, free, df, vmstat) plus iostat from the sysstat package. That is fine while you are logged in. To keep a history and get woken up when the server stops answering, install an agent that ships metrics off the box and pages someone when they stop arriving.
This guide covers both halves on Ubuntu 22.04 and 24.04 LTS: the manual check, then a step-by-step agent setup with a dashboard and on-call alerting.
Key takeaways
- The seven signals worth watching on any Ubuntu server are CPU, load average, memory, disk space per mount, disk I/O, network throughput and uptime.
top,free,df,vmstatanduptimecome preinstalled with Ubuntu.iostat,mpstatandsarneedsudo apt install sysstat.- On Ubuntu,
df -hlists every snap as a squashfs loop device at 100% used. Add-x squashfsor you will chase a disk problem that does not exist. - Terminal commands keep no history and alert nobody. A server that is completely down produces no output at all, so the alert has to come from outside the machine.
- The Hyperping agent installs with one command, scrapes every 30 seconds, and opens an outage after 90 seconds of silence by default.
What to monitor on an Ubuntu server
| Signal | What it tells you | Quick command | Healthy looks like |
|---|---|---|---|
| CPU | How busy the processors are, split into user, system, iowait and steal | top, mpstat -P ALL 2 2 |
Headroom on every core, not only on average |
| Load average | How many tasks are running or waiting | uptime |
Below the core count from nproc |
| Memory | How much RAM is left for new work | free -h |
Plenty in the available column |
| Disk space | How full each filesystem is | df -hT |
Every real mount below roughly 80 to 85% |
| Disk I/O | How hard the storage is working and how long requests wait | iostat -xz 2 2 |
Low r_await and w_await |
| Network | Bytes in and out per interface | cat /proc/net/dev, ip -s link |
Steady against your plan's limits |
| Uptime | Whether the box rebooted, and whether users can reach it | uptime -s, last reboot |
No unexplained reboots |
CPU is the one everyone checks first and the one most often misread, because a single percentage averages across cores. The CPU utilization entry and how to monitor CPU usage on Linux cover per-core and steal time in depth.
Load average is only meaningful next to the core count. A load of 4 is a full run queue on a 4 vCPU instance and idle on a 32 core one. Linux load average explained has the arithmetic.
Memory runs out quietly. Read available, never used, because Linux fills spare RAM with page cache on purpose. How to monitor memory usage on Linux goes through each column.
Disk space is the most common reason a small Ubuntu server stops working, usually through logs, Docker images or old kernels in /boot. See how to monitor disk space on Linux.
Disk I/O and network matter most on cloud VMs, where storage and bandwidth are throttled per plan. Troubleshooting high iowait and how to monitor network throughput on Linux cover both.
Uptime has two meanings and you want both: the operating system's time since boot (an unplanned reboot is a signal), and whether the services on the box answer from the outside.
Check an Ubuntu server by hand in one minute
These are the commands I run when I SSH into an Ubuntu box that "feels slow". All output below comes from a 4 vCPU, 8 GB Ubuntu 24.04 VM.
top or htop for CPU and processes
top ships with Ubuntu as part of procps. htop is present on most Ubuntu Server installs. If it is missing, sudo apt install htop.
$ top
top - 10:14:52 up 23 days,  4:02,  1 user,  load average: 1.82, 1.41, 1.20
Tasks: 187 total,   1 running, 186 sleeping,   0 stopped,   0 zombie
%Cpu(s): 31.2 us,  4.1 sy,  0.0 ni, 62.8 id,  1.6 wa,  0.0 hi,  0.3 si,  0.0 st
MiB Mem :   7937.6 total,    412.3 free,   3171.9 used,   4606.2 buff/cache
MiB Swap:      0.0 total,      0.0 free,      0.0 used.   4765.7 avail Mem
Press 1 to split CPU per core and M to sort processes by memory. A high wa means the CPU is waiting on disk, and a non-zero st on a cloud VM means the hypervisor is handing your cycles to another tenant.
uptime and nproc for load
$ uptime
 10:14:58 up 23 days,  4:02,  1 user,  load average: 1.82, 1.41, 1.20

$ nproc
4
1.82 on 4 cores is comfortable. The same numbers climbing from 1.20 to 1.82 over 15 minutes tell you load is rising, which is worth a second look if it keeps going.
free for memory
$ free -h
               total        used        free      shared  buff/cache   available
Mem:           7.7Gi       3.1Gi       412Mi        41Mi       4.5Gi       4.6Gi
Swap:             0B          0B          0B
412 MiB free looks alarming and is not. 4.6 GiB available is the real headroom. Note the empty swap line: Ubuntu cloud images ship without swap, so when available reaches zero the kernel's OOM killer ends a process instead of the server slowing down. journalctl -k | grep -i "killed process" shows whether it already happened.
df for disk space, without the snap noise
Plain df -h on Ubuntu is cluttered with snap packages:
$ df -h
Filesystem      Size  Used Avail Use% Mounted on
tmpfs           794M  1.1M  793M   1% /run
/dev/sda1        77G   61G   16G  80% /
tmpfs           3.9G     0  3.9G   0% /dev/shm
/dev/loop0       64M   64M     0 100% /snap/core22/1621
/dev/loop1       39M   39M     0 100% /snap/snapd/21759
/dev/sda16      881M  112M  707M  14% /boot
/dev/sda15      105M  6.1M   99M   6% /boot/efi
Every /snap/... row reads 100%. Each snap is a read-only squashfs image, which is full by design, so those rows are never a problem. Filter them out along with the in-memory filesystems:
$ df -hT -x tmpfs -x devtmpfs -x squashfs -x efivarfs
Filesystem     Type  Size  Used Avail Use% Mounted on
/dev/sda1      ext4   77G   61G   16G  80% /
/dev/sda16     ext4  881M  112M  707M  14% /boot
/dev/sda15     vfat  105M  6.1M   99M   6% /boot/efi
That is the list worth watching. Run df -i / too, because a filesystem can run out of inodes with gigabytes still free.
vmstat and iostat for a short time series
vmstat is preinstalled. iostat, mpstat and sar come from sysstat:
sudo apt install sysstat$ vmstat 5 3
procs -----------memory---------- ---swap-- -----io---- -system-- ------cpu-----
r b swpd free buff cache si so bi bo in cs us sy id wa st
1 0 0 422180 98304 4618240 0 0 22 141 611 1102 18 3 78 1 0
2 0 0 418024 98304 4619912 0 0 0 388 1480 2604 33 4 61 2 0
3 1 0 411872 98312 4621204 0 0 12 512 1592 2811 35 5 57 3 0Ignore the first line, which is an average since boot. After that, r is the number of tasks waiting for CPU and b the number blocked on I/O.
# Columns trimmed for width
$ iostat -xz 2 2
Device     r/s   rkB/s  r_await     w/s    wkB/s  w_await  aqu-sz  %util
sda       3.00   96.00     0.71   61.50  2944.00     4.12    0.27   18.40
Same rule: the first report covers the time since boot, so read the second. Watch r_await and w_await in milliseconds. Single digits on SSD-backed cloud storage is normal. Tens of milliseconds means the volume is at its throughput limit.
If you want local history, sysstat can record it: set ENABLED="true" in /etc/default/sysstat, run sudo systemctl enable --now sysstat, and sar -u -f /var/log/sysstat/saDD reads back a given day. Ubuntu keeps 7 days by default.
Why checking by hand is not enough
Every command above answers "what is happening right now, while I am logged in". Three things are missing.
- Nobody watches a terminal at 3 a.m.
dfdoes not send a message when/crosses 95%. The first person to notice is usually a customer. - There is no history you can rely on.
topforgets everything when you close it.sarremembers a week, on the same disk as the problem, and disappears with the machine. - A dead server says nothing. If the kernel panics, the VM is stopped by the provider or the network drops, every tool on the box goes quiet. Silence from a script looks exactly like health.
The usual workaround is a cron job that pipes df -h into a Slack webhook. It covers the first point and misses the other two. What fixes all three is an agent on the server that ships metrics somewhere else, with the liveness check running off the box so a silent server raises an alarm. That is the moment to keep a history of every Ubuntu server and get paged when one stops reporting, which is what the next section sets up.
How to monitor an Ubuntu server with Hyperping
The whole setup takes about five minutes for the first server. You need a user that can sudo, and outbound HTTPS to api.hyperping.io and ingest.hyperping.io. Ubuntu's ufw allows outgoing traffic by default, so no firewall rule is needed unless you changed that policy.
1. Install the agent on Ubuntu
In Hyperping, open Servers, click New server and give it a name such as web-01. Copy the install command it shows and run it on the Ubuntu host:
curl -fsSL https://hyperping.com/install.sh | sh -s HP_INSTALL_xxxxxReplace HP_INSTALL_xxxxx with your token. The installer checks the OS, architecture (amd64 or arm64) and init system, downloads the agent and verifies its SHA256, creates a hyperping system user, writes its config to /etc/hyperping/ and registers a systemd service. It needs curl and tar, which Ubuntu Server already has. On a stripped-down image, sudo apt install curl first.
To set a display name, bind an escalation policy or drop the server into a group at install time, pass flags after the token. That is handy when the same command runs across many machines from Ansible or cloud-init:
curl -fsSL https://hyperping.com/install.sh | sh -s -- \
  HP_INSTALL_xxxxx \
  --name "web-01" \
  --policy 6fe4c2e0-... \
  --group web-tier
The install the agent docs list every file the installer writes and how to rotate credentials by re-running it.
2. Check that the agent is running
sudo systemctl status hp-agent.service
sudo journalctl -u hp-agent.service -f
The service should be active (running). The agent embeds an OpenTelemetry collector, targets around 50 MB of RAM, and scrapes every 30 seconds. If the network drops, unsent metrics queue on disk at /var/lib/hyperping/queue and are sent when the link returns, so a blip does not leave a hole in the graphs. If nothing shows up in the dashboard, the logs almost always point at blocked egress to ingest.hyperping.io.
3. Read the metrics on the dashboard
Refresh the Servers view. Within about 30 seconds the new row turns green and the panels start filling in.
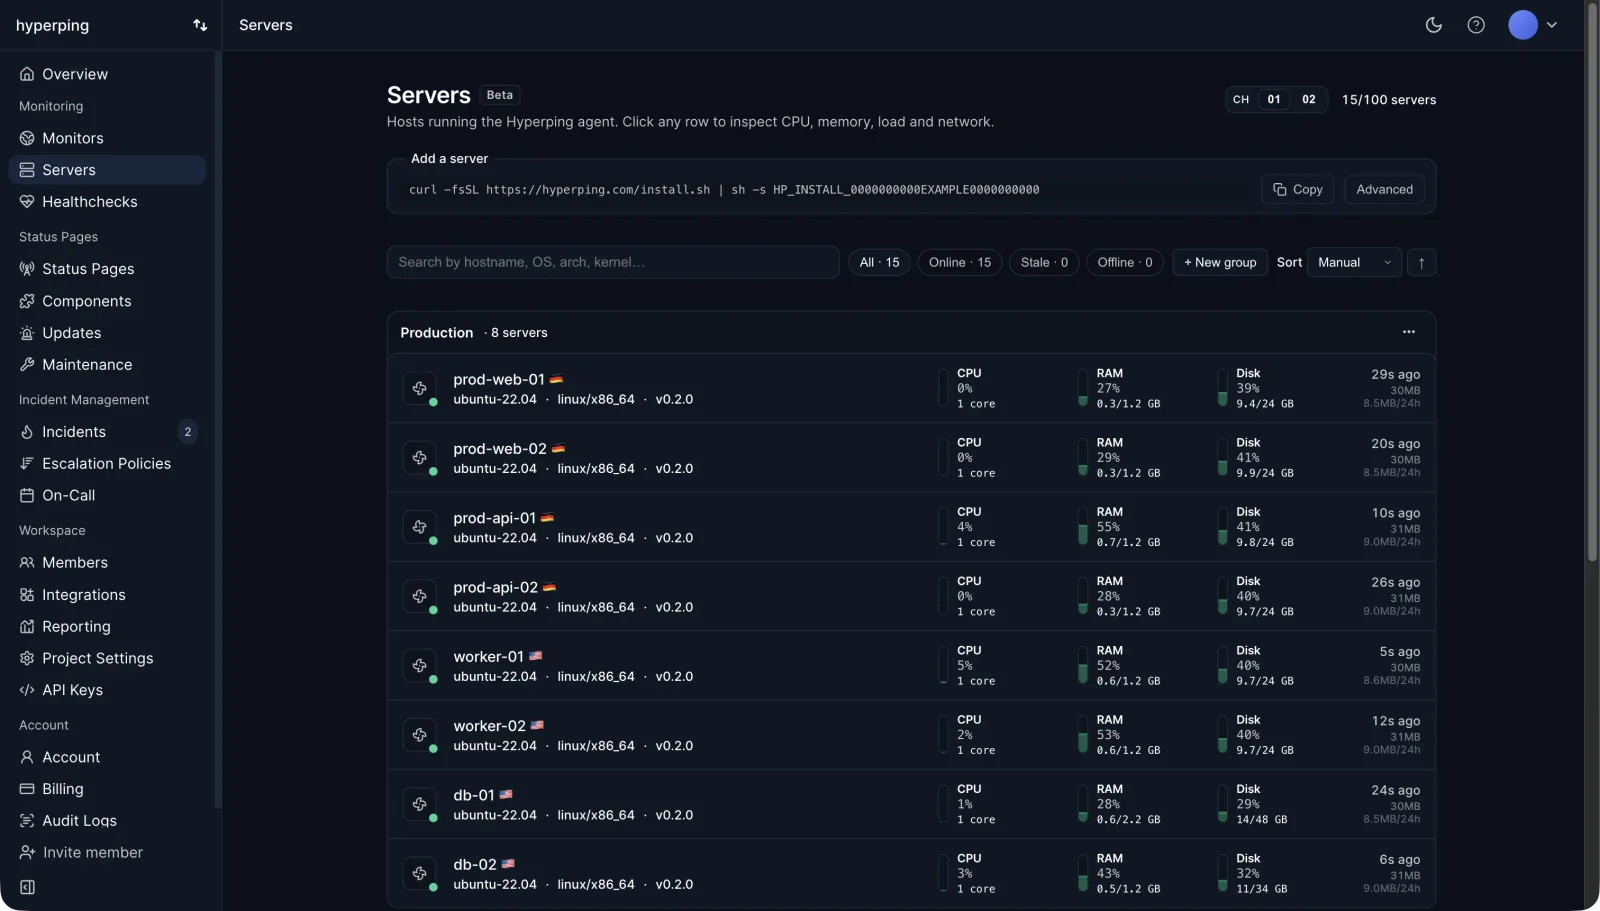
Open the server to get the full dashboard for it:
- CPU: utilization split into user, system, iowait and other states, with a per-CPU breakdown and the logical core count.
- Load: the 1, 5 and 15 minute load averages.
- Memory: used, available and total, plus utilization.
- Filesystem: used and free space for every real mount point, with device, mount point and filesystem type, shown as a per-mount table.
- Disk I/O: bytes read and written per block device.
- Network: bytes in and out per interface, with TX and RX rates.
- System info: hostname, OS (
Ubuntu 24.04), kernel, architecture, CPU model, boot time and agent version. A boot time that changed overnight tells you the server rebooted.
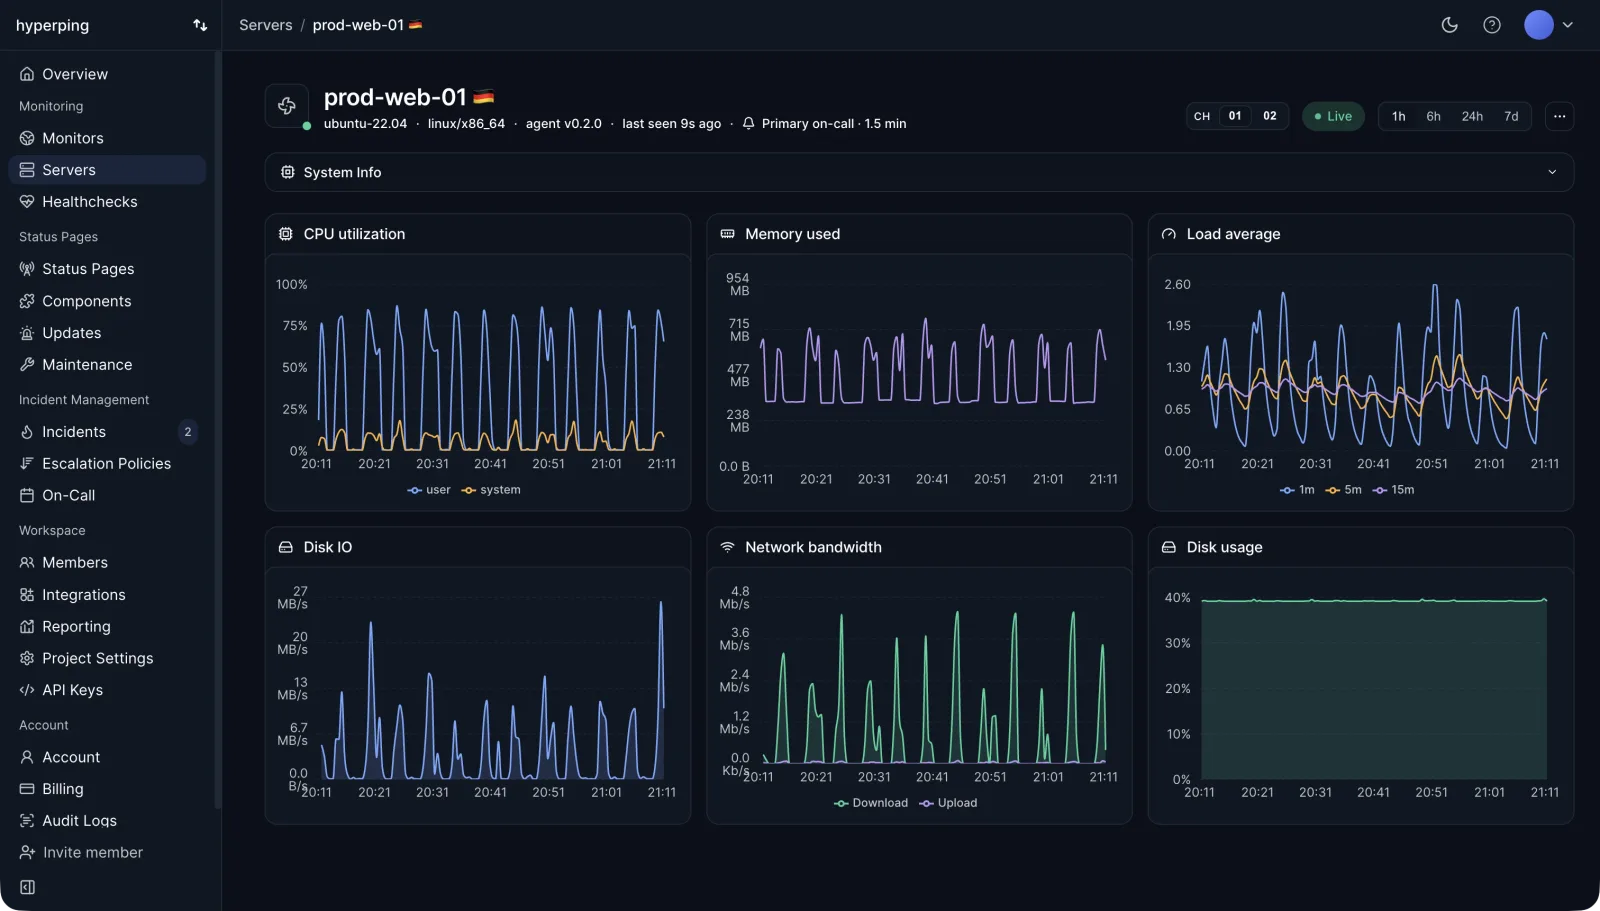
Graphs update within a few seconds of each scrape. How far back you can scroll depends on the plan: 2 days at 1-minute resolution on Free, 7 days on Essentials, 14 on Pro and 30 on Business, with coarser rollups kept longer. The agent does not collect per-process or per-container metrics or swap, so keep htop for "which process is it". The metrics collected reference lists every field.
4. Page on-call when the server stops reporting
This is the step that replaces watching a terminal. Hyperping derives liveness from metric arrival:
| State | When | What happens |
|---|---|---|
| Online | Metrics arrived within the last scrape window | Nothing |
| Stale | No metrics for 30 seconds | Shown in the UI only, no alert |
| Offline | No metrics past the offline threshold, 90 seconds by default | An outage opens and the escalation policy is paged |
Open the server's Alerting panel and bind an escalation policy. Its steps can notify email, SMS, phone calls, Slack, Microsoft Teams, PagerDuty, Opsgenie or webhooks, or hand off to an on-call schedule so the page reaches whoever is on duty that night rather than a shared inbox. When the agent reports again, the outage resolves and a recovery notification goes to the same channels.
The offline threshold is per server, with a 60 second floor. Set it longer than your worst expected network blip and shorter than you would want to wait before being woken up. For most Ubuntu servers the 90 second default is right.
Be clear about what this alert covers. It fires when the server goes silent: a crash, a kernel panic, a provider shutting down the VM, a network cut, or a machine so starved of memory or disk that the agent itself stops. It does not fire on a resource level such as "disk above 90%". Those numbers are on the dashboard and in the history, so you can see a trend building, but numeric thresholds are not an alert type today. Server monitoring alert thresholds explains how to size them in whatever alerting layer you use for that.
5. Test the alert end to end
Never trust an alert you have not seen fire. On a non-critical server, stop the agent:
sudo systemctl stop hp-agent.serviceWait for the offline threshold to pass. The escalation policy should page you. Then bring it back and check that the recovery notification arrives:
sudo systemctl start hp-agent.serviceWhat it costs
The free plan includes 1 server agent with the dashboard and history, which is enough to try this on one Ubuntu box. Server alerting, the paging in steps 4 and 5, is on the paid plans. Essentials is $24 a month billed yearly ($29 monthly) with 5 agents and on-call and escalation policies. Pro is $74 a month billed yearly with 20 agents, and Business is $249 with 100. Every plan also includes HTTP monitors, so you can check from outside that the site on the server actually answers, next to its host metrics. The pricing page has the full comparison.
Free and open-source Ubuntu monitoring dashboards
If you would rather host the dashboard yourself, these are the options I would look at first on Ubuntu. All of them are free.
| Tool | Install on Ubuntu | What you get | What you still set up yourself |
|---|---|---|---|
| Cockpit | sudo apt install cockpit, then https://your-server:9090 |
Web console with live CPU, memory, disk and network graphs, plus services, logs and updates | History, alerting, anything across more than a few servers |
| Glances | sudo apt install glances, glances -w for the web UI on port 61208 |
A top-style overview of every metric on one screen, in the terminal or a browser |
History and alerting |
| Netdata | Official install script or the Ubuntu package | Per-second charts for hundreds of metrics with zero config | Alert routing to on-call, and exposing the dashboard safely |
| Prometheus + node_exporter + Grafana | sudo apt install prometheus prometheus-node-exporter, Grafana from its own APT repo |
The most flexible stack: long history, custom dashboards, PromQL alert rules | Everything: storage sizing, Alertmanager, upgrades, and a way to know the monitoring server itself is up |
A few notes from running these. Cockpit and Glances are the fastest way to get a graph in a browser, and both describe one machine live. Netdata goes much deeper on a single host with no configuration at all. Prometheus with Grafana is where teams end up when they want custom dashboards and rules across a fleet, and it is also a second system to operate. Whichever you pick, the alert on "server is down" has to come from a machine other than the one being monitored.
Where to start
If you have one Ubuntu server and just want to know it is healthy today, run uptime, free -h, df -hT -x squashfs -x tmpfs and iostat -xz 2 2, and learn what normal looks like on your hardware.
If that server matters to someone other than you, install the agent, bind an escalation policy, and stop the agent once to prove the page reaches you. For the rest of the Linux picture, including thresholds per workload, the Linux server monitoring guide is the longer read.
FAQ
What is the best free way to monitor an Ubuntu server? ▼
For a quick look, the tools already on the box are enough: top or htop, free -h, df -h, vmstat, plus iostat and sar after sudo apt install sysstat. For a dashboard, Netdata, Cockpit (sudo apt install cockpit) and Prometheus with node_exporter and Grafana are all free and open source. Hyperping's free plan also covers one server agent with a hosted dashboard, without paging.
How do I check CPU, memory and disk usage on Ubuntu from the terminal? ▼
Run top or htop for CPU and load, free -h for memory, and df -hT -x tmpfs -x squashfs for disk space per mount. Read the available column in free, not free, because Linux uses idle RAM for cache. The -x squashfs flag hides the snap loop devices, which always show 100% used on Ubuntu.
Does Ubuntu have a built-in monitoring dashboard? ▼
Not by default on Ubuntu Server. The closest packaged option is Cockpit, a web console you install with sudo apt install cockpit and open on port 9090, which shows live CPU, memory, disk and network graphs. It is a live view of one machine and does not page anyone when the server goes down.
Why does df show /snap at 100% on Ubuntu? ▼
Each snap package is mounted as a read-only squashfs image on a loop device, and a read-only image is always full by design. Those rows are not a disk space problem. Exclude them with df -h -x squashfs, and exclude squashfs mounts from any disk alert you build.
How do I get alerted when my Ubuntu server goes down? ▼
A check that runs on the server dies with the server, so the alert has to come from somewhere else. With the Hyperping agent installed, a server that stops reporting metrics goes Offline after 90 seconds by default, opens an outage and pages the escalation policy bound to it, which can route to an on-call schedule, phone calls, SMS, Slack or email. Server alerting is on the paid plans.
Which Ubuntu versions does the Hyperping agent support? ▼
The installer needs Linux with systemd on amd64 or arm64, plus curl and tar. Every supported Ubuntu Server release uses systemd, so 22.04 and 24.04 LTS both qualify. It registers a hp-agent.service unit you can check with systemctl.