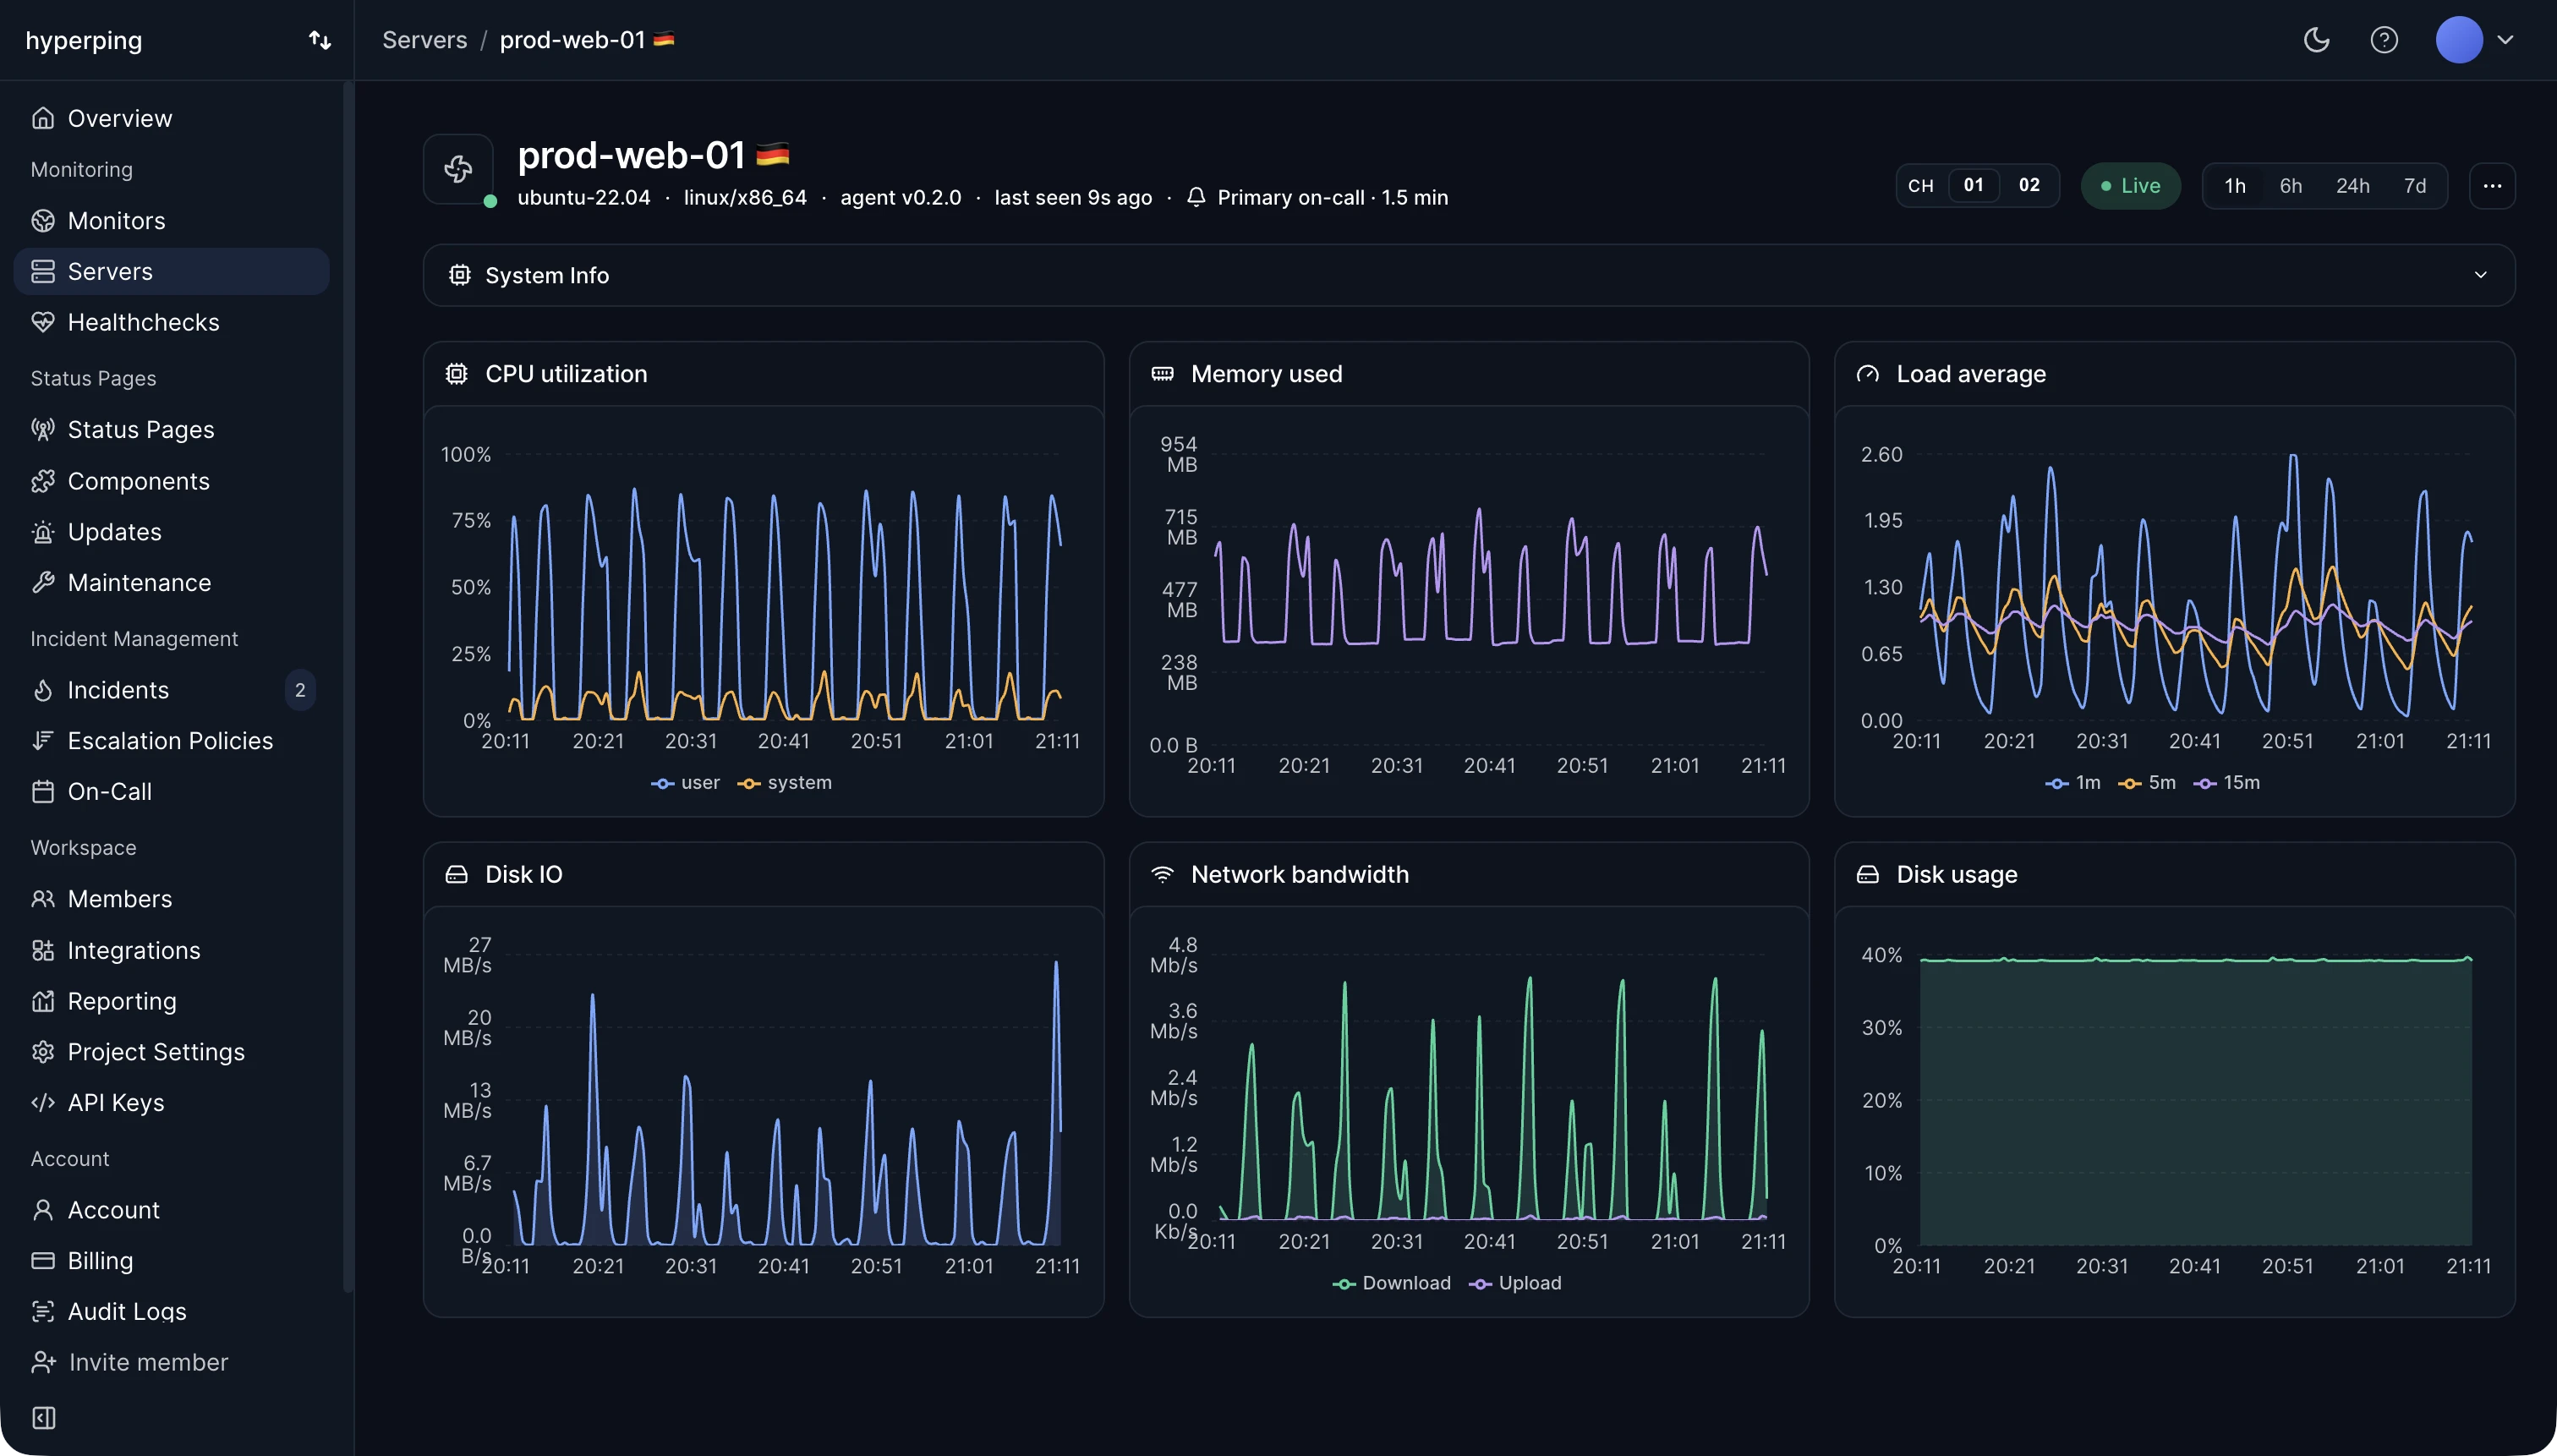
Hyperping's server agent collects bytes read and written for every block device every 30 seconds, and the dashboard turns them into rates. Per-device rates make it easy to see which volume saturates when requests start to queue, on the same timeline as CPU, iowait, and memory.
Throughput, IOPS, and latency
Throughput (megabytes per second) is only half the picture, and often the less interesting half. A device can be saturated at a low byte rate when the access pattern is small and random, because spinning disks and network-attached volumes are limited by operations per second and queue latency, not raw megabytes. A database doing thousands of 8 KB reads can max out a volume at 30 MB/s.
When diagnosing, look at all three: throughput for sequential work like backups, IOPS for databases and small files, and latency (await in iostat) for what the application actually feels.
The cloud volume trap
Many cloud volumes use burst credits: they run fast for hours, then fall back to a much lower baseline once the credits run out. The same workload gets slow with nothing changing in the application. If disk I/O drops to a flat ceiling while iowait climbs, check the volume's credit balance in your provider's console.
Using disk I/O in monitoring
Most of the value is in correlation and capacity planning. A sustained write rate close to a volume's provisioned limit predicts the incident days ahead. Read disk I/O next to iowait and load average, not on its own: high I/O with low iowait is a busy, healthy disk, and the same I/O with climbing iowait is a bottleneck.
FAQ
What is the difference between IOPS and throughput?
IOPS counts operations per second, throughput counts bytes per second. Throughput equals IOPS times the size of each operation, so small random operations hit the IOPS limit long before the throughput limit.
How do I check disk I/O on Linux?
iostat -x 1 shows reads, writes, utilization, and latency per device. iotop shows which process is doing the I/O.
What causes high disk I/O?
Databases without enough memory to cache their working set, swapping, log files written at high volume, backups, and large batch jobs. Check whether the I/O lines up with a scheduled job before looking further.