Linux load average is the number of tasks either running on a CPU, waiting for a free CPU, or blocked in uninterruptible sleep, averaged over the last 1, 5 and 15 minutes. It is not a percentage, it has no ceiling, and the number on its own is meaningless until you know how many logical cores the machine has. Load 8 on an 8 core box is one task per core and perfectly healthy. Load 8 on a 2 core box is four times more work than the machine can run at once.
Key takeaways
- Load average counts runnable tasks plus tasks in uninterruptible sleep (D state), so Linux load can sit at 40 while CPU utilization reads 5%.
- Divide load by the logical core count from
nproc. Above 1.00 per core, work is queueing. - The three figures are exponentially damped moving averages built from a run queue sample taken every 5 seconds, so the 1 minute value still carries older history.
- High load with low CPU and a large
wafigure intoppoints at disk or NFS, not at the processor. - Load average never tells you which resource is saturated. Read it next to iowait, disk queue depth, and a count of D state processes.
What the three numbers actually measure
Run uptime on any Linux host and the three figures land at the end of the line.
uptime 15:42:11 up 37 days, 4:19, 2 users, load average: 3.42, 2.91, 2.14Those three values are the load average, covering roughly the last 1, 5 and 15 minutes. They are not simple means over fixed windows. The kernel samples the run queue every 5 seconds and folds each sample into three exponentially damped moving averages, which is why the 1 minute value still contains a fading contribution from several minutes back. The arithmetic lives in kernel/sched/loadavg.c.
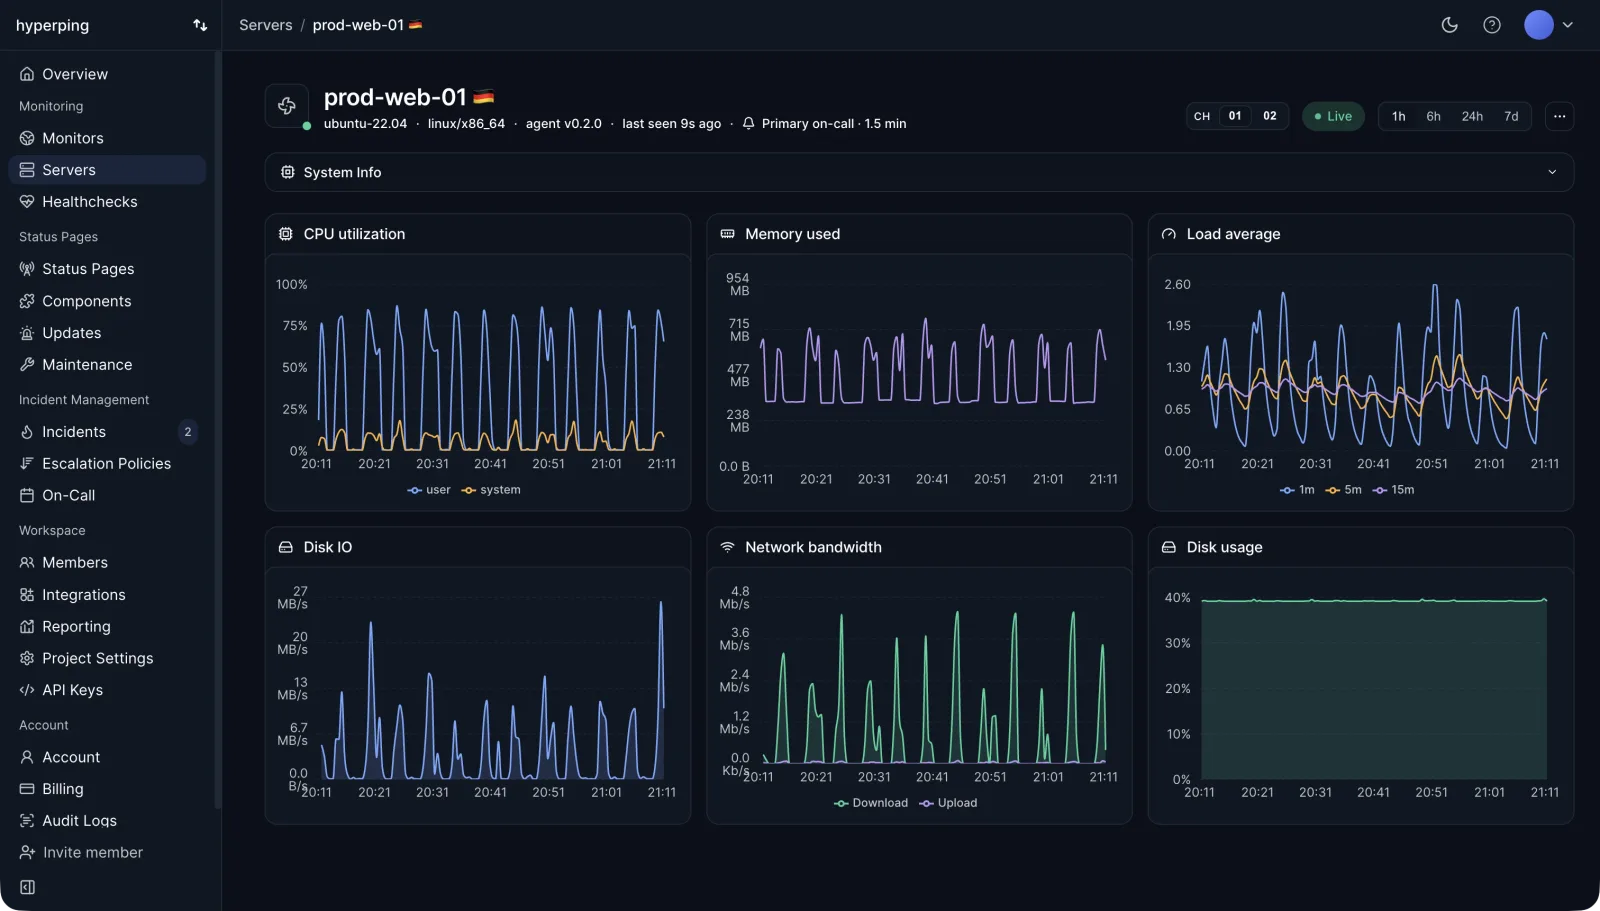
Reading the three in order gives you direction for free. 3.42, 2.91, 2.14 is a machine getting busier. 2.14, 2.91, 3.42 is a machine recovering from a spike that already passed. When all three sit within about 10% of each other, you have a steady state, and that is the shape worth alerting on because it will not resolve on its own.
Plotting the three together makes that direction obvious without any mental arithmetic.
Why Linux load average is not a CPU queue metric
On most other Unix systems, load average counts only tasks that want CPU. Linux also counts tasks in TASK_UNINTERRUPTIBLE, shown as D in ps output. Those are threads parked inside a syscall waiting on a block device, on a network filesystem such as NFS, or on a kernel lock they cannot be signalled out of.
Brendan Gregg went through the kernel mailing list archives in 2017 and traced the behaviour to a 1993 patch, on the reasoning that a machine wedged on I/O is just as unavailable as a machine wedged on CPU. The consequence is that Linux load average measures demand on the whole system, not demand on the processor.
That single design decision explains the most common confusion in server monitoring. Thirty processes blocked on one hung NFS mount produce a load average of 30 on a box whose CPUs are completely idle.
The only rule that matters: divide by core count
Load average counts tasks, not cores, so the raw value needs a denominator before it means anything.
nproc8nproc reports logical cores, hyperthreads included, and that is the right denominator because the scheduler treats every logical CPU as a slot where a task can run. On older systems without nproc, getconf _NPROCESSORS_ONLN returns the same figure.
This one line does the division for you:
awk -v c="$(nproc)" '{printf "1m %.2f 5m %.2f 15m %.2f per core\n", $1/c, $2/c, $3/c}' /proc/loadavg1m 0.43 5m 0.36 15m 0.27 per coreLoad per core: what each range means
| Load per core | Reading | What I do about it |
|---|---|---|
| Below 0.70 | Spare capacity on every core | Nothing |
| 0.70 to 1.00 | Busy, approaching fully committed | Open a capacity planning ticket |
| 1.00 to 2.00 | Tasks are queueing, tail latency rising | Find the saturated resource today |
| 2.00 to 4.00 | Sustained oversubscription, response times degrade visibly | Warn if it holds 30 minutes, and page only if it climbs above 4.00 for 15 minutes |
| Above 4.00 | Severe, even SSH logins feel slow | Treat it as an outage |
The 0.70 threshold is a convention, not a kernel constant. It is simply the point where a queue starts forming often enough to be visible in p95 latency.
The same load number on three different machines
| Logical cores | Load 2 | Load 8 | Load 32 |
|---|---|---|---|
| 2 | 1.00 per core, fully committed | 4.00, severe | 16.00, emergency |
| 8 | 0.25, healthy | 1.00, fully committed | 4.00, severe |
| 32 | 0.06, idle | 0.25, healthy | 1.00, fully committed |
One number, three different verdicts. This is why a fleet-wide rule such as "alert when load exceeds 10" fires constantly on the small nodes and stays silent while the large ones are drowning. Scale the threshold by core count, or accept that you have built a false positive generator.
High load with low CPU usage means I/O, not CPU
When load climbs and CPU utilization stays low, the D state tasks are doing it. Start with top and look at the wa field on the %Cpu(s) line, which is the percentage of wall clock time CPUs spent idle with at least one outstanding I/O request.
top - 15:42:11 up 37 days,  4:19,  2 users,  load average: 3.42, 2.91, 2.14
Tasks: 214 total,   2 running, 212 sleeping,   0 stopped,   0 zombie
%Cpu(s):  4.2 us,  1.1 sy,  0.0 ni, 21.3 id, 73.1 wa,  0.0 hi,  0.3 si,  0.0 st
4.2% user time against 73.1% iowait is a storage problem wearing a CPU problem's clothes. Press 1 inside top to break the line out per CPU, which matters when a single core is pinned by an interrupt handler.
vmstat 1 5 adds the piece top leaves out. Its r column counts runnable tasks and its b column counts tasks blocked in uninterruptible sleep, so r plus b is roughly the instantaneous value the load average is smoothing. When b sits well above r, the load you are looking at is blocked tasks rather than CPU demand.
From that point it is a storage investigation rather than a load investigation: name the blocked tasks with ps -eo state,pid,comm | awk '$1 == "D"', then confirm at the device level with iostat -x 1 3 and read r_await, w_await and aqu-sz. The full walkthrough, with sample output and the split between throughput bound and IOPS bound workloads, is in high iowait on Linux. For the underlying counters, see disk I/O.
If wa is near zero and the load is still high, look for lock contention in the kernel, a saturated network filesystem, or a driver stuck on a failing device. dmesg -T | tail -50 usually shows the hardware side of that story.
Where to read load average: uptime, /proc/loadavg, top
/proc/loadavg is the raw source, and it carries two fields that uptime throws away.
cat /proc/loadavg3.42 2.91 2.14 2/487 30219| Field | Value | Meaning |
|---|---|---|
| 1 to 3 | 3.42 2.91 2.14 | 1, 5 and 15 minute load averages |
| 4 | 2/487 | Currently runnable scheduling entities over total entities |
| 5 | 30219 | PID of the most recently created process |
The fourth field is the useful one. A load of 3.42 with 2/487 in that slot tells you only two tasks are actually runnable, so the rest of the load is blocked I/O. That is a diagnosis in a single cat.
For history rather than the current instant, sar -q replays what the sysstat collector recorded. On Debian and Ubuntu, collection is off until you set ENABLED="true" in /etc/default/sysstat.
sar -q15:40:01 runq-sz plist-sz ldavg-1 ldavg-5 ldavg-15 blocked
15:50:01 1 487 3.42 2.91 2.14 14The blocked column is the D state count over time, which is the fastest way to prove that a past incident was storage and not compute.
What load average will not tell you
It has no unit and no target. It cannot separate CPU pressure from I/O pressure. It is damped, so a 20 second stall barely moves the 1 minute figure. And it is a whole-host number, which trips up anyone reading it inside a container: /proc/loadavg is not namespaced, so a process in a container sees the load of the entire host, including every neighbour on that box.
On kernels 4.20 and newer, pressure stall information gives you the signal load average was reaching for, split by resource and expressed as a percentage of time work was delayed.
cat /proc/pressure/iosome avg10=68.31 avg60=61.02 avg300=44.17 total=1841203119
full avg10=51.44 avg60=47.90 avg300=33.88 total=1402881766some is the share of time at least one task was stalled on I/O, full is the share where every runnable task was stalled. If the files are missing, your kernel needs CONFIG_PSI and, on some distributions, the psi=1 boot parameter.
Tracking load average across a fleet with Hyperping
Reading load on one box during an incident is the easy part. The hard part is having 1, 5 and 15 minute values already recorded for every host, next to the core count, when someone asks what happened at 03:12.
The Hyperping agent installs in one line and starts reporting on a 30 second cadence:
curl -fsSL https://hyperping.com/install.sh | sh -s HP_INSTALL_xxxxxIt collects the three load averages, the logical core count, per-state CPU time including iowait, memory, filesystem usage per mount point, disk read and write bytes per device, and network bytes per interface, along with the usual host metrics such as kernel version, CPU model and boot time. The full list is in metrics collected. Because the agent reports that core count alongside the load averages, load per core is a division you have the numbers for without hunting for them.
Three things I would set up on day one:
- Load read per core rather than raw, so one reading means the same thing on a 2 core VM and on a 64 core database host.
- iowait charted next to it, so a load spike arrives already labelled as storage or compute.
- Agent liveness alerting. Hyperping's server alerting fires on liveness rather than on resource thresholds: when metrics stop, the host goes Stale in the UI, then Offline past its offline threshold, which opens an outage and pages your escalation policy. That catches the case where the machine got so loaded that the agent itself stopped reporting. A numeric load-per-core rule belongs in your own alerting layer, built on the history the agent records.
Agent-based server monitoring covers the inside of the host. Pair it with external uptime checks so you also know whether users could reach the service while the load was climbing. The full host-level setup, from install to which numbers are worth a page, is in the Linux server monitoring guide. If you are running containerized workloads, the Kubernetes monitoring guide covers the cluster layer, and the roundup of server performance monitoring tools compares the agents themselves.
The short version
Never read a load average without nproc next to it. Divide, and 0.70 per core is where you start paying attention, 1.00 is fully committed, above 2.00 you are shipping latency to users. Then check the wa figure and the fourth field of /proc/loadavg before you assume you need more CPU, because most of the alarming load averages I have chased turned out to be a disk, an NFS server, or a database flushing harder than the storage could take.
FAQ
What is a good load average on Linux? ▼
There is no single good number, because load average counts tasks and not cores. Divide the load by the logical core count from nproc. Below 0.70 per core the machine has spare capacity, 1.00 per core means it is fully committed, and above 2.00 per core work is queueing long enough to show up in response times.
Why is my load average high but CPU usage low? ▼
Linux counts tasks in uninterruptible sleep (D state) in the load average, not just tasks waiting for CPU. Those are almost always threads blocked on disk, on an NFS mount, or on a kernel lock. Check the wa column in top or vmstat, and list D state processes with ps. A stuck NFS mount can push load to 30 on an otherwise idle box.
What is the difference between the 1, 5 and 15 minute load averages? ▼
They are three exponentially damped moving averages of the same run queue sample, weighted so that recent samples dominate over roughly 1, 5 and 15 minutes. None of them is a clean window, so the 1 minute figure still carries a fading contribution from earlier. Read them in order: rising left to right means recovery, falling left to right means the machine is getting busier.
How do I check load average per CPU core? ▼
Get the logical core count with nproc, then divide each of the three values in /proc/loadavg by it. One command does both: awk -v c="$(nproc)" '{printf "%.2f %.2f %.2f\n", $1/c, $2/c, $3/c}' /proc/loadavg. Use logical cores, including hyperthreads, since the scheduler treats each one as a place to run a task.
Does load average work the same inside a container? ▼
No. /proc/loadavg is not namespaced, so a process inside a Docker container reads the load average of the whole host, including work from every other container on that host. Use per-container CPU accounting from cgroups if you need a figure scoped to the container, and treat load average as a host-level signal.
Is load average a percentage? ▼
No. It is a count of tasks, so it has no upper bound and a value above 1.00 is normal on multi-core machines. A load of 8 is 100% committed on an 8 core host and 400% oversubscribed on a 2 core host. Percentages come from CPU utilization, which is a separate metric.