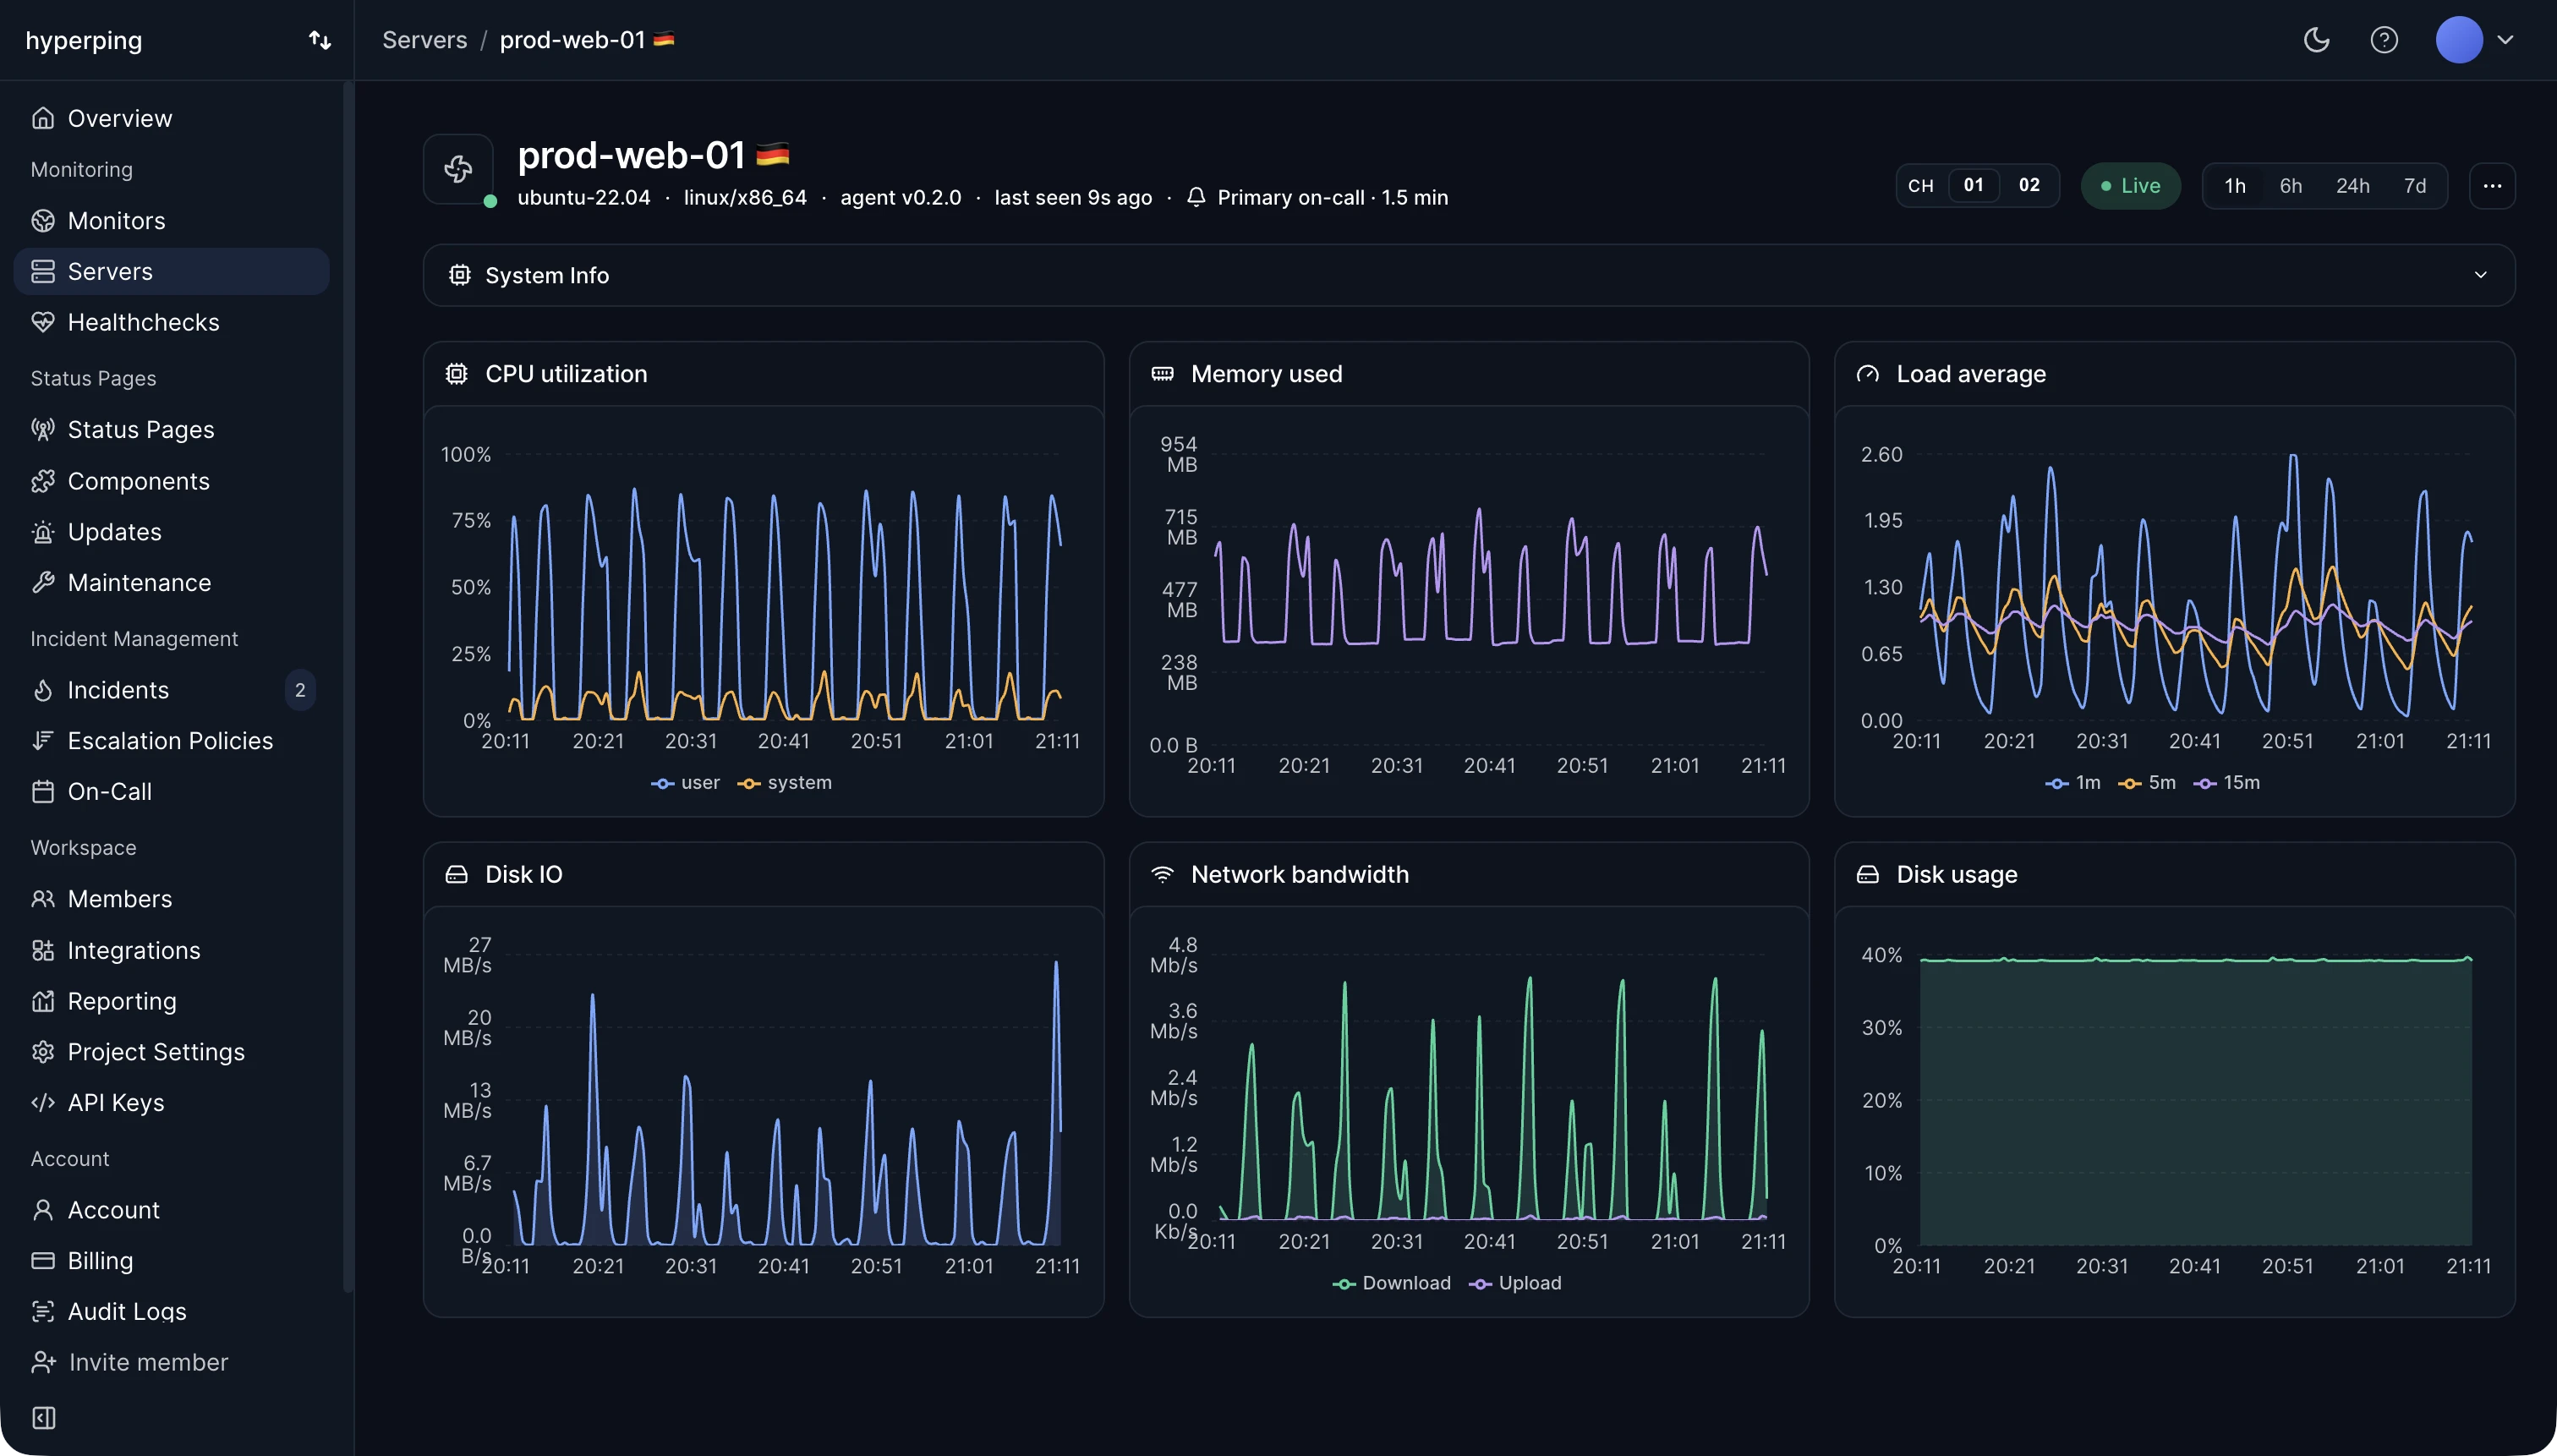
Hyperping's server agent ships the full set of host metrics every 30 seconds, using the metric names of the OpenTelemetry hostmetrics receiver, so system.cpu.time or system.memory.usage means the same thing in Hyperping as in any other tool that follows the convention. History stays comparable even if you change collectors later.
Metrics included
- CPU time per state (user, system, iowait) and the 1, 5, and 15-minute load averages.
- Memory used, available, and total.
- Used and free space for each mounted filesystem.
- Bytes read and written per block device.
- Bytes in and out per network interface.
- Host details: hostname, OS, kernel, architecture, CPU model, and boot time.
Limits of host metrics
A host metrics agent describes the machine, not what runs on it. It doesn't break usage down by process, container, or pod, and it carries no request traces, logs, or application spans. That boundary keeps the data cheap, low in cardinality, and consistent across every host in a fleet, which is what makes it dependable for alerting and capacity planning. For per-request detail, you need application performance monitoring.
Host metrics and black-box checks
Host metrics are white-box signals: they come from inside the system and explain why something is slow. Black-box checks probe from the outside and tell you whether users are affected. A host can look healthy while its DNS record is gone, and an uptime check can pass while the disk fills toward an outage tomorrow. Run both on the same services.
FAQ
What is the difference between host metrics and application metrics?
Host metrics describe the machine's resources. Application metrics describe what the software does: requests per second, error rate, queue length, latency per endpoint. A memory problem shows in host metrics, a slow endpoint in application metrics.
How often should host metrics be collected?
Every 10 to 60 seconds. Every 30 seconds catches short spikes without making storage expensive.
Do I need an agent to collect host metrics?
For the full set, yes. Cloud providers expose some metrics from outside (CPU, network), but not memory or disk space per filesystem. See agent-based monitoring.