Monitoring your Kubernetes clusters is critical for maintaining reliable applications. But with so many metrics to track and tools to choose from, setting up effective monitoring can feel overwhelming.
The Cloud Native Computing Foundation (CNCF) reports record Kubernetes adoption, with 84% of organizations using containers in production, underscoring the growing need for robust monitoring solutions.
Search for "Kubernetes monitoring" and you'll find a sea of contradicting information, countless tools, and complex setups. It's hard to know where to start or which metrics actually matter for your specific environment.
In this guide, we'll cut through the noise and give you a clear path to monitoring your Kubernetes infrastructure effectively, including:
- The most important Kubernetes metrics to track
- Top monitoring tools for different use cases
- Best practices that modern DevOps teams are using
- Common mistakes to avoid
- Advanced techniques to take your monitoring to the next level
- How to maintain your monitoring setup over time
TL;DR:
- Monitor across all layers: Track metrics at cluster, node, pod, and application levels for complete visibility
- Combine internal and external tools: Use Prometheus/Grafana for internal metrics and external monitoring like Hyperping for user-facing validation
- Avoid common pitfalls: Don't ignore ephemeral workloads, overload systems with data, or create alert fatigue
- External monitoring matters: Internal tools show cluster health, but external monitoring confirms actual user availability
What Kubernetes metrics should you measure?
Kubernetes metrics are data points that provide insights into the health and performance of your cluster. Effective monitoring requires tracking metrics at multiple levels: cluster, node, pod, container, and application. Understanding your SLIs, SLOs, and SLAs is crucial here.
Here's a breakdown of the most important metrics at each level:
Essential Kubernetes metrics by layer
| Layer | Metric Category | Key Metrics | Why It Matters | Alert Threshold Example |
|---|---|---|---|---|
| Cluster | Resource Utilization | CPU/memory utilization, node count, pod count | Shows overall capacity and scaling needs | >80% CPU utilization |
| Cluster | Control Plane | API server latency, etcd health | Indicates control plane stability | >500ms API latency |
| Node | Resource Usage | CPU/memory per node, disk I/O, network throughput | Identifies overloaded or failing nodes | >90% memory on any node |
| Node | Availability | Node uptime, kubelet health | Ensures infrastructure reliability | Node down >5 minutes |
| Pod | Lifecycle | Pod restarts, status, probe failures | Reveals application stability issues | >3 restarts in 10 minutes |
| Pod | Resource Efficiency | Requests vs. actual usage | Helps optimize resource allocation | 50% under/over provisioned |
| Application | Performance | Request latency, error rates, throughput | Measures user experience | >5% error rate |
| Application | Saturation | Queue depth, connection pools | Shows service capacity limits | Queue >100 items |
Cluster-level metrics
These metrics give you a bird's-eye view of your entire Kubernetes cluster:
- Cluster CPU and memory utilization: Helps determine if your cluster has adequate resources
- Node count: Shows the total number of nodes in your cluster
- Pod count: Tracks the total number of pods running in your cluster
- API server latency and error rate: Critical for detecting control plane issues
- etcd metrics: Monitors the health of your cluster's state store
Node-level metrics
Node metrics help you understand the health of individual worker nodes:
- CPU and memory usage per node: Identifies overloaded nodes
- Disk I/O and network throughput: Reveals potential bottlenecks
- Node uptime and availability: Shows node stability
- Kubelet health: Ensures the Kubernetes agent on each node is functioning
Pod-level metrics
These metrics help you understand the health and behavior of your pods:
- Pod restarts: Frequent restarts indicate application problems
- Pod status (Running, Pending, Failed): Shows the current state of pods
- Readiness/liveness probe failures: Reveals application health issues
- CrashLoopBackOff and OOMKilled events: Indicates serious application problems
- Pod resource requests vs. actual usage: Helps with right-sizing
The Golden Signals: Google's Site Reliability Engineering (SRE) practices define four "Golden Signals" to monitor in any system: Latency (how long requests take), Traffic (demand on your system), Errors (rate of failed requests), and Saturation (how "full" your service is). These signals apply perfectly to Kubernetes application monitoring and should guide your metric selection.
Application-level metrics
These metrics focus on the actual applications running in your Kubernetes environment:
- Request latency: Time taken to process requests
- Error rates: Percentage of failed requests
- Throughput: Number of requests processed per second
- Saturation: How "full" your service is (e.g., queue depth)
Collecting metrics across all these layers gives you a complete picture of your Kubernetes environment's health and performance. The next challenge is choosing the right tools to collect and visualize these metrics.
Top 5 Kubernetes monitoring tools
There are dozens of tools for monitoring Kubernetes, but these five stand out as the most widely used and effective options. Each has its strengths and ideal use cases:
Kubernetes monitoring tools: Quick comparison
| Tool | Type | Best For | Deployment Complexity | Cost Model | Integration Ease |
|---|---|---|---|---|---|
| Prometheus | Open-source metrics DB | High-cardinality environments, custom metrics | Medium | Free (infrastructure costs) | High (native K8s support) |
| Grafana | Open-source visualization | Multi-source dashboards, real-time visualization | Low-Medium | Free (infrastructure costs) | High (many data sources) |
| Datadog | Commercial platform | Full-stack observability, large deployments | Low | Usage-based (expensive) | Very High (pre-built integrations) |
| Kubernetes Dashboard | Native K8s UI | Quick status checks, basic monitoring | Very Low | Free (included) | Native |
| Fluentd | Open-source log aggregator | Centralized logging, ephemeral workloads | Medium | Free (infrastructure costs) | High (many output plugins) |
| Hyperping | Commercial external monitoring | User-facing availability, status pages | Very Low | Subscription-based | High (API & webhooks) |
1. Prometheus
Description: An open-source time-series database with native Kubernetes integration and a powerful query language (PromQL).
Best for: High-cardinality environments and custom metric collection. It's a cornerstone for many DevOps workflows.
| Pros | Cons |
|---|---|
| Designed for Kubernetes from the ground up | Steep learning curve |
| Highly extensible with a huge ecosystem of exporters | Limited visualization capabilities without Grafana |
| Pull-based model works well with dynamic Kubernetes environments | Can be resource-intensive at scale |
| Strong community support | Lacks built-in long-term storage |
2. Grafana
Description: A visualization tool that integrates with Prometheus and other data sources to create beautiful, comprehensive dashboards.
Best for: Real-time dashboards and visualizations across multiple data sources.
| Pros | Cons |
|---|---|
| Supports multiple data sources (Prometheus, Loki, Elasticsearch, etc.) | Requires integration with data collection tools |
| Highly customizable dashboards | Can be complex to set up for beginners |
| Free and open-source | Dashboard management can become unwieldy at scale |
| Strong community with many pre-built dashboards |
3. Datadog
Description: A comprehensive commercial observability platform for applications, logs, and infrastructure.
Best for: Full-stack observability in large-scale or multi-cloud deployments. If you're looking for alternatives, check out our best Datadog alternatives guide.
| Pros | Cons |
|---|---|
| AI-powered anomaly detection | Expensive for large infrastructures |
| Pre-built Kubernetes templates and dashboards | Can become costly as data volume increases |
| Centralizes monitoring for hybrid environments | Some features might be overkill for smaller teams |
| Combines metrics, logs, and traces in one platform |
4. Kubernetes Dashboard
Description: The native Kubernetes UI for lightweight monitoring and management.
Best for: Quick visual updates on resource usage and performance metrics.
Official Guidance: The Kubernetes official documentation provides comprehensive guidance on monitoring, logging, and debugging approaches using built-in tools. The Kubernetes Dashboard is part of this native toolset and works seamlessly with RBAC and other cluster features.
| Pros | Cons |
|---|---|
| Free and included with Kubernetes | Lacks advanced features like alerting or historical analysis |
| Simple UI for basic monitoring needs | Limited customization options |
| Low resource footprint | Not designed for long-term monitoring |
| Built-in authentication with Kubernetes RBAC | Basic visualizations compared to specialized tools |
5. Fluentd
Description: An open-source log aggregation tool with strong Kubernetes compatibility.
Best for: Centralized log collection and processing from ephemeral Kubernetes pods.
| Pros | Cons |
|---|---|
| Lightweight resource footprint | Requires configuration to handle high-cardinality logs effectively |
| Supports multiple outputs (Elasticsearch, Loki, etc.) | Focuses on logs rather than metrics (often used alongside Prometheus) |
| Highly customizable via plugins | Can be complex to configure for specific use cases |
| CNCF graduated project with excellent community support |
6. Hyperping
Description: An uptime monitoring and status page platform that complements your internal Kubernetes monitoring.
Best for: External monitoring of Kubernetes applications and communicating system status to end users.
| Pros | Cons |
|---|---|
| Provides external validation of application availability | Focuses on external monitoring rather than internal Kubernetes metrics |
| Monitors from multiple global locations | Requires separate setup from your internal monitoring tools |
| Integrates monitoring results with automated status pages | |
| Supports various check types including HTTP, browser, cron jobs, SSL, and ports | |
| Code-based synthetic monitoring using Playwright |
5-step quick start guide for Kubernetes monitoring
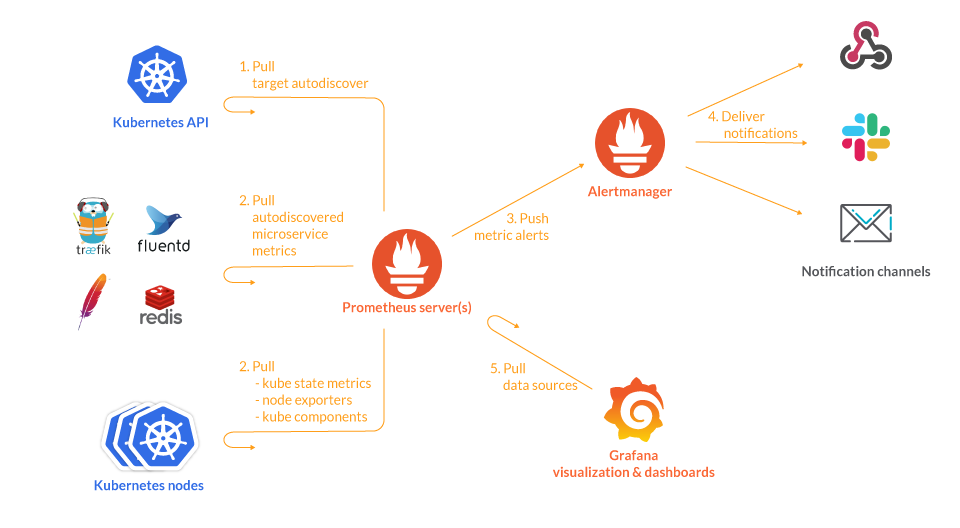
- Deploy Prometheus and Grafana: Use Helm charts to install the kube-prometheus-stack for immediate metrics collection and visualization
- Configure service discovery: Enable Kubernetes service discovery in Prometheus to automatically detect and monitor new pods
- Set up basic dashboards: Import community Grafana dashboards for Kubernetes cluster overview, node metrics, and pod metrics
- Implement log aggregation: Deploy Fluentd as a DaemonSet to collect logs from all nodes and forward to your chosen destination
- Add external monitoring: Configure uptime monitoring checks with Hyperping to validate user-facing availability
For most Kubernetes environments, a combination of these tools provides the most comprehensive monitoring solution. For example, many teams use Prometheus and Grafana for metrics, Fluentd for logs, and Hyperping for external monitoring and status pages.
Kubernetes monitoring best practices
TL;DR: Effective Kubernetes monitoring requires a comprehensive, multi-layered approach that covers your entire stack from infrastructure to applications. Automation ensures consistency across environments while security measures protect sensitive monitoring data. External monitoring validates that users can actually reach your services, providing the outside-in perspective that internal tools cannot offer. Combined with strategic alerting, proper labeling, and optimization techniques, these practices create a monitoring system that catches issues early and supports rapid troubleshooting.
Following these best practices will help you establish an effective Kubernetes monitoring strategy:
Benefits of following these practices:
- Faster incident detection and resolution
- Reduced mean time to recovery (MTTR)
- Better resource utilization and cost optimization
- Improved system reliability and uptime
- Enhanced visibility across your entire infrastructure
- More efficient troubleshooting and root cause analysis
1. Monitor all layers of your stack
Effective Kubernetes monitoring requires visibility at multiple levels. Set up monitoring for your:
- Infrastructure (nodes, network)
- Kubernetes components (control plane, kubelet)
- Containerized applications
- External dependencies
This multi-layer approach helps you quickly identify where problems originate.
2. Use consistent labeling and tagging
Labels and tags make it easier to filter and group related resources. Develop a consistent labeling strategy for:
- Applications and services
- Environments (prod, staging, dev)
- Teams or owners
- Criticality levels
Well-structured labels simplify querying and alerting across your entire cluster. The Prometheus best practices guide provides authoritative guidance on naming conventions and metric design patterns that ensure your monitoring data remains manageable and meaningful.
3. Automate monitoring configurations
Use tools like Helm charts, Operators, or GitOps practices to automate the deployment and configuration of your monitoring stack. This ensures consistency across clusters and environments.
| Phase | Timeline | Actions | Tools Needed | Success Criteria |
|---|---|---|---|---|
| Foundation | Week 1 | Install Prometheus & Grafana via Helm, configure service discovery | Helm, kubectl | Metrics collecting from all pods |
| Visualization | Week 1-2 | Import/customize dashboards, set up data sources | Grafana, community dashboards | Team can view key metrics |
| Alerting | Week 2-3 | Define alert rules, configure notification channels | Prometheus Alertmanager, PagerDuty/Slack | Alerts firing and routing correctly |
| Logging | Week 3-4 | Deploy Fluentd, configure log forwarding | Fluentd, log backend (Loki/Elasticsearch) | Logs centralized and searchable |
| External Monitoring | Week 4 | Set up external checks and status pages | Hyperping or similar | User-facing endpoints monitored externally |
| Optimization | Ongoing | Tune retention, optimize queries, refine alerts | All monitoring tools | Reduced false positives, manageable data volume |
For example, deploy Prometheus and Grafana using Helm:
helm repo add prometheus-community https://prometheus-community.github.io/helm-charts
helm install prometheus prometheus-community/kube-prometheus-stack
4. Optimize high-cardinality data
Understanding Cardinality Explosion: Cardinality refers to the number of unique combinations of metric labels. High-cardinality metrics (those with many unique label combinations like user IDs, request IDs, or IP addresses) can overwhelm your monitoring system, consuming excessive memory and slowing queries. A single metric with just 5 labels, each with 10 possible values, creates 100,000 unique time series. Managing cardinality is essential for maintaining monitoring system performance at scale.
High-cardinality metrics (those with many unique label combinations) can overwhelm your monitoring system. Mitigate this by:
- Using downsampling for historical data
- Setting appropriate retention policies
- Limiting the number of labels on high-volume metrics
- Using recording rules for frequently queried expressions
5. Implement secure monitoring practices
Strengthen your monitoring security by:
- Encrypting metrics and logs in transit and at rest
- Implementing RBAC for your monitoring tools
- Auditing API requests to monitoring endpoints
- Regularly updating your monitoring stack components
6. Set up proactive external monitoring
Internal vs. external monitoring: What each detects
| Monitoring Type | What It Detects | What It Misses | Best Tools | Use Cases |
|---|---|---|---|---|
| Internal | Pod crashes, resource exhaustion, control plane issues, container health | Network/DNS issues outside cluster, regional outages, CDN problems, user experience issues | Prometheus, Grafana, Kubernetes Dashboard | Infrastructure health, resource optimization, internal troubleshooting |
| External | Service unavailability from user perspective, DNS failures, SSL certificate issues, regional outages, slow response times | Internal cluster problems, specific pod failures, resource constraints | Hyperping, Pingdom, synthetic monitoring tools | User-facing availability, SLA validation, global performance |
Complement your internal Kubernetes monitoring with external checks. Tools like Hyperping can monitor your applications from multiple global locations, providing an outside perspective on availability and performance.
External monitoring is particularly valuable for detecting issues that might not be visible from inside your cluster, such as network problems or DNS issues.
Common mistakes when setting up Kubernetes monitoring
Even experienced teams can fall into these common Kubernetes monitoring pitfalls. Learn how to avoid them:
1. Ignoring ephemeral workloads
Mistake: Failing to capture metrics from short-lived pods and jobs before they terminate.
Solution: Use a monitoring system designed for ephemeral workloads. Prometheus's pull model works well with short-lived pods when configured with the Kubernetes service discovery. For external validation of scheduled jobs, Hyperping's cron job monitoring can verify that your batch processes complete successfully.
2. Overloading monitoring systems with excessive data
The Cost of Downtime: According to Cutover's research on major incident management, IT downtime costs an average of $5,600 per minute. Overloading your monitoring systems with excessive, unfiltered data can delay incident detection and resolution, directly impacting this cost. Proper data management ensures your monitoring tools remain responsive when you need them most.
Mistake: Collecting too many metrics or logs without filtering, leading to performance issues and increased costs. This can be a common issue in complex serverless monitoring setups as well.
Solution: Implement intelligent filtering and sampling techniques:
- Filter out non-essential metrics and logs
- Use adaptive sampling for high-volume data
- Set appropriate retention periods based on data importance
- Aggregate metrics where detailed granularity isn't needed
3. Lack of unified observability
Mistake: Keeping metrics, logs, and traces in separate, unconnected systems, making troubleshooting difficult.
Solution: Implement a unified observability approach:
- Use tools that correlate metrics, logs, and traces
- Ensure consistent labeling across observability data
- Create dashboards that combine different data types
- Establish links between related alerts, metrics, and logs
4. Alert fatigue from too many notifications
Mistake: Setting up too many alerts or using inappropriate thresholds, leading to ignored notifications.
Solution: Develop a strategic alerting approach:
- Define clear severity levels for different types of issues
- Use alert grouping to reduce notification noise
- Implement dynamic thresholds based on historical patterns
- Leverage anomaly detection instead of static thresholds
- Route alerts to the right teams and channels. Dive deeper into DevOps alert management.
5. Focusing only on technical metrics
Mistake: Monitoring only technical metrics while ignoring business-impact metrics.
Solution: Include user experience and business metrics in your monitoring:
- Track application response times from the user perspective
- Monitor error rates on critical user journeys
- Set up synthetic transactions for key business flows
- Create dashboards that show business impact of technical issues
Advanced Kubernetes monitoring techniques
Once you've mastered the basics, these advanced techniques will take your Kubernetes monitoring to the next level:
1. Distributed tracing with Jaeger or OpenTelemetry
Distributed tracing helps you track requests as they flow through your microservices, making it easier to identify bottlenecks and failures.
Implementation steps:
- Install a tracing backend like Jaeger in your cluster:
kubectl create namespace observability
kubectl apply -f https://github.com/jaegertracing/jaeger-operator/releases/download/v1.41.0/jaeger-operator.yaml -n observability- Configure your applications to emit traces using OpenTelemetry SDKs
- Visualize traces in the Jaeger UI to identify performance issues
2. Service mesh integration with Istio
A service mesh like Istio provides deeper insights into microservice communication patterns and enables advanced traffic management.
Implementation steps:
- Install Istio in your cluster:
istioctl install --set profile=demo- Enable automatic sidecar injection for your namespaces:
kubectl label namespace default istio-injection=enabled- Configure Istio's telemetry features and integrate with Prometheus and Grafana
- Monitor traffic flows and service performance in the Istio dashboards
3. Custom resource metrics for autoscaling
Standard Horizontal Pod Autoscaler (HPA) only supports CPU and memory metrics. Advanced setups can use custom and external metrics.
Implementation steps:
- Install the Prometheus Adapter for Kubernetes metrics:
helm install prometheus-adapter prometheus-community/prometheus-adapter- Configure custom metric definitions based on your Prometheus queries
- Create HPAs that scale based on these custom metrics:
apiVersion: autoscaling/v2
kind: HorizontalPodAutoscaler
metadata:
  name: my-app-hpa
spec:
  scaleTargetRef:
    apiVersion: apps/v1
    kind: Deployment
    name: my-app
  minReplicas: 2
  maxReplicas: 10
  metrics:
    - type: External
      external:
        metric:
          name: http_requests_per_second
        target:
          type: AverageValue
          averageValue: 1000
4. Automated incident response with Hyperping and Kubernetes
Combine external monitoring with Kubernetes automation for faster incident resolution.
Implementation steps:
- Set up Hyperping checks for critical services
- Configure webhook notifications from Hyperping to your Kubernetes event processor
- Create Kubernetes jobs or pods that automatically run diagnostics when alerts fire
- Update your status page automatically based on check results
This advanced setup provides end-to-end automation from detection to diagnosis and communication. Establishing clear escalation policies is also key here.
Maintaining effective Kubernetes monitoring
Monitoring Maturity Model: Organizations typically progress through monitoring maturity stages: Reactive (basic alerts, manual response), Proactive (predictive alerts, some automation), Optimized (full observability, automated remediation), and Innovative (AI-driven insights, self-healing systems). Understanding your current maturity level helps prioritize improvements and set realistic goals for your monitoring evolution.
Setting up monitoring is just the beginning. Here's how to maintain effective monitoring over time:
1. Regularly audit dashboards and alert rules
Dashboards and alerts need to evolve as your applications change.
Practical steps:
- Schedule monthly reviews of dashboards and alerts
- Update thresholds based on historical trends
- Test alerts with simulated failures
- Remove unused or redundant dashboards
2. Centralize your observability data
Bringing metrics, logs, and traces together improves troubleshooting efficiency.
Practical steps:
- Integrate Prometheus/Grafana with your logging solution
- Use correlation IDs across logs and traces
- Create unified dashboards that show related data
- Implement links between monitoring systems
3. Scale your monitoring systems with your clusters
Your monitoring infrastructure needs to grow alongside your Kubernetes clusters.
Practical steps:
- Configure HPA for Prometheus, Grafana, and other monitoring components
- Optimize storage retention policies as data volumes increase
- Monitor the resource usage of your monitoring tools themselves
- Consider federated monitoring for multi-cluster setups
4. Keep external monitoring in sync with internal changes
As you deploy new services or modify existing ones, your external monitoring needs to stay in sync.
Practical steps:
- Update Hyperping checks when endpoints change
- Adjust monitoring thresholds when performance characteristics change
- Add new checks for new services
- Update status page components when service dependencies change
5. Document your monitoring setup
Good documentation ensures that everyone understands how monitoring works.
Practical steps:
- Document the metrics you collect and what they mean
- Create runbooks for common alerts
- Maintain a catalog of dashboards and their purposes
- Record the reasoning behind alert thresholds
Final thoughts
Effective Kubernetes monitoring is not just about having the right tools, it's about creating a cohesive strategy that evolves with your infrastructure.
The most successful teams take a layered approach, combining internal metrics with external validation, and foster a strong DevOps feedback loop.
The combination of internal monitoring tools like Prometheus and Grafana with external monitoring solutions like Hyperping gives you a complete picture of your system's health.
While internal tools tell you what's happening inside your cluster, external monitoring confirms that your services are actually available to users, which is what ultimately matters. Effective incident management best practices rely on this comprehensive view.
Related terms and definitions
| Term | Definition |
|---|---|
| Observability | The ability to understand system internal states by examining outputs (metrics, logs, traces). Goes beyond monitoring by enabling exploration and investigation. |
| Cardinality | The number of unique combinations of metric labels. High cardinality can strain monitoring systems and increase storage costs. |
| PromQL | Prometheus Query Language, used to query and analyze time-series data stored in Prometheus. |
| Service Mesh | Infrastructure layer that controls service-to-service communication, providing observability, traffic management, and security (e.g., Istio, Linkerd). |
| Distributed Tracing | Method of tracking requests as they flow through distributed systems, showing latency and dependencies across services. |
| SLI/SLO/SLA | Service Level Indicator (measurement), Objective (target), and Agreement (contract). Framework for defining and measuring reliability. |
| RBAC | Role-Based Access Control, Kubernetes security mechanism that regulates access to resources based on user roles. |
| Pod | Smallest deployable unit in Kubernetes, containing one or more containers that share storage and network resources. |
| Node | Worker machine (physical or virtual) in Kubernetes that runs containerized applications. Contains kubelet, container runtime, and kube-proxy. |
| Cluster | Set of nodes managed by Kubernetes, consisting of control plane components and worker nodes. |
| Control Plane | Set of components that manage the Kubernetes cluster, including API server, scheduler, and controller manager. |
| etcd | Distributed key-value store that holds all Kubernetes cluster state data. Critical component for cluster operation. |
| HPA | Horizontal Pod Autoscaler, automatically scales the number of pods based on observed metrics like CPU or custom metrics. |
| Synthetic Monitoring | Proactive monitoring using simulated user transactions to test system availability and performance. |
| External Monitoring | Monitoring from outside your infrastructure to validate user-facing availability and detect network/DNS issues. |
Frequently asked questions about Kubernetes monitoring
Why is monitoring my Kubernetes cluster so important?
Monitoring ensures early detection of issues like resource bottlenecks or application failures before they escalate into outages. In Kubernetes environments, the dynamic nature of container orchestration makes monitoring especially critical for maintaining reliability.
What are the key metrics I should be monitoring?
Key requirements for effective Kubernetes monitoring
- Multi-layer visibility: Coverage across cluster, node, pod, and application levels
- Time-series database: System capable of storing and querying metrics over time (e.g., Prometheus)
- Service discovery: Automatic detection of new pods and services as they're created
- Alert management: Framework for defining, routing, and managing alerts based on metric thresholds
- Visualization platform: Dashboards to make metrics understandable (e.g., Grafana)
- Log aggregation: Centralized log collection from ephemeral pods
Start with these critical metrics:
- CPU and memory usage at cluster and node levels
- Pod restarts and crashes
- API server latency and errors
- Application request latency and error rates
- Container resource usage vs. requests/limits
As your monitoring matures, expand to more specialized metrics based on your specific applications and infrastructure.
Which tools are essential for Kubernetes monitoring?
A complete monitoring solution typically includes:
- Prometheus for metrics collection
- Grafana for visualization
- Fluentd or similar for logs
- A distributed tracing solution like Jaeger
- An external monitoring tool like Hyperping for outside-in validation
Small teams might start with just Prometheus and Grafana, adding other components as they grow.
How can I ensure my monitoring doesn't miss critical issues?
Implement multiple layers of monitoring:
- Internal metrics monitoring with Prometheus
- Log analysis for deeper debugging
- External uptime monitoring with Hyperping
- Synthetic transactions for key user flows
- Distributed tracing for request flows
This multi-faceted approach ensures you catch issues from different angles.
How do I balance comprehensive monitoring with resource usage?
Focus on high-value metrics first:
- Filter out non-essential metrics
- Use appropriate retention periods
- Sample high-volume data
- Optimize queries and dashboards
- Scale monitoring infrastructure based on demand
Start small and expand your monitoring as you identify specific needs.
How can I make my status pages more effective?
Status pages should provide clear, timely information to users:
- Integrate your monitoring tools (like Hyperping) to automatically update status
- Group services logically based on user impact
- Provide detailed but understandable incident updates using incident communication templates
- Include historical uptime information
- Allow users to subscribe to updates for services they care about
Hyperping's status page features make this easy with automatic updates based on monitoring results and custom domains for branded experiences. You can also explore various status page templates or find the best status page software for your needs.
How often should I review and update my monitoring setup?
For most organizations:
- Weekly reviews of recent alerts to identify false positives
- Monthly audits of dashboards and alerting rules
- Quarterly comprehensive reviews of the entire monitoring strategy
- Real-time updates when deploying new services
Larger organizations with dedicated SRE teams might perform these reviews more frequently.
By implementing the strategies in this guide, you'll create a robust Kubernetes monitoring system that helps maintain reliable applications while providing clear visibility when issues arise. Remember that effective monitoring is an ongoing process that evolves with your infrastructure and applications. Consider this part of your overall DevOps project management and continuous testing strategy.
FAQ
What are the most important Kubernetes metrics to monitor? ▼
The most important Kubernetes metrics to monitor include: cluster-level metrics (CPU/memory utilization, node count, API server latency), node-level metrics (CPU/memory usage per node, disk I/O, network throughput), pod-level metrics (pod restarts, status, probe failures), and application-level metrics (request latency, error rates, throughput). An effective monitoring strategy covers all these layers to provide a complete picture of your Kubernetes environment.
Which tools are best for Kubernetes monitoring? ▼
Top Kubernetes monitoring tools include: Prometheus (for metrics collection), Grafana (for visualization), Datadog (for comprehensive commercial observability), Kubernetes Dashboard (for native lightweight monitoring), Fluentd (for log aggregation), and Hyperping (for external monitoring and status pages). Most organizations use a combination of these tools based on their specific needs and environment complexity.
What are the best practices for Kubernetes monitoring? ▼
Kubernetes monitoring best practices include: monitoring all layers of your stack, using consistent labeling and tagging, automating monitoring configurations, optimizing high-cardinality data, implementing secure monitoring practices, and setting up proactive external monitoring. This multi-layered approach helps quickly identify where problems originate and ensures comprehensive visibility.
What common mistakes should I avoid when monitoring Kubernetes? ▼
Common Kubernetes monitoring mistakes include: ignoring ephemeral workloads, overloading monitoring systems with excessive data, lack of unified observability across metrics/logs/traces, creating alert fatigue from too many notifications, and focusing only on technical metrics while ignoring business impact. Avoiding these pitfalls will help create a more effective monitoring strategy.
How can I implement advanced Kubernetes monitoring techniques? ▼
Advanced Kubernetes monitoring techniques include: implementing distributed tracing with Jaeger or OpenTelemetry, integrating service mesh monitoring with Istio, using custom resource metrics for autoscaling, and automating incident response by connecting external monitoring tools with Kubernetes automation. These techniques provide deeper insights and more sophisticated responses to incidents.
How do I maintain effective Kubernetes monitoring over time? ▼
To maintain effective Kubernetes monitoring: regularly audit dashboards and alert rules, centralize your observability data, scale your monitoring systems alongside your clusters, keep external monitoring in sync with internal changes, and thoroughly document your monitoring setup. Monitoring should evolve with your infrastructure to remain relevant and effective.
Why is external monitoring important for Kubernetes applications? ▼
External monitoring is crucial because it provides an outside perspective on availability and performance that might not be visible from inside your cluster. Tools like Hyperping can monitor your applications from multiple global locations, detecting issues such as network problems, DNS issues, or regional outages that internal monitoring might miss. External monitoring confirms that your services are actually available to users, which is what ultimately matters.
How should I approach alerting for Kubernetes environments? ▼
Develop a strategic alerting approach by: defining clear severity levels for different types of issues, using alert grouping to reduce notification noise, implementing dynamic thresholds based on historical patterns, leveraging anomaly detection instead of static thresholds, and routing alerts to the appropriate teams and channels. This helps prevent alert fatigue while ensuring critical issues get proper attention.
What's the relationship between monitoring and autoscaling in Kubernetes? ▼
Monitoring provides the metrics needed for effective autoscaling. While standard Horizontal Pod Autoscaler (HPA) supports CPU and memory metrics, advanced setups can use custom and external metrics through the Prometheus Adapter. This enables autoscaling based on application-specific metrics like request rate, queue length, or custom business metrics, allowing more intelligent resource allocation.
How can I create effective status pages for my Kubernetes applications? ▼
Effective status pages should provide clear, timely information to users. Integrate your monitoring tools (like Hyperping) to automatically update status, group services logically based on user impact, provide detailed but understandable incident updates, include historical uptime information, and allow users to subscribe to updates. This transparency helps maintain user trust even when issues occur.