The Linux OOM killer is the kernel routine that picks a process and sends it SIGKILL when the machine, or a cgroup, runs out of memory it can reclaim. To find what it killed, run sudo dmesg -T | grep -iE "out of memory|killed process", or journalctl -k if the server has rebooted since. The line names the victim, its PID and how much memory it held. This guide covers reading that report, the oom_score math that decided who died, the configuration that changes the outcome (overcommit, swap, systemd, cgroups, Docker and Kubernetes limits), and how to stop it happening again.
Key takeaways
- The kernel logs every OOM kill as
Out of memory: Killed process <pid> (<name>), orMemory cgroup out of memorywhen a cgroup limit was hit rather than the whole machine. - The process named in
invoked oom-killeris the one whose allocation failed, not necessarily the one that was killed. Read theKilled processline for the victim. dmesgis lost on reboot.journalctl -k -b -1reads the previous boot only if the journal is persistent, which Ubuntu enables by default and some minimal images do not.- Exit code 137 means
SIGKILL. In Docker and Kubernetes,OOMKilledmeans the container hit its own limit, even when the host had memory to spare. - The kernel log is a snapshot of the moment of death. To tell a leak from a spike you need the memory curve from the hours before, which only continuous host metrics give you.
What is the OOM killer, and when does it fire?
Linux hands out memory optimistically. A malloc() of 2 GB usually succeeds straight away, because the kernel only backs pages with real RAM when the program first writes to them. This is overcommit, and it works because most programs never touch everything they reserve.
Trouble starts when too many processes touch their memory at once. The kernel first tries to reclaim: it drops clean page cache, writes dirty pages to disk, and pushes cold anonymous memory to swap if there is any. When a page fault still cannot be satisfied after reclaim fails, the kernel calls out_of_memory(), scores every eligible process, and kills the highest scorer.
There are two scopes to keep apart:
| Scope | What ran out | Log line | Typical trigger |
|---|---|---|---|
| Global | RAM plus swap for the whole host | Out of memory: Killed process |
A leak, a traffic spike, too many workers |
| cgroup | The memory limit of one unit or container | Memory cgroup out of memory: Killed process |
systemd MemoryMax=, docker run --memory, a Kubernetes limit |
A cgroup OOM only kills inside that cgroup. It is the reason a container can die with OOMKilled while free -h on the host shows gigabytes available.
Before the kill, there is often a stretch where the machine is technically alive but unusable: the kernel keeps evicting and reloading the same pages, disk reads climb, SSH takes a minute to answer, and load average shoots up. On servers without swap this phase is shorter, because anonymous memory cannot be evicted at all and only page cache is left to squeeze.
How to find what the OOM killer killed
Check the kernel ring buffer with dmesg
On a machine that has not rebooted since the event, start here.
sudo dmesg -T | grep -iE "out of memory|killed process|invoked oom-killer"[Mon Sep 28 03:14:21 2026] nginx invoked oom-killer: gfp_mask=0x140cca(GFP_HIGHUSER_MOVABLE|__GFP_COMP), order=0, oom_score_adj=0
[Mon Sep 28 03:14:21 2026] Out of memory: Killed process 3012 (node) total-vm:12962072kB, anon-rss:7200640kB, file-rss:8216kB, shmem-rss:0kB, UID:1000 pgtables:14848kB oom_score_adj:0Read it in this order:
Killed process 3012 (node)is the victim. Here it was a Node.js API.anon-rss:7200640kBis the memory it was holding that could not be reclaimed, about 6.9 GB on an 8 GB host. That is the process responsible for most of the pressure.nginx invoked oom-killeronly means nginx asked for a page at the moment nothing was left. The process that triggers the OOM killer is often a bystander.oom_score_adj:0tells you nobody had tuned the victim's priority.
Older kernels print the same event as Out of memory: Kill process 3012 (node) score 912 or sacrifice child followed by a separate Killed process line. The case-insensitive killed process pattern matches both.
dmesg needs sudo on Debian and Ubuntu, where kernel.dmesg_restrict=1 is the default. Two limits: the ring buffer is cleared on reboot and can wrap on a chatty host, and -T timestamps can drift on machines that have been suspended, which matters on VMs that were paused.
Read the kernel journal with journalctl
On any systemd distribution, the journal keeps kernel messages alongside everything else.
# This boot, last 24 hours
sudo journalctl -k --since "24 hours ago" | grep -iE "out of memory|killed process"

# The previous boot, when the OOM event ended in a crash or a reboot
sudo journalctl -k -b -1 | grep -iE "out of memory|killed process"

# List the boots the journal knows about
journalctl --list-boots
-b -1 only works when the journal is written to /var/log/journal. If journalctl --list-boots shows a single entry, the journal lives in memory under /run/log/journal and was lost with the reboot. Make it persistent with sudo mkdir -p /var/log/journal && sudo systemctl restart systemd-journald, or set Storage=persistent in /etc/systemd/journald.conf.
Grep the syslog files
Where rsyslog is installed, kernel messages are also written to plain files that are rotated rather than wiped.
# Debian and Ubuntu
sudo zgrep -iE "out of memory|killed process" /var/log/kern.log*

# RHEL, Rocky, AlmaLinux
sudo zgrep -iE "out of memory|killed process" /var/log/messages*
zgrep reads both the current file and the compressed rotations, so this reaches back as far as your logrotate policy keeps them, typically four weeks.
See every process's memory at the time of the kill
The full OOM report includes a table of every process the kernel considered, with resident memory in pages. It is the closest thing you will get to a ps taken at the moment of the kill. This pulls it out and sorts it:
sudo journalctl -k -o cat --since "03:00" --until "03:30" \
  | sed -n '/Tasks state/,/oom-kill:/p' \
  | awk 'NF >= 8 && $NF != "name" && $(NF-4) ~ /^[0-9]+$/ {
           printf "%8.0f MB  %s\n", $(NF-4) * 4 / 1024, $NF }' \
  | sort -rn | head -5
7040 MB node
377 MB postgres
86 MB nginx
41 MB systemd-journal
18 MB sshdThe * 4 assumes 4 KiB pages, which is what x86_64 and almost every arm64 distribution use. Confirm with getconf PAGESIZE. If your kernel prints extra memory columns in the Tasks state header, move the field number to match the rss column. Narrow --since and --until to a single event when there were several kills.
The oom-kill: line just above Killed process also carries the cgroup of the victim:
oom-kill:constraint=CONSTRAINT_NONE,nodemask=(null),cpuset=/,mems_allowed=0,global_oom,task_memcg=/system.slice/api.service,task=node,pid=3012,uid=1000global_oom and CONSTRAINT_NONE confirm the whole host ran out. For a cgroup OOM you see CONSTRAINT_MEMCG and an oom_memcg= field naming the unit or container whose limit was hit.
Check systemd, if the victim was a service
systemd records the OOM kill against the unit, which is often the fastest way to confirm a suspicion.
$ systemctl status api.service
× api.service - API server
     Loaded: loaded (/etc/systemd/system/api.service; enabled; preset: enabled)
     Active: failed (Result: oom-kill) since Mon 2026-09-28 03:14:21 UTC; 5h ago
    Process: 3012 ExecStart=/usr/bin/node /srv/api/server.js (code=killed, signal=KILL)
The unit's own log has the matching line: journalctl -u api.service shows A process of this unit has been killed by the OOM killer. If the unit has Restart=on-failure, it came back on its own and the only trace is this line plus a gap in your application logs.
When there is no kernel message at all
A process that died with SIGKILL and left nothing in dmesg was probably killed from userspace. systemd-oomd, enabled by default on Fedora and recent Ubuntu desktop images, and earlyoom, where installed, both act on memory pressure before the kernel gets there.
journalctl -u systemd-oomd --since "24 hours ago"
journalctl -u earlyoom --since "24 hours ago"
systemd-oomd kills a whole cgroup and logs which one and the pressure that triggered it. If neither shows anything, look for an external kill -9: a deploy script, a supervisor with a hard timeout, or a cloud agent.
What the kernel log does not tell you
Everything above answers "who died". It does not answer "why now". The OOM report is a single frame: node held 6.9 GB at 03:14:21. It does not tell you whether node grew 30 MB an hour for four days, which is a leak, or jumped from 1.8 GB to 6.9 GB in ten minutes when a cron job loaded a large export, which is a spike with a completely different fix.
sar -r can answer that if sysstat was installed and enabled before the event, and only for as long as the host keeps its files. On a VM that was replaced, or a box where nobody enabled the collector, the curve is gone. This is the point where log digging stops being enough, and where an agent that ships metrics off the host lets you see the memory ramp-up that the kernel log never records, for weeks back, on the same timeline as CPU and disk I/O.
How oom_score and oom_score_adj decide who dies
What oom_score measures
Every process has a live score in /proc/<pid>/oom_score. The kernel computes it from the process's resident memory, its swap entries and its page tables, as a share of RAM plus swap, then shifts it by oom_score_adj. When the OOM killer runs, the highest score is killed.
On current kernels (5.9 and later), the file is scaled into a 0 to 2000 range, and a small process with oom_score_adj of 0 reads about 666 rather than 0. Only the order matters, so do not treat 666 as a warning.
List the top candidates on a running box:
for p in /proc/[0-9]*; do
  printf "%5s %7s  %s\n" "$(cat $p/oom_score 2>/dev/null)" "${p#/proc/}" "$(cat $p/comm 2>/dev/null)"
done | sort -rn | head -5
793 3014 node
672 3310 nginx
666 612 systemd-journal
666 901 cron
91 1423 postgreschoom, from util-linux, reads and sets the same values for one PID.
$ choom -p 1423
pid 1423's current OOM score: 91
pid 1423's current OOM score adjust value: -900
Protect critical processes with oom_score_adj
oom_score_adj ranges from -1000 to 1000. Negative values make a process less likely to be picked, positive values more likely, and -1000 exempts it completely. Lowering it requires CAP_SYS_RESOURCE, so in practice root. The value is inherited by child processes.
Set it in the systemd unit so it survives restarts:
sudo systemctl edit postgresql.service[Service]
OOMScoreAdjust=-900For a one-off on a running process, echo -900 | sudo tee /proc/1423/oom_score_adj or sudo choom -n -900 -p 1423 does the same until the process restarts.
Some rules I follow:
- Protect small, stable daemons: the database primary,
sshd, the monitoring agent. They are cheap to keep and expensive to lose. - Make disposable work a preferred victim: batch workers, report generators and build jobs can take
OOMScoreAdjust=500, so the kernel kills a retryable job instead of your API. - Never set -1000 on the process that is growing. The kernel will kill everything else first, and if nothing killable is left it panics.
- Watch for forking servers. PostgreSQL recommends protecting only the postmaster and resetting children to 0 with
PG_OOM_ADJUST_FILE=/proc/self/oom_score_adjandPG_OOM_ADJUST_VALUE=0, otherwise one runaway query backend inherits the protection.
The older /proc/<pid>/oom_adj file, with its -17 to 15 range, is deprecated. Use oom_score_adj.
OOM killer configuration
vm.overcommit_memory
This sysctl decides how optimistic the kernel is when handing out memory.
| Value | Behaviour | When to use it |
|---|---|---|
0 (default) |
Heuristic: refuses only obviously impossible requests | General-purpose servers |
1 |
Always grants the request | Redis, which forks for snapshots and recommends it |
2 |
Strict: refuses allocations past CommitLimit |
Dedicated database hosts, PostgreSQL's own recommendation |
With mode 2, CommitLimit is swap plus vm.overcommit_ratio percent of RAM, and the ratio defaults to 50. On an 8 GB host with 2 GB of swap that is only 6 GB, less than the RAM you paid for, so raise the ratio or set vm.overcommit_kbytes when you switch. Compare the limit with what is already promised:
grep -E "^(CommitLimit|Committed_AS)" /proc/meminfo
sudo sysctl -w vm.overcommit_memory=2 vm.overcommit_ratio=90
Persist the settings in a file under /etc/sysctl.d/. The tradeoff is real: strict mode turns a SIGKILL into a malloc() failure, and plenty of software handles a failed allocation by crashing anyway.
Two related sysctls: vm.panic_on_oom=1 panics instead of killing, which combined with kernel.panic=10 reboots the host, useful for clustered nodes where a clean restart beats a half-dead member. vm.oom_kill_allocating_task=1 kills whichever task triggered the OOM instead of scanning, faster on hosts with tens of thousands of processes but a worse choice of victim.
Swap
A server with no swap can only reclaim page cache. Every byte of anonymous memory is pinned, so a leak goes straight from "fine" to OOM. A modest swap file, 1 to 2 GB on most servers, lets the kernel move pages that have not been touched in hours out of RAM and buys time before a kill.
sudo fallocate -l 2G /swapfile && sudo chmod 600 /swapfile
sudo mkswap /swapfile && sudo swapon /swapfile
echo '/swapfile none swap sw 0 0' | sudo tee -a /etc/fstab
Swap gives you time, and it does not add capacity. If si and so in vmstat 5 stay above zero, the machine is thrashing and latency is already suffering.
systemd MemoryHigh and MemoryMax
systemd puts every service in its own cgroup, so you can cap a unit without touching the rest of the host.
[Service]
MemoryHigh=1536M
MemoryMax=2G
OOMPolicy=stop
Restart=on-failureMemoryHigh=is a soft ceiling. Above it, the kernel reclaims aggressively and throttles the unit, which slows it down instead of killing it.MemoryMax=is the hard limit. Crossing it triggers a cgroup OOM, confined to this unit.OOMPolicy=stopstops the whole unit when one of its processes is OOM-killed, which is the default, andRestart=on-failurebrings it back.
Check how often a unit has been hitting its limits:
$ cat /sys/fs/cgroup/system.slice/api.service/memory.events
low 0
high 1284
max 12
oom 3
oom_kill 3
A climbing high counter is the early warning: the unit is being throttled well before it is killed. Kernels 5.19 and later also expose memory.peak, the highest usage the cgroup has reached.
Docker memory limits and OOMKilled
Without --memory, a container can use all of the host's RAM and the OOM killer treats it like any other process. With a limit, the container gets its own cgroup OOM.
docker run -d --name api --memory=2g --memory-reservation=1536m myorg/api

# Was the last exit an OOM kill?
docker inspect --format '{{.State.OOMKilled}} {{.State.ExitCode}}' api
# true 137

# Watch OOM events live
docker events --filter event=oom
Exit code 137 is 128 plus signal 9. --oom-kill-disable exists, but on a container with a limit it leaves the processes blocked waiting for memory, which looks like a hang rather than a crash. Leave it off.
Kubernetes limits and OOMKilled
Kubernetes enforces resources.limits.memory as the container's cgroup limit. Crossing it is a cgroup OOM, reported on the pod:
$ kubectl describe pod api-7c9f8d6b5-x2k4q
    Last State:     Terminated
      Reason:       OOMKilled
      Exit Code:    137
    Restart Count:  6
kubectl get pods -o jsonpath='{range .items[*]}{.metadata.name}{"\t"}{.status.containerStatuses[*].lastState.terminated.reason}{"\n"}{end}' | grep OOMKilledThree details that change how you read it:
OOMKilledandEvictedare different. OOMKilled is the kernel enforcing a container limit. Evicted is the kubelet removing pods because the node itself fell below its memory eviction threshold.- QoS class sets
oom_score_adj. Guaranteed pods (requests equal limits) get -997, BestEffort pods get 1000, and Burstable pods sit in between based on their request. Under node-wide pressure, BestEffort dies first. - On cgroup v2, recent Kubernetes versions kill every process in the container, not only the largest one, so a sidecar process inside the same container goes down too.
Runtimes that size their heap from the machine's RAM are the usual culprits. Set -XX:MaxRAMPercentage=75 on the JVM and --max-old-space-size on Node.js below the container limit, so the runtime collects garbage before the kernel steps in. Our Kubernetes monitoring setup guide covers per-pod memory tracking, which a host-level view does not provide.
How to prevent OOM kills from coming back
Work out the growth pattern first, because each one has a different fix:
| Pattern on the memory graph | Likely cause | Fix |
|---|---|---|
| Steady climb over hours or days, reset only by restarts | Leak in the application or a native library | Heap profile, then fix. Scheduled restarts only buy time |
| Sharp jump at the same time every day | Cron job, backup, report or batch import | Cap the job with MemoryMax=, raise its oom_score_adj, or move it |
| Rises with traffic and falls back | Worker count or per-request memory too high for the box | Fewer workers, lower per-connection buffers, or more RAM |
| Flat until one request, then vertical | A single query or upload loading everything into memory | Pagination, streaming, request size limits |
Then put guard rails in place:
- Size runtimes below the limit. PostgreSQL's
work_memis per sort, per connection, so 200 connections at 64 MB can promise 12.8 GB. JVM and Node.js heaps need explicit ceilings. - Cap the noisy neighbours. Anything that is not your main service gets a
MemoryMax=and a positiveOOMScoreAdjust=. - Protect what must survive. Database, SSH and the monitoring agent get a negative
OOMScoreAdjust=. - Keep some swap. A small swap file turns a sudden kill into a visible slowdown.
- Alert on available memory, not free memory. Page when
MemAvailablestays below 10% of total for 10 minutes, as explained in how to monitor memory usage on Linux. The reasoning behind the window is in server monitoring alert thresholds. - Count OOM kills. Since Linux 4.13,
/proc/vmstatkeeps a system-wide counter since boot, which makes a cheap cron check:
#!/bin/bash
# /usr/local/bin/oom-check: run every minute from cron, alert when the counter moves
state=/var/lib/oom-check.last
now=$(awk '/^oom_kill / {print $2}' /proc/vmstat)
last=$(cat "$state" 2>/dev/null || echo "$now")
echo "$now" > "$state"
if [ "$now" -gt "$last" ]; then
  logger -p kern.warning "oom-check: $((now - last)) new OOM kill(s) on $(hostname)"
  # send it to your alerting webhook here
fi
Once an OOM kill has taken down something customer facing, write it up. The timeline section of an incident post-mortem is where the memory graph from before the kill belongs.
How to use Hyperping to investigate OOM kills
The commands above find the victim. An agent keeps the history that explains it and pages someone when a host is too starved to report. Here is how I would set it up.
1. Install the agent on the host
Create a server in Hyperping, copy the install command, and run it on the box.
curl -fsSL https://hyperping.com/install.sh | sh -s HP_INSTALL_xxxxxThe installer registers the agent as a systemd service on Linux, runs on amd64 and arm64, and embeds an OpenTelemetry collector with a target footprint of about 50 MB RSS. It scrapes every 30 seconds. If ingest is unreachable, unsent metrics wait in an on-disk queue at /var/lib/hyperping/queue that survives reboots and is retried automatically. Full steps are in the install the agent docs. Give the agent a negative OOMScoreAdjust= with sudo systemctl edit hp-agent.service, as you would for any other process you want to survive the event.
2. Read the memory ramp-up before the kill
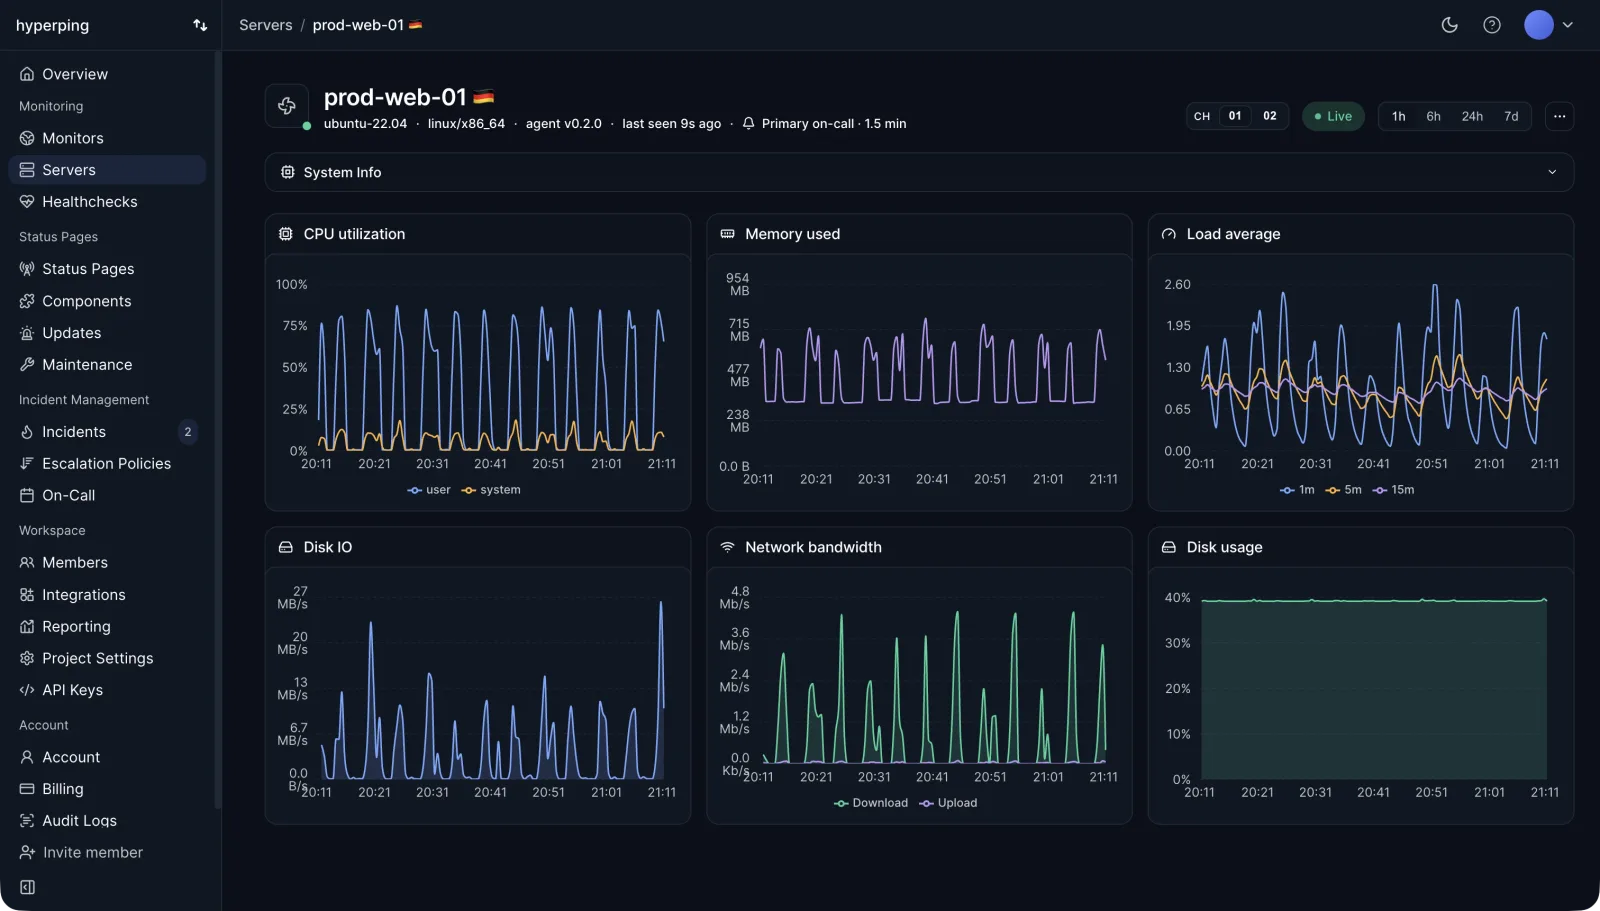
Memory arrives as usage per state (used, free, buffered, cached, reclaimable and unreclaimable slab), a utilization percentage of installed RAM, and total memory, next to CPU, load average, filesystem, disk I/O and network on one timeline. Take the timestamp from the Killed process line and scroll back: a sawtooth that resets at every restart is a leak, a wall at 03:00 is a job.
How far back you can scroll depends on the plan. Essentials keeps 7 days at 1-minute resolution and 30 days at 5-minute, Pro keeps 14 days at 1-minute and 60 days at 5-minute, and Business keeps 30 days at 1-minute and 90 days at 5-minute, with hourly rollups beyond that. The metrics collected reference lists every field.
Two gaps to plan around. Swap and paging are not ingested, and neither is per-process memory, so the agent shows you the host's curve and the kernel's Tasks state table still tells you which process owned it.
3. Page the on-call when the server stops reporting
Hyperping's server alerting is based on liveness, not on memory thresholds. A server goes Stale in the UI after 30 seconds without metrics and Offline once its threshold passes, 90 seconds by default and tunable per server down to 60. Offline opens an outage and runs the escalation policy bound to the server, through email, SMS, phone calls, Slack, Teams, PagerDuty, Opsgenie, webhooks or an on-call schedule. The server alerting docs cover the states.
That catches the worst OOM scenario: the host thrashing so hard, or hung after a kill took out something essential, that it stops reporting at all. There is no built-in rule for "memory above 90%", so the available-memory alert described earlier belongs in your own alerting layer, fed by the same numbers the agent records.
Server alerting is on the paid plans: Essentials at $24/mo billed yearly includes 5 agents, Pro at $74/mo includes 20, Business at $249/mo includes 100. The free plan includes 1 agent without server alerting, enough to watch one box. Details are on the pricing page.
4. Add an uptime check on the service the kernel killed
When the kernel kills your API and the box stays healthy, the agent keeps reporting and no liveness alert fires. An external uptime check on the service's health endpoint covers that case: the process is gone, the endpoint stops answering, and the check opens an outage. If Restart=on-failure brings it back, you still get the outage and recovery on record, which tells you the OOM kill happened even when nobody was awake to see it. Connect the check to a status page if customers depend on that service.
Where to start
If a process just died, run sudo dmesg -T | grep -iE "out of memory|killed process" first, or sudo journalctl -k -b -1 after a reboot. Read the Killed process line for the victim, the oom-kill: line for the cgroup, and the Tasks state table for who else was holding memory.
Then decide what should die next time. Protect the database and SSH with OOMScoreAdjust=, cap batch work with MemoryMax=, size runtime heaps below container limits, and keep a small swap file. Finally, make sure the next event leaves a curve behind it, from sar or an agent, so the question after the kill is how to fix the leak rather than what happened. For more on the underlying metric, see the glossary entry on memory utilization.
FAQ
How do I check OOM killer logs on Linux? ▼
Run sudo dmesg -T | grep -iE 'out of memory|killed process' for the current boot, or sudo journalctl -k -b -1 | grep -i oom for the previous one if the journal is persistent. On Debian and Ubuntu the same lines land in /var/log/kern.log, and on RHEL in /var/log/messages. The Killed process line names the PID, the command and the memory it held.
What is oom_score in Linux? ▼
oom_score is the kernel's current rating of how attractive a process is as an OOM victim, read from /proc/PID/oom_score. It is based on the process's resident memory, swap and page tables as a share of RAM plus swap, shifted by oom_score_adj. The highest score dies first, so only the relative order matters.
How do I stop the OOM killer from killing a specific process? ▼
Lower its oom_score_adj, ideally through OOMScoreAdjust= in the systemd unit so it survives restarts. A value of -1000 exempts the process entirely, but use it only on small, trusted daemons. Exempting a process that is leaking memory just moves the kill to another process or, if nothing else is killable, to a kernel panic.
What does exit code 137 or OOMKilled mean? ▼
Exit code 137 is 128 plus signal 9, SIGKILL. When Docker reports OOMKilled true or Kubernetes shows Reason: OOMKilled, the container hit its own memory limit and the kernel killed it inside that cgroup. The host itself may have had plenty of free memory.
Can I disable the OOM killer? ▼
Not globally in a useful way. vm.overcommit_memory=2 makes the kernel refuse allocations up front so programs get a malloc failure instead of a SIGKILL, and vm.panic_on_oom=1 reboots the machine instead of choosing a victim. Most teams keep the OOM killer and control which process it picks with limits and oom_score_adj.
Why was my process killed with no OOM message in dmesg? ▼
A userspace killer probably got there first. systemd-oomd on Fedora and recent Ubuntu desktop images, and earlyoom where installed, act on memory pressure before the kernel does and log to the journal instead of the kernel ring buffer. Check journalctl -u systemd-oomd and journalctl -u earlyoom.