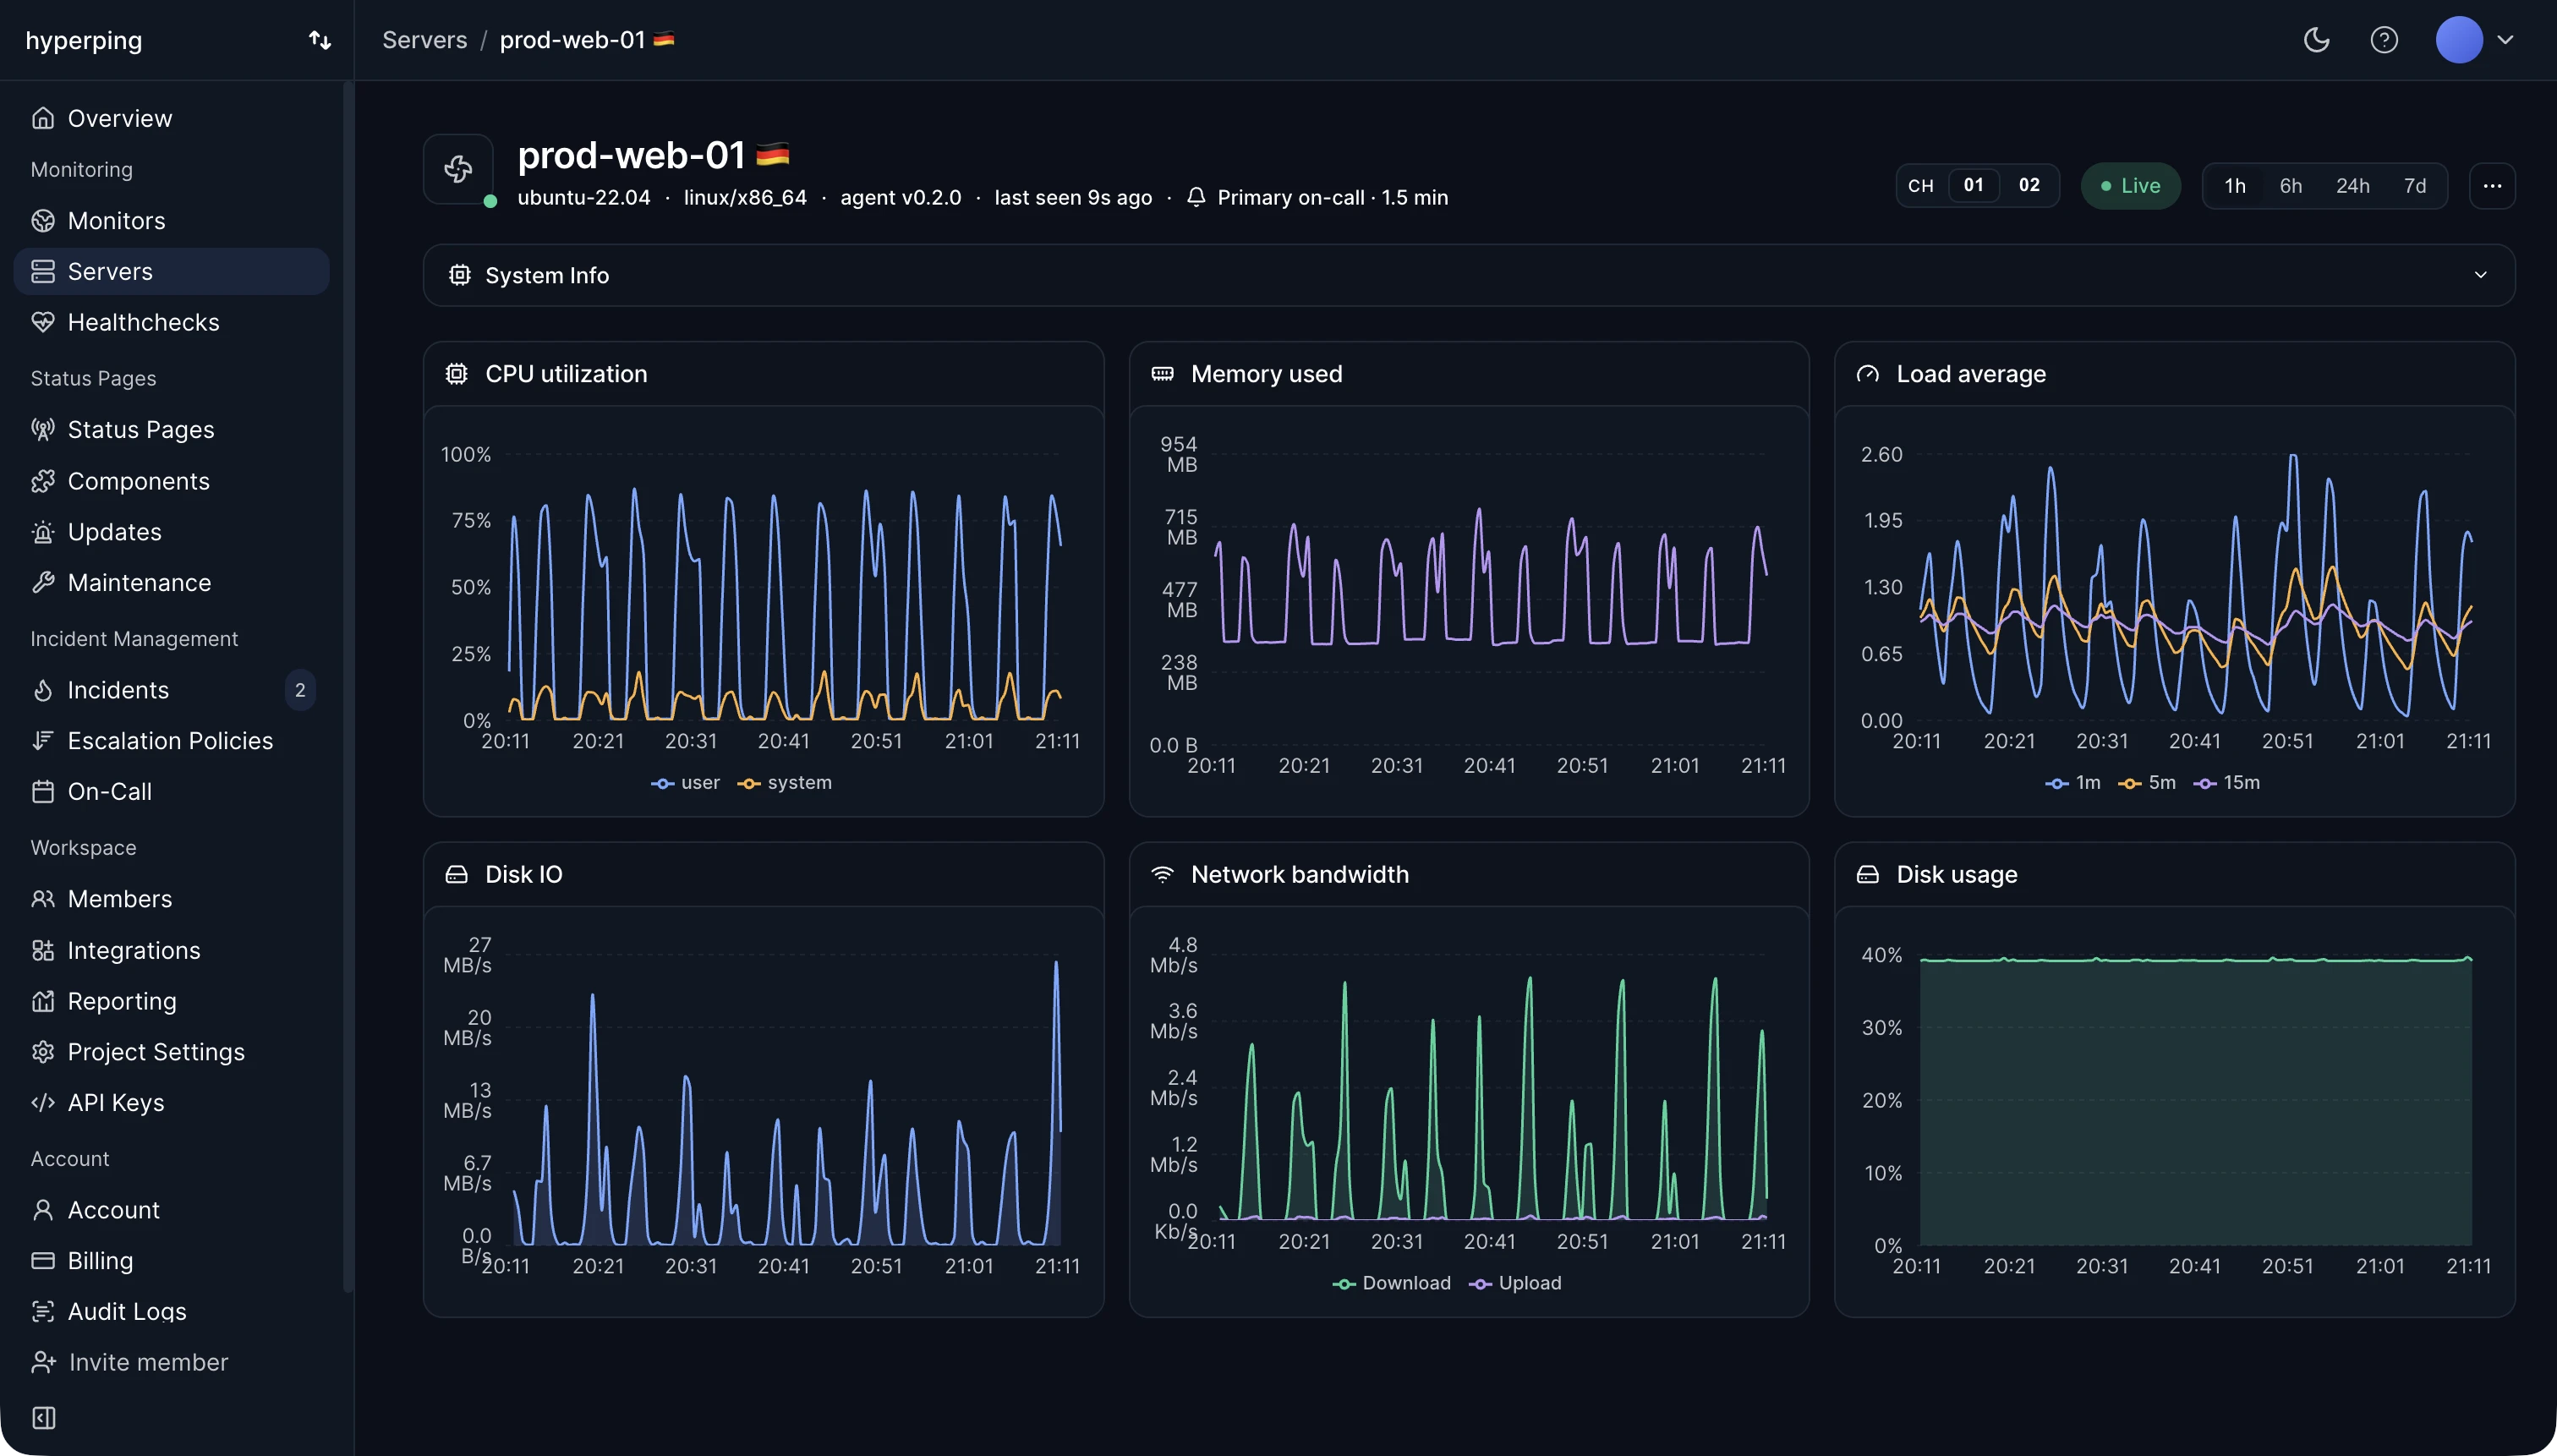
Server monitoring needs something running on the server, usually an agent. Hyperping's agent installs with one command on Linux, macOS, and Windows, sends CPU, memory, filesystem, disk I/O, and network metrics every 30 seconds, and holds around 50 MB of memory. When a server stops reporting, it's marked Stale after 30 seconds and Offline after 90 seconds by default, which opens an outage and pages the server's escalation policy like a failed uptime check.
Metrics to collect
- CPU utilization, broken down into user, system, and iowait time, plus the load average.
- Memory used and available. Available memory is the one to watch.
- Disk space used and free on each mount point.
- Disk I/O, bytes read and written per device.
- Network traffic in and out per interface.
- Host details: OS, kernel, architecture, CPU model, and boot time.
Server monitoring vs uptime monitoring
They answer different questions, and neither replaces the other. An external uptime check tells you within seconds that customers are affected, from outside your network, with no agent to trust. Server metrics tell you why, and often show the problem building for hours first: available memory sliding down, free space shrinking at a steady rate, load average creeping past the number of cores.
Run both. Page on the external check, because it means users are affected now. Use the server timeline to diagnose, and to catch the slow failures an outside check can't see until they become an outage.
The alert teams forget
An agent that stops reporting is an incident, not a quiet server. A host that crashed, lost its network, or ran out of memory badly enough to kill the agent sends nothing, and a dashboard that only alerts on thresholds stays silent. Alert on missing data first, then on resource limits.
How to set up server monitoring with Hyperping
- Copy the install command from the Servers page and run it on the host: a shell one-liner on Linux and macOS, PowerShell on Windows. See install the agent.
- Set the server's name, escalation policy, and group at install time if you deploy with Ansible, Terraform, or a Kubernetes DaemonSet.
- Adjust the offline threshold if 90 seconds is too strict for the host. The minimum is 60 seconds.
- Add an uptime monitor on the service the server runs, so you get both the outside and inside view in the same project.
FAQ
Does the agent need inbound ports?
No. It only makes outbound HTTPS requests, and queues metrics on disk when it can't send them, so graphs stay complete through network blips and reboots.
Does server monitoring work with containers?
For host metrics, yes: install the agent on the VM or node, and you see the load of every container it runs. Per-container and per-process metrics need a different tool.
How much does server monitoring cost?
The Free plan includes 1 server. Paid plans include 5, 20, or 100, with server alerting, and extra servers cost $2 a month, or $1.50 on Business. Compare with other tools in the server monitoring cost calculator.