To see network throughput on a Linux server right now, read /proc/net/dev twice and divide the difference by the seconds between reads. That is what every tool here does for you: nload and bmon draw it per interface, iftop splits it per connection, sar -n DEV keeps a week of it on disk, and ss -ti tells you whether those bytes moved once or were retransmitted. The kernel never hands you a rate, only cumulative byte counters, and that single detail explains most of the confusion around Linux bandwidth monitoring.
Key takeaways
/proc/net/devexposes 16 cumulative counters per interface. Two samples and a division is the entire trick.- On 64-bit kernels the byte counters are 64-bit and will not wrap in practice. On a 32-bit kernel they roll over every 34 seconds at 1 Gbps, which silently produces negative deltas.
- A 1 Gbps link carries 125 MB/s of frames and lands near 118 MB/s of TCP payload at a 1500 byte MTU. Compare your MB/s against that, not against 1000.
- Summing every interface double counts. Container traffic is measured on
veth, thendocker0, theneth0, andlois memory to memory with no wire behind it. - Throughput does not detect packet loss. At 1 Gbps with 64 byte frames the packet rate ceiling is 1,488,095 pps, which you hit long before the bit rate looks alarming.
The methods, side by side
| Method | Install needed | Best for | Per connection | Keeps history |
|---|---|---|---|---|
/proc/net/dev |
No, kernel interface | Scripts, exporters, custom alerting | No | No |
ip -s link |
No, ships with iproute2 | Totals plus errors and drops | No | No |
nload |
Yes | A live rate for one interface | No | No |
bmon |
Yes | Several interfaces on one screen | No | No |
iftop |
Yes, and needs root | Which peer is eating the link | Yes | No |
sar -n DEV |
Yes, sysstat |
7 to 28 days of local history | No | Yes, on the host |
ss -ti |
No, ships with iproute2 | Retransmits, cwnd and RTT per socket | Yes | No |
| Agent | One line | Fleet history, alerting, correlation | No | Yes |
Method 1: /proc/net/dev and the counter problem
Every tool on this page reads the same file. It is a plain text table with one row per interface.
$ cat /proc/net/dev
Inter-|   Receive                                                |  Transmit
 face |bytes    packets errs drop fifo frame compressed multicast|bytes    packets errs drop fifo colls carrier compressed
    lo: 5218844   41022    0    0    0     0          0         0  5218844   41022    0    0    0     0       0       0
  eth0: 412839201 2914022    0    0    0     0          0     18240 9218402113 4102938    0   14    0     0       0       0
docker0: 10482301   88214    0    0    0     0          0         0   20841022   91004    0    0    0     0       0       0
Those byte figures are totals since the interface came up, so a single read tells you nothing about right now. The kernel leaves differentiation to userspace, which is why a rate always needs two samples and an interval.
Here is the smallest correct version of that calculation.
#!/bin/bash
# Throughput on one interface over a 1 second window
IFACE=${1:-eth0}

sample() {
  awk -v i="$IFACE" '{ sub(/:/, " "); if ($1 == i) print $2, $10 }' /proc/net/dev
}

read rx1 tx1 < <(sample)
sleep 1
read rx2 tx2 < <(sample)

awk -v r="$((rx2 - rx1))" -v t="$((tx2 - tx1))" \
    'BEGIN { printf "rx %.2f MB/s   tx %.2f MB/s\n", r/1048576, t/1048576 }'
$ ./netrate.sh eth0
rx 1.18 MB/s tx 17.99 MB/sTwo details are deliberate. The sub(/:/, " ") normalises the row first, because the separator between the interface name and the first counter has not been consistent across kernel versions and counter widths, and a glued eth0:412839201 breaks a naive $2 lookup. Field 2 is receive bytes and field 10 transmit bytes, since the receive block occupies fields 2 through 9.
The counters also include protocol headers, so they will never match an application level byte count. Expect interface numbers to read a few percent higher than what your web server thinks it sent.
ip -s link gives you the same data in a friendlier shape, with the error and drop columns right next to the bytes.
$ ip -s link show eth0
2: eth0: <BROADCAST,MULTICAST,UP,LOWER_UP> mtu 1500 qdisc mq state UP mode DEFAULT group default qlen 1000
    link/ether 06:1a:2b:3c:4d:5e brd ff:ff:ff:ff:ff:ff
    RX:  bytes packets errors dropped  missed   mcast
     412839201  2914022      0       0       0   18240
    TX:  bytes packets errors dropped carrier collsns
    9218402113  4102938      0      14       0       0
Method 2: nload and bmon for a live per-interface rate
nload is the fastest way to watch one interface without writing anything. Neither tool is installed by default.
# Debian and Ubuntu
sudo apt install nload bmon

# RHEL, Rocky, AlmaLinux (both live in EPEL)
sudo dnf install epel-release && sudo dnf install nload bmon
$ nload eth0
Device eth0 [10.0.1.14] (1/3):
==============================================================================
Incoming:
Curr: 9.84 MBit/s
Avg: 8.12 MBit/s
.|||. Min: 1.02 MBit/s
.|||||. Max: 41.20 MBit/s
.||||||||. Ttl: 402.11 GByte
Outgoing:
Curr: 147.22 MBit/s
Avg: 131.04 MBit/s
||||||||| Min: 12.40 MBit/s
||||||||||. Max: 402.88 MBit/s
.||||||||||| Ttl: 8.42 TByteNote the unit. nload reports bits per second by default while /proc/net/dev counts bytes, and mixing the two by a factor of 8 is the most common mistake I see in capacity tickets. Arrow keys cycle interfaces, and nload -m shows them all at once.
bmon covers the same ground with a list view that scales better past three or four interfaces, which is the normal situation on any host running containers.
bmon -p eth0,ens5 -o asciiMethod 3: iftop when you need to know who is using the bandwidth
Interface totals tell you the link is busy. They never tell you which client, backup job or replica is responsible. iftop reads packets through libpcap, so it needs root, and it groups traffic by source and destination pair.
sudo apt install iftop      # Debian and Ubuntu
sudo dnf install iftop      # RHEL with EPEL enabled, and Fedora
$ sudo iftop -i eth0 -nNP
12.5Mb 25.0Mb 37.5Mb 50.0Mb 62.5Mb
+-------------+-------------+-------------+-------------+-------------------
10.0.1.14:443 => 203.0.113.9:52344 18.2Mb 16.4Mb 9.11Mb
<= 1.02Mb 944Kb 612Kb
10.0.1.14:5432 => 10.0.2.31:41022 6.40Mb 5.88Mb 4.02Mb
<= 820Kb 744Kb 501Kb
--------------------------------------------------------------------------
TX: cum: 14.2GB peak: 88.4Mb rates: 41.2Mb 38.9Mb 22.4Mb
RX: 2.1GB 12.1Mb 3.8Mb 3.2Mb 1.9Mb
TOTAL: 16.3GB 100.5Mb 45.0Mb 42.1Mb 24.3MbThe three rate columns are 2, 10 and 40 second moving averages, which separates a burst from a sustained transfer. -n skips DNS, -N skips service name lookup and -P shows port numbers. I run all three together because reverse DNS on a busy host makes the display lag reality. Add -B to read bytes instead of bits.
iftop samples continuously and stores nothing, so it belongs in an incident, not in a monitoring setup.
Method 4: sar -n DEV for local history
sar comes from the sysstat package, the same one that provides iostat and mpstat. Debian and Ubuntu ship the collector disabled, so enable it before expecting any history.
sudo apt install sysstat    # or: sudo dnf install sysstat

# Debian and Ubuntu: set ENABLED="true" in /etc/default/sysstat
sudo systemctl enable --now sysstat
$ sar -n DEV 1 3
Linux 6.8.0-45-generic (web-01) 07/25/2026 _x86_64_ (4 CPU)
02:31:12 PM IFACE rxpck/s txpck/s rxkB/s txkB/s rxcmp/s txcmp/s rxmcst/s %ifutil
02:31:13 PM lo 18.00 18.00 2.14 2.14 0.00 0.00 0.00 0.00
02:31:13 PM eth0 9842.00 14201.00 1204.55 18422.31 0.00 0.00 0.00 15.10
02:31:13 PM docker0 112.00 98.00 10.44 8.02 0.00 0.00 0.00 0.00%ifutil is the column worth reading first, because sar has already divided throughput by the negotiated link speed for you. Here 18.4 MB/s outbound on a 1 Gbps interface works out to 15.1% of the link.
For yesterday's numbers, point sar at the daily binary file. The path differs by distribution.
sar -n DEV -f /var/log/sysstat/sa24    # Debian and Ubuntu
sar -n DEV -f /var/log/sa/sa24         # RHEL and derivatives
Retention defaults to 7 days on Debian and Ubuntu and 28 on RHEL, set by HISTORY in the sysstat config. The same limits apply here as with CPU history through sar: the data dies with the host, nothing alerts on it, and correlating twelve servers means twelve SSH sessions.
Method 5: ss for connection state and retransmits
Throughput is only half the picture. ss reads the kernel's socket tables and tells you whether the bytes are actually being delivered.
$ ss -s
Total: 428
TCP:   312 (estab 184, closed 96, orphaned 0, timewait 94)

Transport Total     IP        IPv6
RAW       0         0         0
UDP       8         6         2
TCP       216       210       6
INET      224       216       8
A timewait count in the tens of thousands, or estab climbing while throughput stays flat, points at connection churn rather than bandwidth. For per socket detail, use ss -ti.
$ ss -tin state established '( dport = :443 or sport = :443 )'
     0      0   10.0.1.14:443    203.0.113.9:52344
     cubic wscale:7,7 rto:212 rtt:11.4/2.1 mss:1448 pmtu:1500
     cwnd:24 bytes_sent:1842204 bytes_acked:1842204 bytes_received:9210
     send 24.4Mbps pacing_rate 29.2Mbps delivery_rate 18.1Mbps retrans:0/7
retrans:0/7 means zero retransmits in flight and 7 across the life of the connection. delivery_rate well below pacing_rate on many sockets at once means the path, not the interface, is the constraint. For a host-wide count of retransmissions, nstat is quicker than parsing netstat -s.
$ nstat -az | grep -iE 'retrans|drop'
TcpRetransSegs                  18422              0.0
TcpExtTCPLostRetransmit         12                 0.0
TcpExtListenDrops               0                  0.0
Which interfaces to graph, and which to ignore
ip -br link lists what the host actually has.
$ ip -br link
lo               UNKNOWN  00:00:00:00:00:00 <LOOPBACK,UP,LOWER_UP>
eth0             UP       06:1a:2b:3c:4d:5e <BROADCAST,MULTICAST,UP,LOWER_UP>
docker0          UP       02:42:9c:11:04:aa <BROADCAST,MULTICAST,UP,LOWER_UP>
vethb41f2c9@if12 UP       ce:20:5a:77:0d:31 <BROADCAST,MULTICAST,UP,LOWER_UP>
Only eth0 corresponds to a physical link with a bill and a speed limit attached. The others distort any total you compute.
lo carries every localhost connection, memory to memory, with no wire behind it. An application talking to a local cache or a sidecar proxy can push several Gbps on lo while the machine sends almost nothing outside. Treat it as an activity signal, never as bandwidth.
Docker bridges duplicate rather than invent. A container reaching the internet has its bytes counted on the veth pair, again on docker0, and again on eth0, so summing every interface reports roughly three times the real figure. Graph physical interfaces on their own and let the container platform report container traffic. Hyperping's agent collects bytes in and out per interface but does not ingest per container or per pod metrics, so that split has to come from elsewhere.
What throughput tells you, and what it does not
High throughput on its own is not a problem. It becomes one when it approaches the link's capacity, and you need the capacity number to know that.
$ ethtool eth0 | grep -i speed
	Speed: 1000Mb/s

$ cat /sys/class/net/eth0/speed
1000
On virtualised NICs, virtio and AWS ENA among them, ethtool usually answers Speed: Unknown!. In that case use the instance type's documented bandwidth as your denominator, because the hypervisor enforces it whatever the guest reports.
Three failure modes hide behind a healthy looking bit rate.
| Symptom | Where throughput misleads | What to check instead |
|---|---|---|
| Bandwidth saturation | Real, but only relative to link speed | %ifutil in sar -n DEV, ethtool speed |
| Packet loss | Bytes still flow, they just flow twice | ss -ti retrans, errs and drop in /proc/net/dev |
| Packet rate ceiling | Bit rate looks low with tiny packets | rxpck/s and txpck/s in sar, %si in top |
That last row catches people out. A 1 Gbps interface handling 64 byte frames tops out around 1.49 million packets per second, and the per packet cost lands in softirq processing rather than the bit counter. If %si in top climbs while throughput sits at a fraction of line rate, the fix is batching or offload settings rather than a bigger link. The same reasoning applies to disk I/O, where IOPS and bandwidth are separate ceilings.
The honest limit of interface counters is that they describe one machine's view. They cannot see latency between your server and a user in Sydney, a DNS failure, or a load balancer dropping half the requests before they ever reach the box. That is what external checks are for, and it is why Linux server monitoring works best with both views on one screen.
How to use Hyperping for continuous network monitoring
The commands above answer what an interface is doing this second. An agent turns the same counters into a timeline you can query afterwards, next to a liveness check that pages when the host stops reporting at all.
1. Install the agent on the server
Create a server in Hyperping, copy the install command, and run it on the host.
curl -fsSL https://hyperping.com/install.sh | sh -s HP_INSTALL_xxxxxThe agent embeds an OpenTelemetry collector, registers with systemd on Linux and launchd on macOS, and runs on amd64 and arm64. It sits around 50 MB RSS with no JVM, scrapes every 30 seconds, and ships gzipped OTLP/HTTP payloads that arrive within a couple of seconds. If ingest is unreachable, samples buffer in an on-disk queue at /var/lib/hyperping/queue that survives reboots. Re-running the installer rotates credentials while keeping the same server UUID and history. The install the agent docs cover the full flow. Windows is not supported yet.
2. Read network throughput next to CPU, memory, filesystem and disk I/O
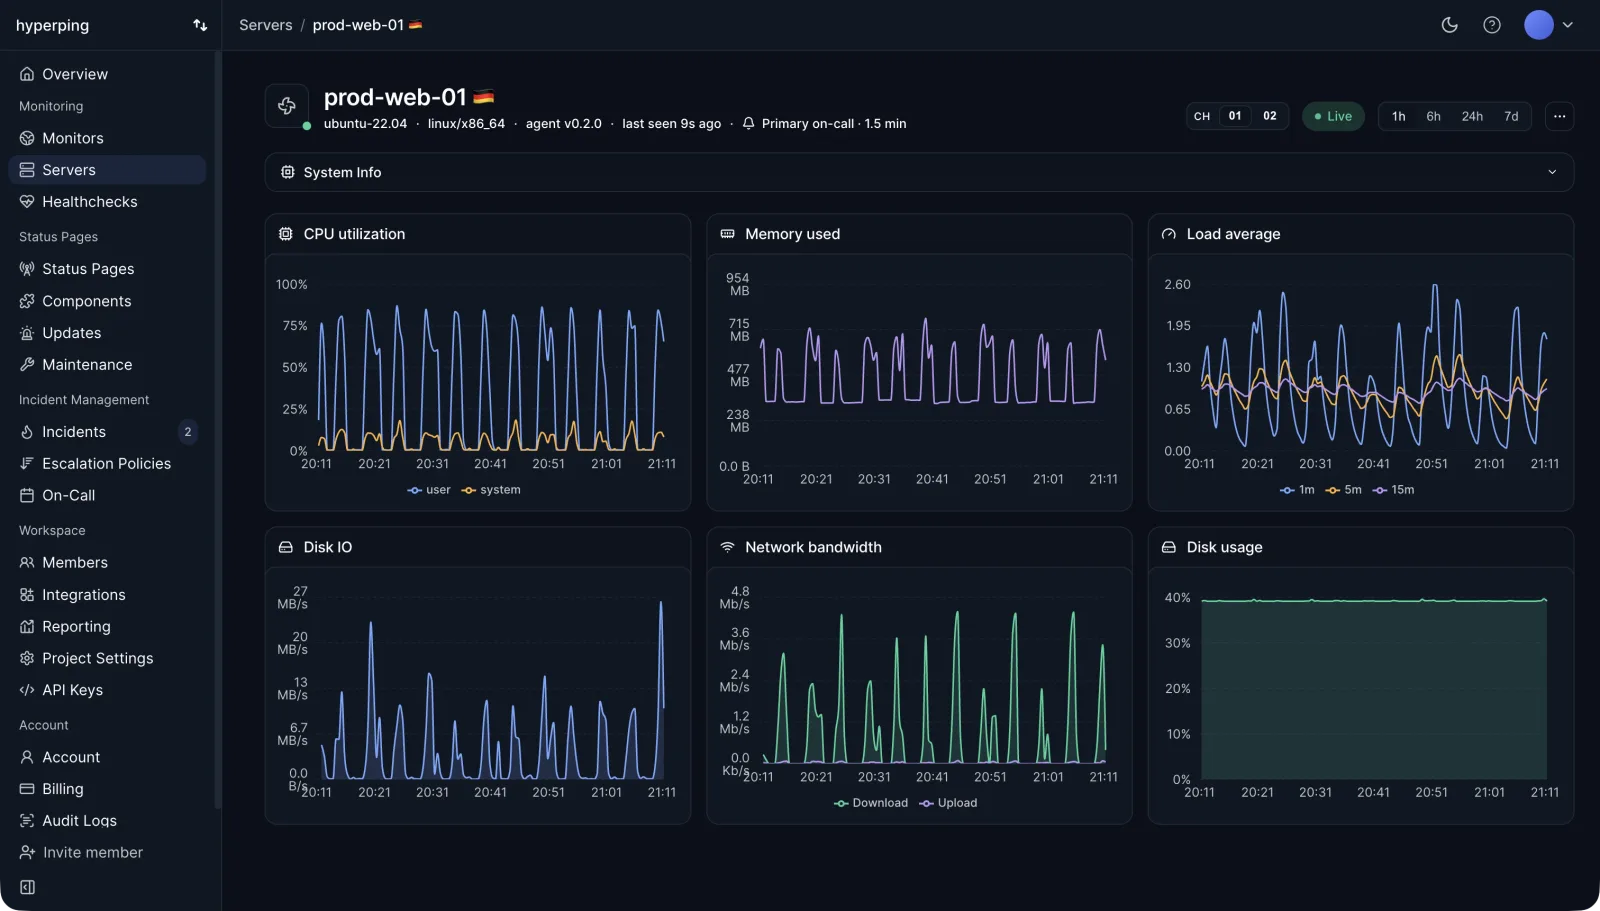
The agent collects bytes in and out per interface and derives TX and RX rates in the dashboard, which is the two-sample division from Method 1 done for you every 30 seconds. On the same timeline you get CPU time per state with load averages, memory used and available, per-mount filesystem usage with device and filesystem type, and read and write bytes per block device. Metric names follow the OpenTelemetry hostmetrics semantic conventions, listed field by field in the metrics collected reference. Packet error and dropped packet counters are not ingested, so keep ip -s link and nstat for loss investigations.
3. Page on agent liveness and keep throughput on the dashboard
Server alerting fires on agent liveness, not on resource thresholds. Metrics move to Stale after 30 seconds of silence, then to Offline past the server's threshold (90 seconds by default), which opens an outage and routes it through your existing escalation policies and on-call schedules. Throughput itself stays a dashboard signal, which is the right place for it: a link running hot is a capacity decision, not a 3am page. A raw byte rate has no threshold worth defending anyway, since 400 Mb/s is idle on one box and a runaway loop on another. The one exception, if you want a rule in your own alerting layer, is a ratio against a documented ceiling: throughput as a share of the negotiated link speed from ethtool, of the instance type's published bandwidth when ethtool reports Unknown, or of the monthly transfer allowance you are billed against. Hold it over several consecutive samples, because backups and deploys trip a one-shot rule every time. Server alerting is on the paid plans, with Essentials at $24/mo billed yearly for 5 agents and 7 days of metric history, Pro at $74/mo for 20 agents and 14 days, and Business at $249/mo for 100 agents and 30 days. The free plan gives you 1 agent and 2 days of history without server alerting, enough to try on one box. Details are on the pricing page.
4. Pair interface counters with external uptime checks
Host metrics tell you the link is busy. Uptime checks from 18 regions tell you whether that cost anyone anything: a throughput spike next to flat response times is a capacity note for next quarter, the same spike next to rising response times in three regions is a page. The server monitoring page puts both on one timeline, and agent-based monitoring plus external checks is what I would run on any fleet above two machines.
5. Publish a status page when saturation reaches users
Once saturation does turn into slow or failed requests, connect the affected monitors to a status page so customers see the incident without emailing support. Uptime history publishes automatically, which removes the manual reporting most teams still do by hand.
Where to start
Debugging a live problem: run sar -n DEV 1 5 for the %ifutil number, then sudo iftop -i eth0 -nNP to find the peer responsible. Check ss -ti for retransmits before concluding the link is too small, because loss and saturation need different fixes.
Building monitoring instead: sar gets you a free week of local history, and an agent makes the numbers outlive the host and pages someone when the host stops reporting at all. Graph throughput next to CPU usage and memory usage, since saturation, softirq load and memory pressure usually show up together.
FAQ
How do I check network throughput on Linux? ▼
Read /proc/net/dev twice, a second apart, and divide the byte difference by the interval. For a live view without scripting, run nload eth0 or bmon. For a per connection breakdown, run sudo iftop -i eth0 -nNP.
Why does /proc/net/dev show huge numbers instead of a speed? ▼
Those are cumulative counters since the interface came up, not rates. The kernel never computes a rate for you. Every graphing tool samples the counter twice and divides the delta by the elapsed time, which is exactly what a monitoring agent does on a fixed cadence.
What is the difference between iftop and nload? ▼
nload draws total incoming and outgoing throughput for one interface and needs no privileges beyond reading /proc. iftop uses libpcap to inspect packets, needs root, and breaks the same traffic down per source and destination pair so you can see which peer is consuming the link.
Should I include docker0 and lo when measuring bandwidth? ▼
No. Loopback traffic never touches a wire, and container traffic is counted again on veth, docker0 and the physical interface, so summing everything inflates the total by two or three times. Graph the physical interfaces separately and treat lo as an activity signal only.
How do I know if my network link is saturated? ▼
Compare measured throughput against the negotiated link speed from ethtool eth0 or /sys/class/net/eth0/speed. A 1 Gbps link carries about 125 MB/s of frames and roughly 118 MB/s of TCP payload at a 1500 byte MTU. On cloud VMs ethtool often reports Unknown, so use the instance type's documented bandwidth instead.
How do I keep a history of network usage on Linux? ▼
Enable the sysstat collector and query it with sar -n DEV, which keeps 7 days on Debian and Ubuntu and 28 days on RHEL. That history lives on the host and has no alerting attached, so most teams also run an agent that ships interface counters off the box.