The best Zabbix alternatives in 2026 are Hyperping (hosted server and uptime monitoring with on-call and status pages included), Prometheus with Grafana (open-source metrics for containers and cloud-native stacks), Checkmk (the closest open-source match to Zabbix's scope, with auto-discovery), Netdata (per-second metrics with no configuration), Datadog (full observability with APM and logs) and Site24x7 (low-cost hosted all-in-one monitoring).
Zabbix is not broken. It's free, it scales, and Zabbix 7.0 LTS is supported until 2027. Teams leave because of what it takes to run it: a Linux server, a MySQL or PostgreSQL database to size and tune, templates and triggers to maintain, and an alerting layer that notifies but doesn't manage who is on call.
In this guide, you'll learn:
- Why teams replace Zabbix, based on reviewer feedback and Zabbix's own documentation
- Six alternatives with pricing checked on September 28, 2026, hosting model and setup effort
- Which ones are open source, which are free, and which work best for Windows shops
- Where Zabbix is still the better choice, and how to move the paging side off it without a big migration
Key takeaways
- Zabbix's server only runs on Unix-like systems and needs 2 CPU cores and 8 GiB of memory even for its "small" 1,000-metric reference setup, plus a database you maintain.
- Prometheus + Grafana is the strongest free alternative for containers and Kubernetes. Checkmk is the closest free match for mixed server and network estates.
- Hyperping replaces the host-health and paging side with nothing to host: a one-command agent for Linux, macOS and Windows, on-call schedules and status pages, from $24/month billed annually.
- Datadog starts at $15 per host per month billed annually and makes sense when you need APM and logs. Site24x7 starts at $9/month billed annually for small setups.
- Zabbix stays the better choice for large on-premises estates, SNMP-heavy network gear and air-gapped sites.
Why you should trust this guide
I'm Léo, founder of Hyperping. I have a stake in one of these tools, and Hyperping is listed first. I've tried to be precise about where it falls short, because it doesn't do everything Zabbix does: it has no SNMP polling, no metric threshold alerts yet, and no self-hosted edition.
For the other tools, I checked pricing on each vendor's official pricing page on September 28, 2026, read Zabbix's installation requirements and release policy, and went through Capterra reviews of Zabbix. I also read the recurring "Zabbix is too complex for my setup" threads on r/sysadmin and r/zabbix, but I quote reviews from Capterra because they carry a reviewer role I can attribute. Where I couldn't verify something, I say so.
Top picks at a glance
| Best for | Product |
|---|---|
| Hosted server monitoring with on-call and status pages included | Hyperping |
| Metrics-first monitoring for containers and Kubernetes | Prometheus + Grafana |
| Open-source all-rounder closest to Zabbix, with auto-discovery | Checkmk |
| Per-second host metrics with almost no configuration | Netdata |
| Full observability with APM, logs and traces | Datadog |
| Low-cost hosted monitoring for small IT teams | Site24x7 |
Why teams leave Zabbix
Zabbix has been around since 2001 and covers a lot: agents, SNMP, IPMI, JMX, web scenarios, templates for hundreds of devices, and a trigger language for thresholds and trends. The complaints I found are rarely about missing features. They're about the cost of operating all of it.
The server, the database and the frontend are yours to run
The Zabbix 7.4 requirements page lists Linux, BSD, macOS, AIX, Solaris and HP-UX for the server. Windows isn't on the list. You pick MySQL, MariaDB, PostgreSQL or PostgreSQL with TimescaleDB, and the reference sizing starts at 2 CPU cores and 8 GiB of memory for about 1,000 metrics, rising to 16 cores and 64 GiB for 100,000.
That's before housekeeping, partitioning, backups and major-version upgrades. The monitoring system becomes one more production system that someone has to keep healthy, and if it goes down, your alerting goes with it.
Templates and triggers take real expertise
In Zabbix, a check is an item, a condition is a trigger, a notification is an action, and all of it usually comes from a template you import, clone and adjust. It's flexible, and it's a lot of concepts for someone who wants to know when a disk is full.
From Capterra reviews of Zabbix:
"It's a steep learning curve to both install and configure Zabbix especially when you need to do custom sensors."
Infrastructure engineer, education
"Some configurations might be difficult if you don't read a lot of documentation."
ICT specialist, IT services
Another reviewer, an infrastructure engineer in the airline industry, pointed out that finding working modules and templates is left to the administrator, and that they don't always work. That matches what I read in Reddit threads: people who like Zabbix once it's tuned, and people with ten servers who find it overkill.
Alerting stops at notifications
Zabbix actions support escalation steps: notify a user group, wait, notify another group, run a remote command. Media types cover email, SMS, Slack, Teams, PagerDuty and more. What's missing is an on-call calendar: rotations, overrides for a sick day, and acknowledging from your phone to stop the next step.
So Zabbix shops usually add a paging tool (PagerDuty, Opsgenie, which shuts down on April 5, 2027, see our Opsgenie shutdown guide, or Grafana IRM). And customers learn about outages from support tickets, because Zabbix has no public status page. That's three tools to connect and keep in sync.
Zabbix Cloud removes the hosting, not the configuration
Zabbix Cloud runs the server for you, from $50/month (Nano, 50 new values per second) to $5,000/month (10,000 values per second), with 10% off annual plans and a 5-day trial. It solves the database and upgrades. You still build templates, items, triggers and actions the Zabbix way.
Quick comparison: Zabbix alternatives
| Tool | Starting price | Hosting | Setup effort | Alerting and on-call | Windows |
|---|---|---|---|---|---|
| Hyperping | Free; $24/mo billed annually | Hosted (SaaS) | Low: one command per host | On-call schedules, escalation policies, phone/SMS/Slack/Teams, status pages included | Native agent (Windows 10 / Server 2016+) |
| Prometheus + Grafana | Free; Grafana Cloud Pro $19/mo + usage | Self-hosted or Grafana Cloud | High | Alertmanager routing; Grafana IRM for on-call ($20/active user) | windows_exporter |
| Checkmk | Free Community; Pro from €190/mo billed annually | Self-hosted (Linux) or Checkmk Cloud | Medium | Rule-based notifications; paging through integrations | Native agent |
| Netdata | Free (5 nodes); Business $4.50/node/mo billed annually | Agent + Netdata Cloud, or on-prem | Low | Alert notifications; no on-call scheduling | Native agent |
| Datadog | Free (5 hosts); $15/host/mo billed annually | Hosted (SaaS) | Low to medium | Monitors + separate On-Call product, per seat | Native agent |
| Site24x7 | Free plan; $9/mo billed annually | Hosted (SaaS) | Low | Alert profiles, basic on-call; status pages in a separate product (StatusIQ) | Native agent |
| Zabbix (for reference) | Free; Cloud from $50/mo | Self-hosted (Unix-like) or Zabbix Cloud | Medium to high | Actions with escalation steps; no on-call calendar | Agent only; server can't run on Windows |
Hyperping: Best for hosted monitoring with on-call and status pages built in
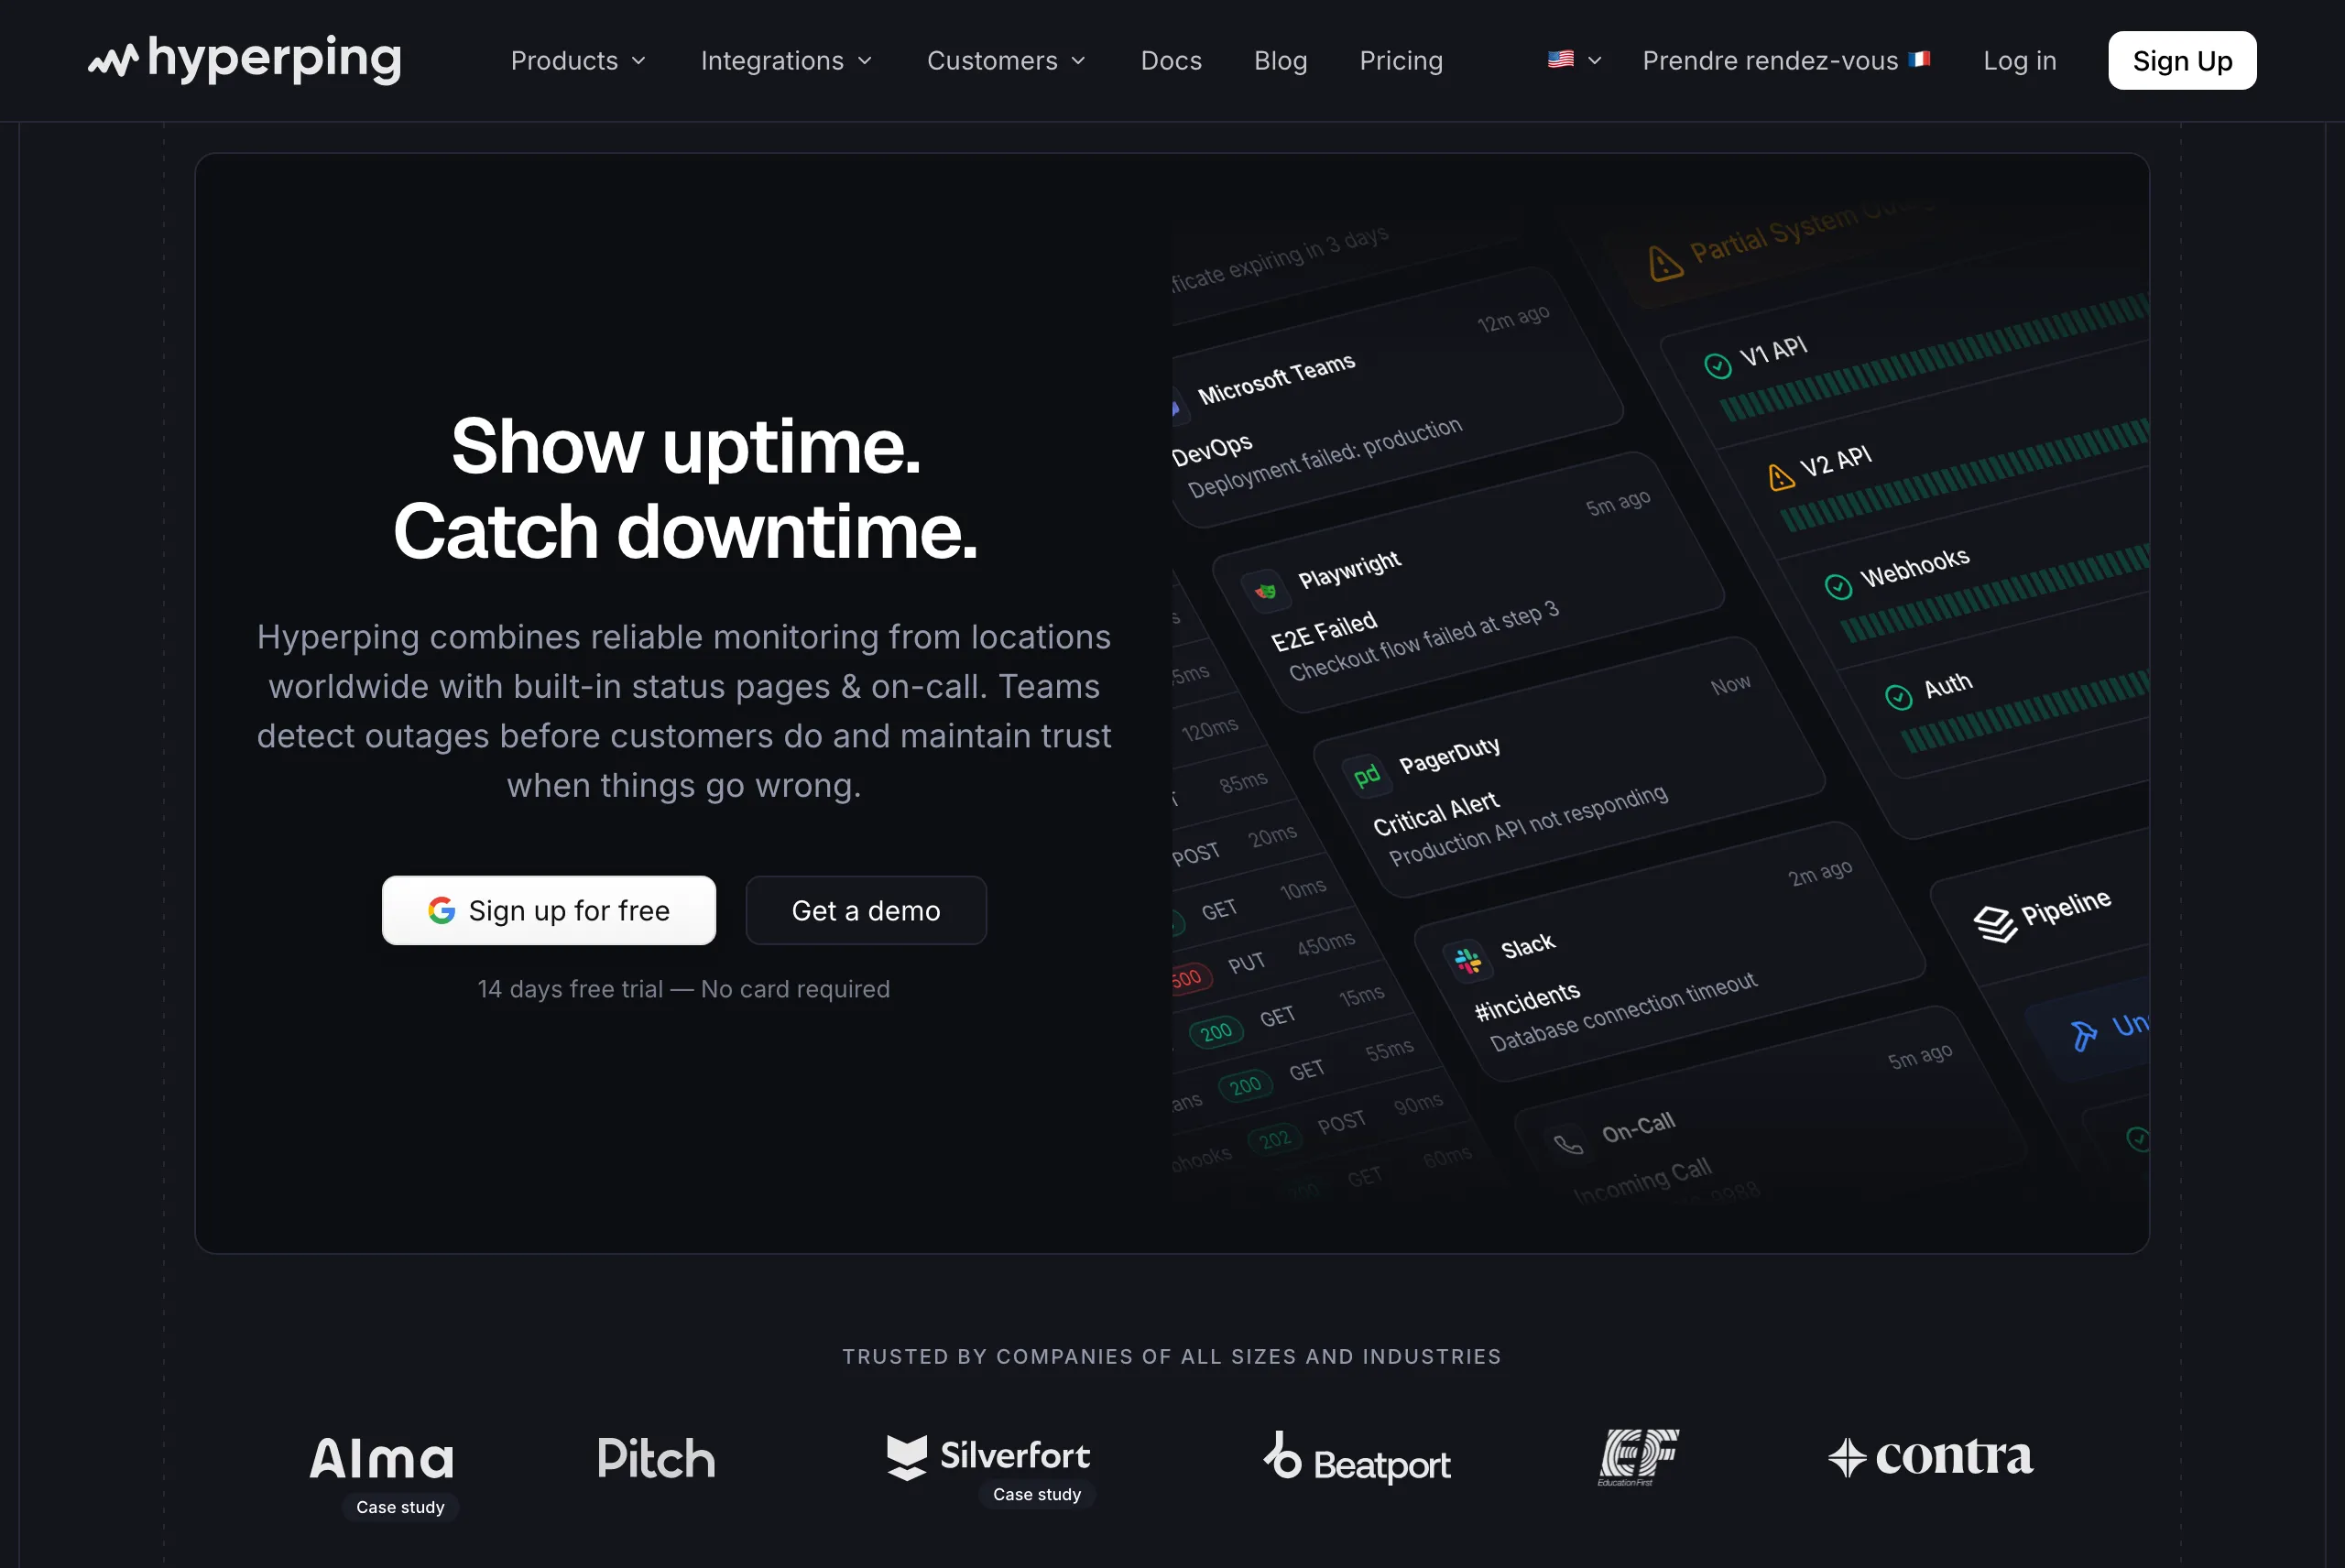
Who Hyperping is built for
Teams running a few to a few hundred servers who don't want to maintain a monitoring server, and whose biggest gap is what happens after something fails: who gets paged, what happens if they don't answer, and how customers hear about it.
Hyperping is not a like-for-like Zabbix replacement. It doesn't poll switches over SNMP or evaluate trigger expressions. It covers what most small and mid-size teams actually use Zabbix for (is the host alive, how are CPU, memory and disk doing, is the service answering) and adds the paging and status page layer Zabbix leaves to other tools.
Notable features
- One-line agent for Linux, macOS and Windows: One command registers a systemd, launchd or Windows service. It runs on amd64 and arm64 (amd64 on Windows), is a single binary with an embedded OpenTelemetry collector using about 50 MB of memory, and needs outbound HTTPS only. See the agent install reference.
- Host metrics every 30 seconds: CPU per state with 1, 5 and 15-minute load averages, memory per state, used and free space per mount, disk bytes read and written per device, network bytes in and out per interface, and host metadata (OS, kernel, CPU model, boot time).
- Nothing to template: The server shows up with its charts about 30 seconds after the install. Flags like
--name,--policyand--grouplet Ansible or Terraform enroll a fleet with the right escalation policy from the first run. - Offline detection that pages on-call: When a server stops reporting for longer than its offline threshold (90 seconds by default, 60 seconds minimum, set per server), an outage opens and the bound escalation policy pages its channels: email, SMS, phone calls, Slack, Teams, PagerDuty, webhooks or an on-call schedule. Details in server alerting.
- Uptime monitors in the same account: HTTP, ping, port and keyword checks from 18 regions, every 30 seconds by default, plus daily SSL certificate checks and cron heartbeats. These replace Zabbix web scenarios and simple checks pointed at your public endpoints.
- On-call schedules and escalation policies: Included from Essentials and shared by servers and monitors. See on-call.
- Status pages: Branded pages with subscribers, so the incident that paged your engineer can be published to customers. See status pages.
- No gaps after a network blip: The agent queues unsent metrics on disk and retries, so short ingest outages or reboots don't leave holes in the charts.
Why choose Hyperping over Zabbix?
Nothing to host, size or upgrade
Zabbix needs a server, a database, a web frontend and someone to upgrade them. With Hyperping the agent is the only thing on your hosts. The failure mode where the monitoring box dies at the same time as the thing it monitors goes away.
Paging is part of the product
In Zabbix, changing who's on call means editing user groups or actions. In Hyperping, you define a schedule and an escalation policy once, and each step has its own delay and channels, so an unanswered page moves to the next person. Our escalation policies guide and on-call rotations guide cover how to design them.
Customers hear about incidents from you
Zabbix has no status page. With Hyperping, the same outage can go on a status page that emails subscribers, without a third tool.
If your Zabbix setup has shrunk to "tell me when a box dies and wake the right person," and nobody wants to own the database behind it anymore, that's the point where it makes more sense to get paged when a server goes silent without running a monitoring server than to keep maintaining the stack.
What actual Hyperping users say
"We made our Hyperping status page publicly available and it became a crucial part of our sales pitches. We are proud of our uptime and we love that we can share it with prospects and customers in such an easy way."
How much does Hyperping cost?
- Free: 1 server monitoring agent, 20 monitors with 5-minute checks, 1 basic status page
- Essentials: $24/month billed annually ($29 monthly) for 5 server agents, 50 monitors, 3 browser checks, 1 status page with custom domain, on-call and escalation policies, phone call alerts, 3 seats
- Pro: $74/month billed annually ($89 monthly) for 20 server agents, 250 monitors, 3 public or private status pages, SMS subscribers, account SAML SSO, 10 seats
- Business: $249/month billed annually ($299 monthly) for 100 server agents, 1,000 monitors, 10 status pages, white labeling, audit logs, 20 seats
Server alerting is included on all paid plans, with a 14-day free trial. Metric history depends on the plan, per the metrics reference: 1-minute precision is kept 2 days on Free, 7 days on Essentials, 14 days on Pro and 30 days on Business, and hourly rollups are kept 30 days on Free, 6 months on Essentials and 13 months on Pro and Business.
Where Hyperping falls short
No threshold alerts on metric values yet. Hyperping pages you when a server stops reporting. It doesn't open an incident when CPU passes 90% or a disk reaches 85%: you see those in the dashboard. If Zabbix triggers on disk space and load are central to how you work, keep them for now or choose Checkmk. Our guide to server monitoring alert thresholds covers which ones are worth having.
A fixed set of system metrics. No custom items, user parameters, per-process CPU and memory, container metrics, logs, APM or tracing.
No SNMP, no network devices, no self-hosted edition. Switches, routers, printers and UPS units are out of scope, and you can't run Hyperping in an air-gapped network. Zabbix is better there.
Is Hyperping right for you?
Choose Hyperping if your fleet is Linux, macOS or Windows servers rather than network gear, if you'd rather not operate the monitoring system itself, and if you currently pay for a separate paging tool and status page. SNMP-heavy estates and air-gapped sites should stay on Zabbix or look at Checkmk.
Prometheus + Grafana: Best open-source alternative for cloud-native stacks
Who Prometheus is built for
Teams running Kubernetes, containers or autoscaling groups, where hosts come and go faster than anyone can maintain Zabbix host entries. Prometheus scrapes metrics from exporters and applications, Grafana draws the dashboards, and Alertmanager routes alerts.
Notable features
- Service discovery: Targets come from Kubernetes, Consul, EC2 and other sources instead of being added by hand.
- PromQL: A query language for rates, percentiles and alert conditions over time series.
- Exporters:
node_exporterfor Linux,windows_exporterfor Windows, and exporters for databases, queues and hardware. - Alertmanager: Grouping, inhibition, silences and routing to receivers.
- Grafana dashboards: Widely used, with community dashboards for most exporters.
How much does it cost?
Prometheus (Apache 2.0) and Grafana (AGPLv3) are free to self-host. From Grafana Cloud pricing, checked September 28, 2026:
- Free: 10,000 active metric series, 50 GB of logs, 3 active users, 14-day retention
- Pro: $19/month platform fee plus usage ($6.50 per 1,000 series beyond the included 10,000), 13-month metric retention
- Grafana IRM (on-call): from $20 per active IRM user per month on Pro
Considerations
This is a stack you assemble: Prometheus, exporters, Alertmanager, Grafana, and Thanos, Mimir or VictoriaMetrics once local storage isn't enough. Every alert is PromQL you write. Prometheus has no SNMP-first workflow like Zabbix (there's snmp_exporter, but you build the config) and Alertmanager has no schedules, which is why Grafana sells IRM separately.
Who might consider Prometheus + Grafana
Choose it if your workloads are containerized and your engineers already read PromQL. For a static fleet of VMs, it's usually more machinery than Zabbix, not less. For a hosted comparison, see Datadog vs Grafana Cloud.
Checkmk: Best open-source all-rounder closest to Zabbix
Who Checkmk is built for
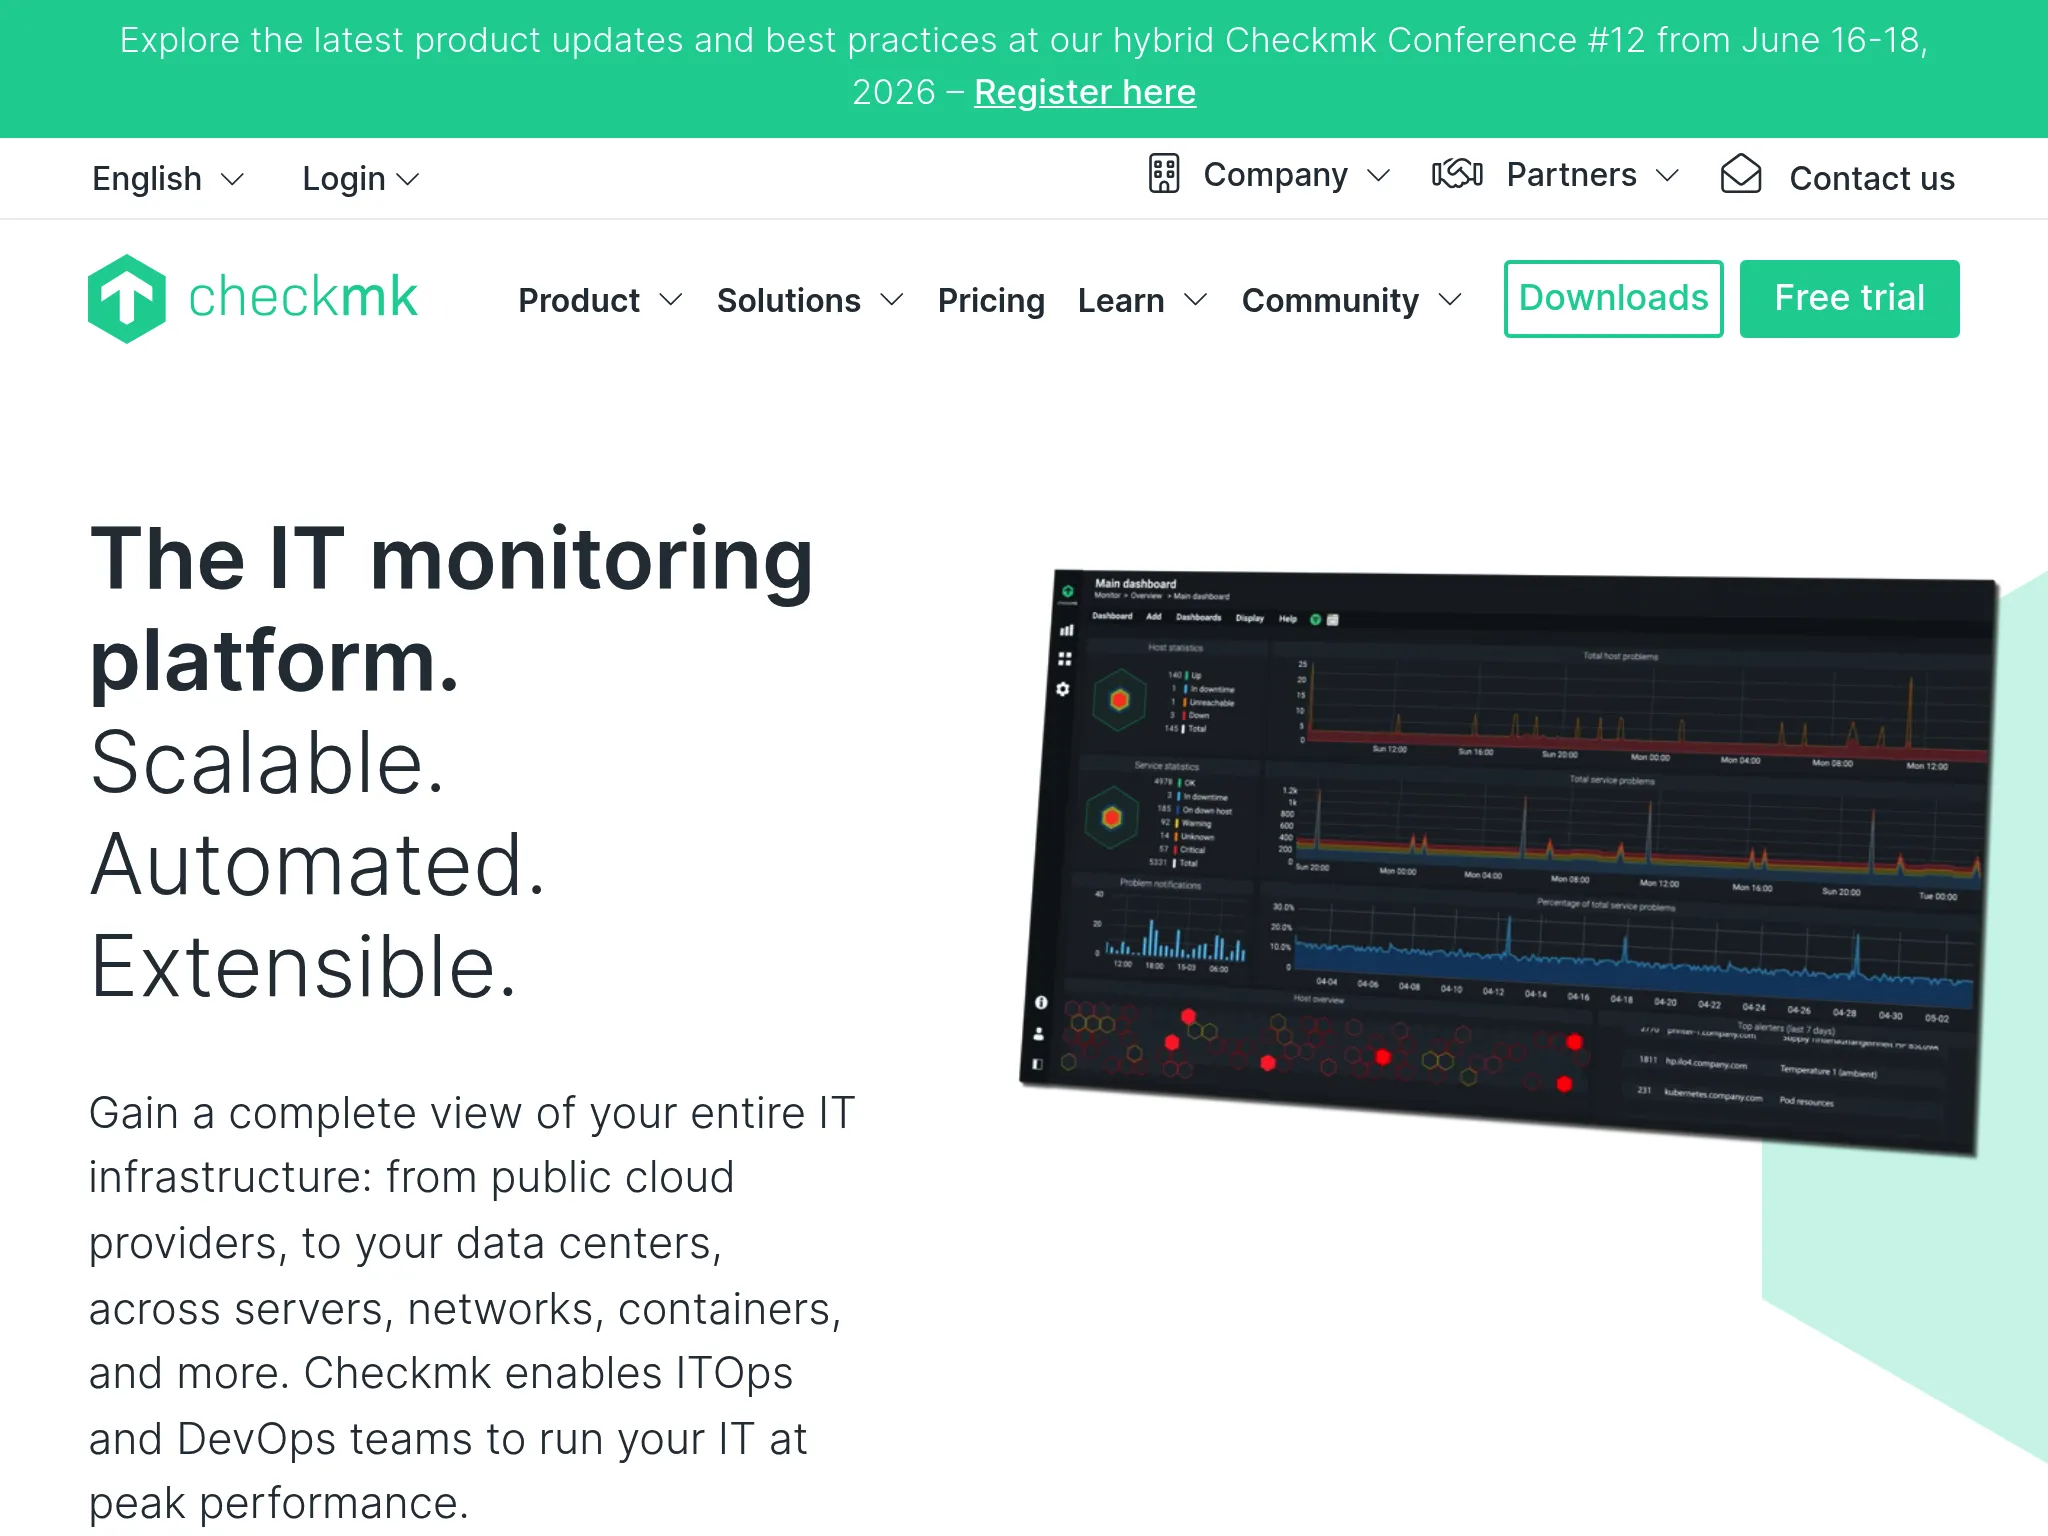
Ops teams who want what Zabbix covers (servers, network devices, SNMP, thresholds) with less hand-built configuration. Checkmk's agent discovers file systems, interfaces, services and processes on each host and turns them into checks automatically.
Notable features
- Automatic service discovery on Linux, Windows and network devices.
- Rule-based configuration in the web UI: thresholds and notification rules apply to folders and host tags, not individual hosts.
- SNMP support for switches, routers and appliances.
- Nagios plugin compatibility for custom checks.
- Checkmk Cloud if you don't want to run the server.
How much does Checkmk cost?
From the Checkmk pricing page, checked September 28, 2026 (pricing counts services, around 30 per host on average):
- Community: free and open source, positioned for up to about 100 hosts
- Pro (self-hosted): from €190/month billed annually
- Ultimate (self-hosted): from €275/month billed annually
- Checkmk Cloud (SaaS): €240/month billed annually
Considerations
The Checkmk server runs on Linux only, so you still host something unless you pay for Cloud. Service-based pricing grows with what discovery finds on each host. Notifications are rule-driven and flexible, but on-call rotations still come from an integration like PagerDuty rather than Checkmk itself.
Who might consider Checkmk
Choose Checkmk if you want to stay self-hosted and cover servers plus network gear, but spend less time writing templates. Of the tools here, it's the one a Zabbix admin will find most familiar.
Netdata: Best for per-second metrics with almost no setup
Who Netdata is built for
Engineers who want to install an agent and immediately see detailed metrics for a host, without defining items or templates. Netdata auto-detects services and collects metrics every second.
Notable features
- Per-second collection with thousands of metrics auto-detected per host.
- Dashboards with no configuration for the host and the applications it finds.
- Built-in ML anomaly detection on every metric.
- Native Windows agent alongside Linux, macOS and containers.
- Preconfigured alerts shipped with the agent.
How much does Netdata cost?
From Netdata's pricing page, checked September 28, 2026:
- Community: free, up to 5 active connected nodes and 1 custom dashboard per room
- Homelab: $90/year for unlimited nodes, non-commercial use
- Business: $4.50/node/month billed annually, with RBAC, SSO, audit logs and Netdata AI, 14-day trial
- Enterprise on-premises: from 200 nodes, pricing on request
Considerations
The agent is GPLv3, but the full experience lives in Netdata Cloud, and 5 free nodes is tight for anyone replacing Zabbix. Netdata is built for real-time troubleshooting of individual hosts more than long-term capacity planning. Alerts notify channels, but there's no on-call scheduling or status page.
Who might consider Netdata
Choose Netdata when you want deep, real-time visibility into hosts with no setup, and you're fine with a per-node subscription past 5 nodes.
Datadog: Best for full observability
Who Datadog is built for
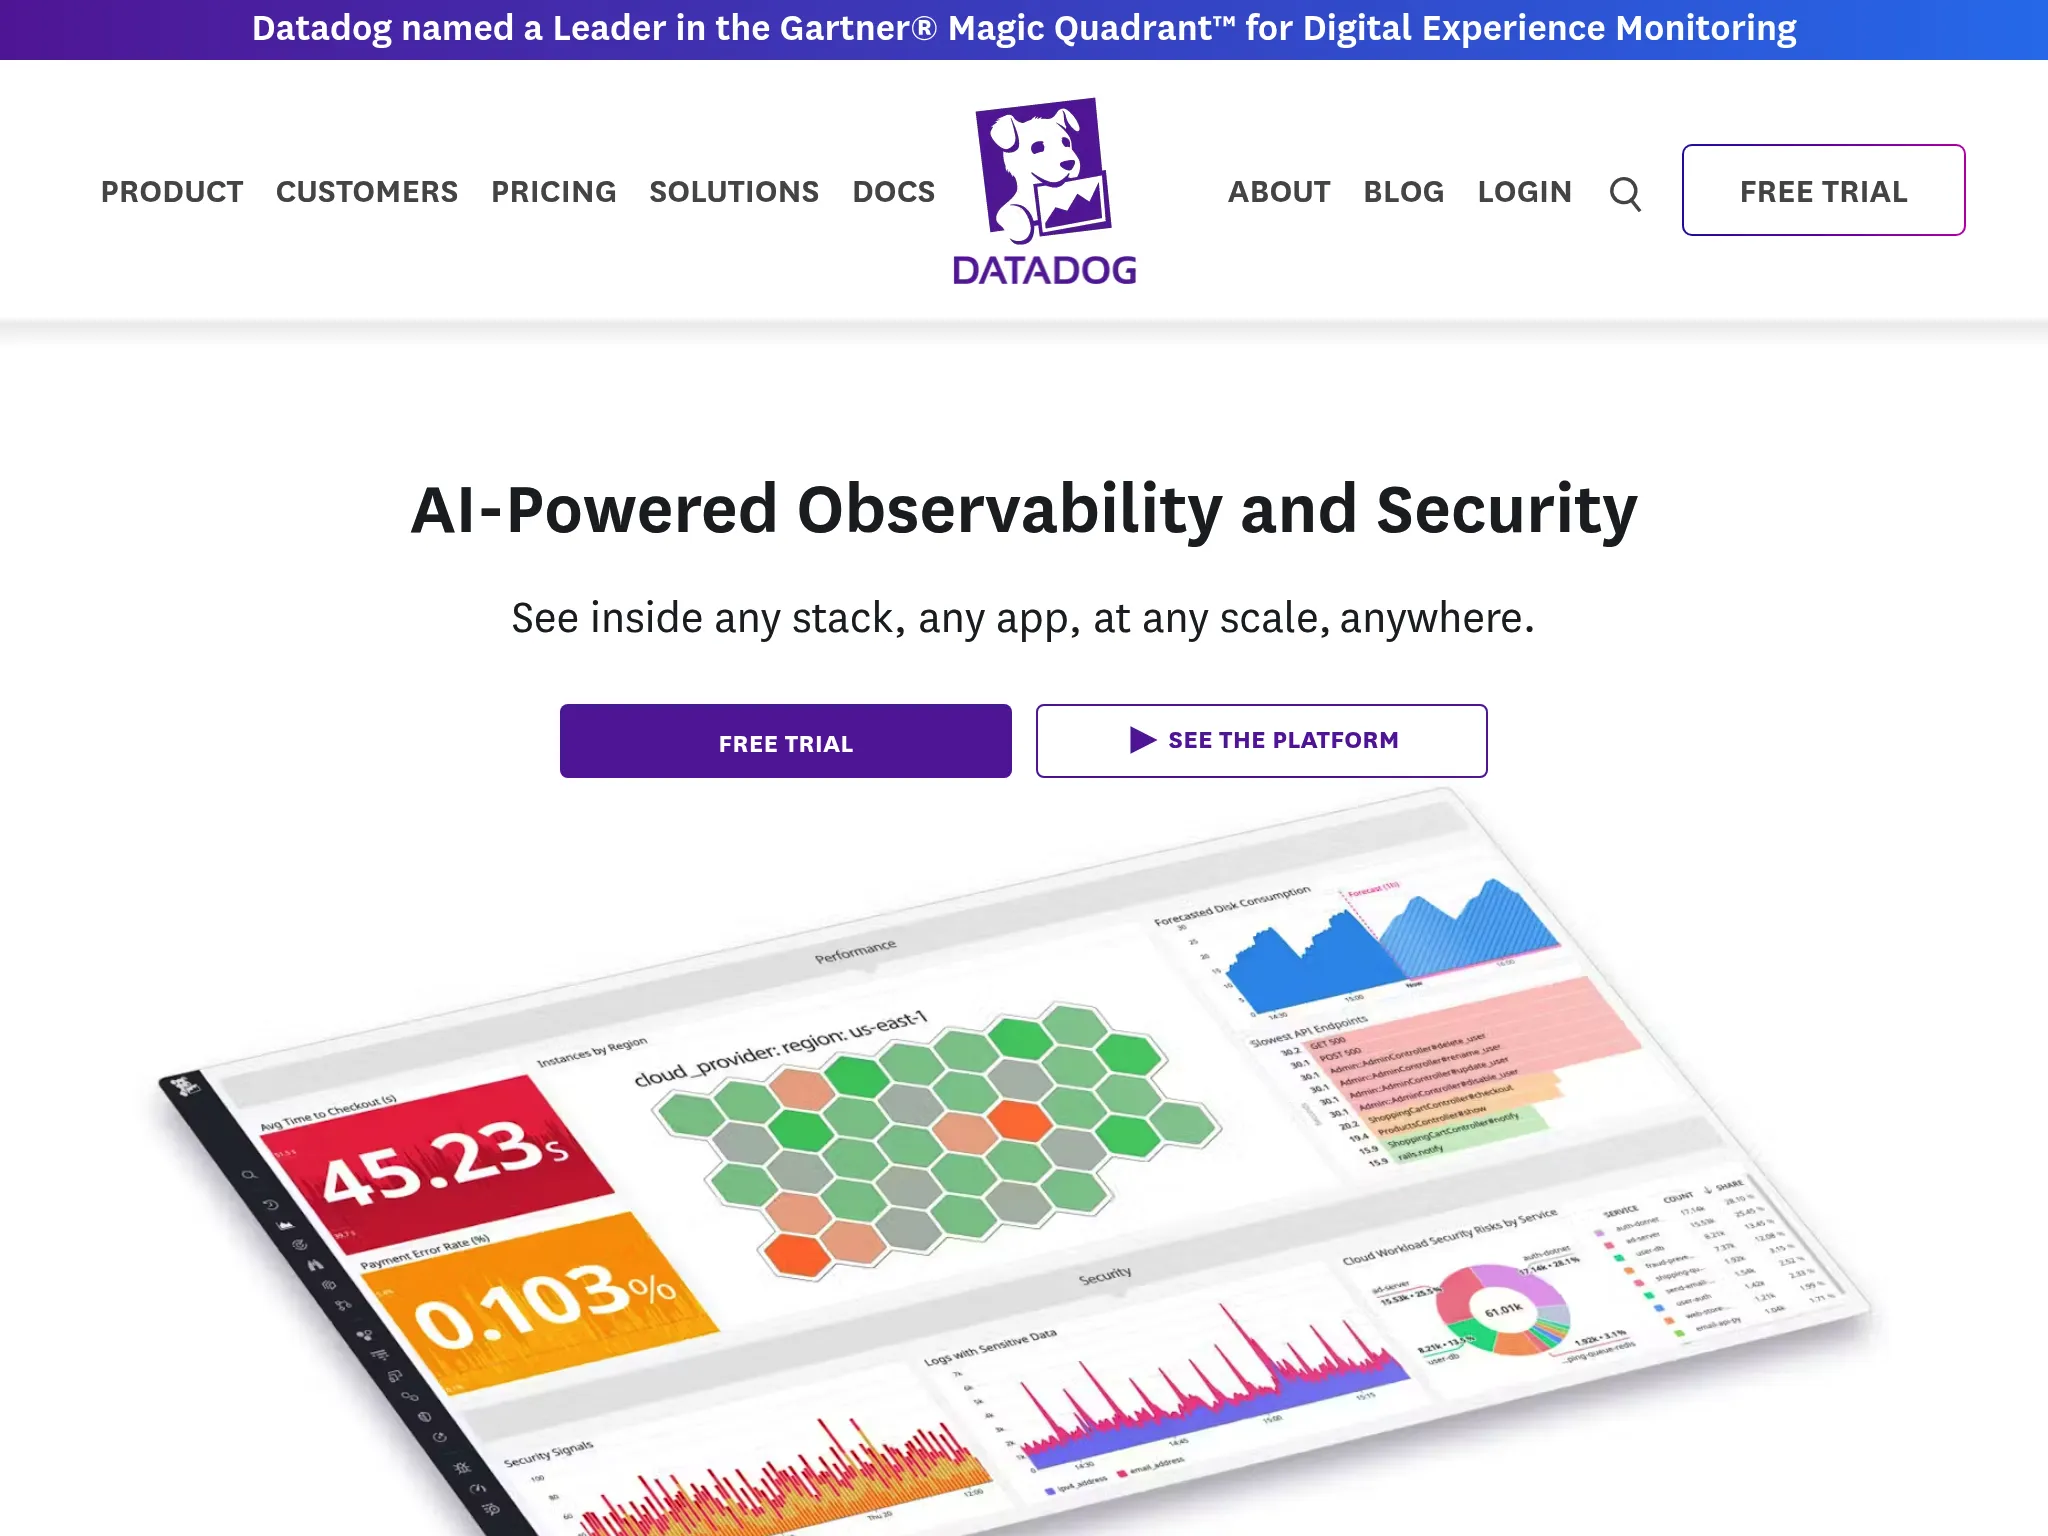
Engineering teams that need infrastructure metrics, APM, tracing, logs and synthetics correlated in one place, and have the budget for per-host, per-GB and per-seat pricing.
Notable features
- Infrastructure monitoring with 1,000+ integrations and 15-month metric retention on Pro.
- APM, logs, RUM and synthetics in the same platform.
- Datadog On-Call for schedules and escalations, sold separately.
- Native agents for Linux, Windows, macOS and containers.
How much does Datadog cost?
From Datadog's pricing page, checked September 28, 2026:
- Free: up to 5 hosts with 1-day metric retention
- Infrastructure Pro: $15/host/month billed annually, $18 on demand
- Infrastructure Enterprise: $23/host/month billed annually, $27 on demand
- APM: from $31/host/month on top
- Log management: from $0.10 per ingested GB, plus indexing
On-Call is billed per seat as a separate product. I couldn't find its price on the public pricing page on September 28, 2026.
Considerations
Datadog replaces Zabbix and several other tools at once, but the bill is the sum of hosts, custom metrics, logs, synthetic runs and seats. Teams coming from free Zabbix often find the jump hard to justify when they only need host health. Our Datadog alternative comparison and Datadog alternatives guide go through the numbers.
Who might consider Datadog
Choose Datadog if you need APM and logs next to host metrics and your team will use them. For "is the host healthy and who gets paged," you'll pay for a lot of platform you don't touch.
Site24x7: Best low-cost hosted all-in-one for small IT teams
Who Site24x7 is built for
Small IT teams and MSPs who want servers, websites and some network devices monitored from a hosted tool, at a low entry price. Site24x7 is part of Zoho's ManageEngine family.
Notable features
- Server agents for Windows and Linux, plus website, API and network monitoring from the same account.
- Network monitoring included in higher plans (10 network components on Professional).
- Log management on Professional (4 GB of ingestion included).
- MSP plans for managing several customers.
- StatusIQ, a separate Site24x7 product, for public status pages.
How much does Site24x7 cost?
From the Site24x7 pricing page, infrastructure plans, checked September 28, 2026:
- Free: free forever plan with email alerts for a small number of resources
- Lite: $9/month billed annually ($10 monthly) for 2 servers, 5 websites and 25 child resources
- Professional: $42/month billed annually ($49 monthly) for 5 servers, 1 application, 20 websites and 10 network components
- Enterprise: from $625/month billed annually
- 30-day free trial, no credit card
Considerations
The entry price is low, but plans are built from resource counts and add-ons, so the bill grows in steps as you add servers, websites and log volume. Status pages are a separate product, and on-call scheduling is basic compared to a dedicated paging tool.
Who might consider Site24x7
Choose Site24x7 if you want a hosted tool that covers servers, websites and a few network devices for a small budget, and you already work with other Zoho or ManageEngine products.
Other tools I considered
- Icinga: a good fit if you're moving from Nagios-style plugins rather than from Zabbix. Still self-hosted.
- LibreNMS: free and strong on SNMP network devices, weaker on servers and applications.
- PRTG: its core server runs on Windows, which some Windows shops prefer, but it's sensor-priced and still something you host.
When Zabbix is still the better choice
I'd keep Zabbix, or at least not replace it wholesale, in these cases:
- Large on-premises estates: thousands of hosts across sites, with Zabbix proxies collecting locally. Zabbix handles this at no license cost.
- SNMP-heavy networks: switches, routers, firewalls, UPS units and printers. None of the hosted tools here match Zabbix's SNMP templates and low-level discovery.
- Air-gapped or regulated environments where data can't leave the network.
- Custom items and trigger logic: if your team has invested years in user parameters, trend triggers and dependencies, that work doesn't port anywhere cleanly.
A common middle path: keep Zabbix for network gear and deep host metrics, and move uptime checks, paging and customer communication to a hosted tool. That removes the part that has to work at 3am from the server you maintain.
Which Zabbix alternative should you choose?
- You want nothing to host, and paging plus status pages matter most: Hyperping.
- You run Kubernetes or containers and know PromQL: Prometheus + Grafana.
- You want to stay self-hosted with servers and network gear, with less config work: Checkmk.
- You want real-time host metrics with zero setup, on a few nodes: Netdata.
- You need APM, logs and traces next to host metrics: Datadog.
- You're a small IT team or MSP on a tight budget: Site24x7.
- You're a Windows shop that doesn't want a Linux box just for monitoring: a hosted tool with a native Windows agent (Hyperping, Datadog or Site24x7). The Zabbix server itself can't run on Windows.
By budget: Checkmk Community, Prometheus and Zabbix itself are free if you have someone to run them. Among hosted tools, Hyperping Essentials ($24/month billed annually for 5 servers) and Site24x7 Lite ($9/month billed annually for 2 servers) are the cheapest entry points, while Datadog scales per host from $15/month.
How to use Hyperping instead of Zabbix
You don't need to switch everything off at once. The steps below move host liveness, uptime checks, paging and customer communication to Hyperping, while Zabbix keeps running until you trust the new setup. For more background on the metrics themselves, the Linux server monitoring guide is a good companion.
1. Install the Hyperping agent on your servers
In Hyperping, open Servers, click Add server, and copy the install command. It contains your install token. On a Linux or macOS host:
curl -fsSL https://hyperping.com/install.sh | sh -s -- \
  HP_INSTALL_xxxxx \
  --name "web-01" \
  --group web-tier
On Windows 10 or Windows Server 2016 and later, from PowerShell opened with Run as Administrator:
& ([scriptblock]::Create((irm https://hyperping.com/install.ps1))) HP_INSTALL_xxxxx `
  -Name "web-01" `
  -Group web-tier
Check that the service is running:
sudo systemctl status hp-agent.serviceThe lines to look for:
     Loaded: loaded (/etc/systemd/system/hp-agent.service; enabled)
     Active: active (running) since Mon 2026-09-28 10:14:02 UTC; 41s ago
On Windows, Get-Service hp-agent should show Running. The server appears in the dashboard with CPU, memory, disk and network charts within about 30 seconds. You can run the same command from Ansible or your configuration management across the fleet, next to the Zabbix agent, which you remove later. The install reference covers bound install tokens and re-enrollment.
2. Bind an escalation policy to each server
Open the server, go to the Alerting panel, and pick the escalation policy that should be paged when this host goes silent. Set the offline threshold: 90 seconds by default, 60 seconds minimum. Pick something longer than your worst expected network blip.
If you don't have a policy yet, create one under escalation policies: for example, Slack immediately, then a phone call to the on-call schedule after 5 minutes, then the team lead after 15. To bind the policy at install time instead, pass --policy <policy-uuid> to the install command.
Test it end to end on a non-critical server:
sudo systemctl stop hp-agent.serviceAfter the offline threshold passes, an outage opens and the policy pages its channels. Start the agent again and the recovery notification goes to the same channels.
3. Add uptime checks for the services Zabbix used to ping
List the web scenarios, simple checks (icmpping, net.tcp.service) and HTTP agent items you have in Zabbix. Recreate the ones that point at services, not host internals, as Hyperping monitors:
- Zabbix web scenarios and HTTP agent items become HTTP monitors, with expected status codes and keyword checks.
icmppingsimple checks become ping monitors.net.tcp.servicechecks on database or SMTP ports become port monitors.- Scheduled scripts that Zabbix watched through trapper items become cron heartbeats.
Monitors run every 30 seconds by default from several regions, which cuts false alarms from a single network path. Route them through the same escalation policies as your servers, so there's one place to change who gets paged.
4. Publish a status page
Create a status page, add the monitors your customers care about (API, dashboard, login), and point a custom domain at it. When an outage opens, you post the incident there and subscribers get notified by email, without a separate status page tool.
Once both systems have run side by side for a week or two and Hyperping caught what Zabbix caught, retire the Zabbix actions and checks it now covers. Keep Zabbix for network devices or custom items if you still need them.
Conclusion
Zabbix is still one of the most complete free monitoring tools, and for large on-premises estates or SNMP-heavy networks it's hard to beat. Most teams that leave aren't missing features. They're tired of running the server, the database and the templates, and of wiring a separate paging tool and status page on top.
If your workloads are containerized, Prometheus and Grafana are the natural open-source move. If you want to stay self-hosted with less configuration, Checkmk is the closest match. If you want host health, uptime checks, on-call and status pages without hosting anything, start a free Hyperping account and install the agent on one server to compare it with what Zabbix shows you today.
FAQ
What is the best free alternative to Zabbix? ▼
If you want to self-host, Checkmk Community and Prometheus with Grafana are free with no host limit, but you still run a server and a database or time series store. If you want nothing to host, Hyperping Free covers 1 server agent and 20 uptime monitors, Netdata Community covers 5 nodes, Datadog's free tier covers 5 hosts with 1-day retention, and Site24x7 has a free plan for small setups.
What are the best open-source Zabbix alternatives? ▼
Prometheus (Apache 2.0) with Grafana (AGPLv3) is the main open-source alternative for metrics-first and container workloads. Checkmk Community (GPLv2) is closest to Zabbix in scope, with agent-based auto-discovery and SNMP. The Netdata agent (GPLv3) gives per-second metrics with no configuration. Icinga and LibreNMS are also worth a look for plugin-based checks and network devices.
What is a good Zabbix alternative for Windows? ▼
The Zabbix server itself does not run on Windows: its documentation lists only Unix-like systems, so Windows shops usually run a Linux VM just for Zabbix. Hyperping, Datadog and Site24x7 are hosted, so there is no server to run at all, and all three ship native Windows agents. Checkmk and Netdata also have Windows agents, and Prometheus uses windows_exporter.
Zabbix vs Prometheus: which should I use? ▼
Zabbix fits static fleets of servers and network devices: it ships templates, SNMP polling, a web UI for configuration and threshold triggers in one package. Prometheus fits dynamic, containerized infrastructure: it discovers targets from Kubernetes or cloud APIs, stores time series efficiently and uses PromQL for queries and alerts, but you assemble the stack yourself (exporters, Alertmanager, Grafana, long-term storage).
Is Zabbix still worth it in 2026? ▼
Yes, for the right team. Zabbix 7.0 LTS has full support until June 2027, 8.0 LTS is scheduled for Q3 2026, and it remains one of the most complete free tools for large on-premises estates and SNMP-heavy networks. It is a poor fit when nobody wants to own the server, the database and the templates, or when the real need is paging the right person and informing customers.
How much does Zabbix Cloud cost compared to alternatives? ▼
Zabbix Cloud starts at $50/month for the Nano tier (50 new values per second) and goes up to $5,000/month, with 10% off on annual plans. For comparison, Hyperping Essentials is $24/month billed annually for 5 server agents and 50 monitors, Checkmk Cloud is €240/month billed annually, and Datadog Infrastructure Pro is $15 per host per month billed annually.