The best Windows server monitoring tools in 2026 are Hyperping for teams that want host metrics, uptime checks and on-call paging in one SaaS tool, PRTG for Windows-heavy IT departments that want a self-hosted console for servers and network gear, Zabbix for free open-source monitoring at scale, Datadog for full observability, SolarWinds and ManageEngine OpManager for traditional IT operations, Nagios for teams already running it, Netdata for per-second metrics, and the tools already built into Windows for a single box.
Hyperping's server agent now runs on Windows: one PowerShell command installs it as a service, and there is no monitoring server of your own to host. That is why it leads this list, and it is also a conflict of interest, so each section below says where the other tools do a better job.
In this guide you'll learn:
- How 9 tools compare on hosting, Windows setup effort, alerting and price
- Which of them are free or open source, and what "free" costs you in practice
- What Windows gives you out of the box, and the point where it stops being enough
- How to put a Windows server under monitoring with a single PowerShell command
Key takeaways
- Hyperping installs on Windows 10 and Windows Server 2016 or later with one PowerShell command, reports CPU, memory, disk, disk I/O and network every 30 seconds, and pages your on-call rotation when a server stops reporting. Free for 1 server, paid plans (which add server alerting) from $24/month billed annually with 5 server agents.
- PRTG is the Windows admin's default: its core server runs on Windows and reads WMI and performance counters without agents. Freeware covers 100 sensors; subscriptions start at $200/month billed annually for 500 sensors.
- Zabbix is free and open source with Windows agents and templates, but its server runs on Linux. Zabbix Cloud starts at $50/month if you would rather not host it.
- Datadog covers Windows services, event logs, IIS and SQL Server alongside APM and logs, from $15/host/month billed annually, with a free tier of 5 hosts and 1-day retention.
- Windows' own tools (Performance Monitor, Windows Admin Center) are free and useful for diagnosis, but they run on the server they watch, so they cannot tell you it went down.
Why you should trust this guide
I'm Léo, founder of Hyperping. I have a stake in one of these tools, and I would rather you pick PRTG or Zabbix than pick Hyperping for a job it does not do. Hyperping watches host health and liveness; it does not watch Windows services, event logs or SQL Server internals, and I say that in its section.
For each tool I read the official pricing page and product documentation on September 28, 2026, and I cross-checked what sysadmins recommend in threads like Zabbix, Nagios... vs PRTG and What do you prefer as monitoring software/system? on r/sysadmin. Where a vendor only gives prices through sales, I say so instead of guessing.
Top picks at a glance
| Best for | Tool |
|---|---|
| Windows host metrics + uptime checks + on-call paging, no server to host | Hyperping |
| Windows-heavy IT teams monitoring servers and network gear from one console | PRTG |
| Free, open-source monitoring for large mixed fleets | Zabbix |
| Metrics, logs, APM and Windows integrations in one SaaS | Datadog |
| Enterprises already on the SolarWinds platform | SolarWinds |
| Budget agentless monitoring for small IT departments | ManageEngine OpManager |
| Teams with existing Nagios checks and config | Nagios |
| Per-second metrics with little configuration | Netdata |
| Diagnosing one server by hand | Performance Monitor + Windows Admin Center |
Windows server monitoring tools compared
Prices below were checked on the vendors' sites on September 28, 2026, in USD.
| Tool | Hosting | Windows setup | Alerting | Free option | Paid from |
|---|---|---|---|---|---|
| Hyperping | SaaS | One PowerShell command, runs as the hp-agent service |
Pages on-call when a server stops reporting (paid plans). No metric threshold alerts | 1 server agent | $24/mo billed annually (5 agents) |
| PRTG | Self-hosted, core server on Windows | Install the core server, add hosts, agentless WMI | Thresholds on every sensor, notifications | Freeware, 100 sensors | $200/mo billed annually (500 sensors) |
| Zabbix | Self-hosted on Linux, or Zabbix Cloud | Linux server plus Zabbix agent 2 MSI on each host | Triggers, actions with escalation steps | Free, open source | Zabbix Cloud $50/mo |
| Datadog | SaaS | MSI agent install | Monitors on any metric, anomaly detection | 5 hosts, 1-day retention | $15/host/mo billed annually |
| SolarWinds | SaaS, or self-hosted on Windows | Agent or agentless | Threshold alerts | Trial | $15.75/node/mo (SaaS) |
| ManageEngine OpManager | Self-hosted, Windows or Linux | Agentless WMI | Threshold alerts, email and SMS | 3 devices | $95/yr for 10 devices |
| Nagios | Self-hosted on Linux | NCPA or NSClient++ agent plus config files | Check states, notifications, escalations | Nagios Core free; XI free for 7 nodes | XI $2,595 perpetual (100 nodes) |
| Netdata | Agent on each host, SaaS or on-prem control plane | MSI installer | Preconfigured alerts | Community, 5 nodes | $4.50/node/mo billed annually |
| Windows built-ins | On the server itself | Already installed | Counter alerts write to the event log or run a task | Free | Included |
Hyperping: best for Windows host metrics with uptime checks and on-call
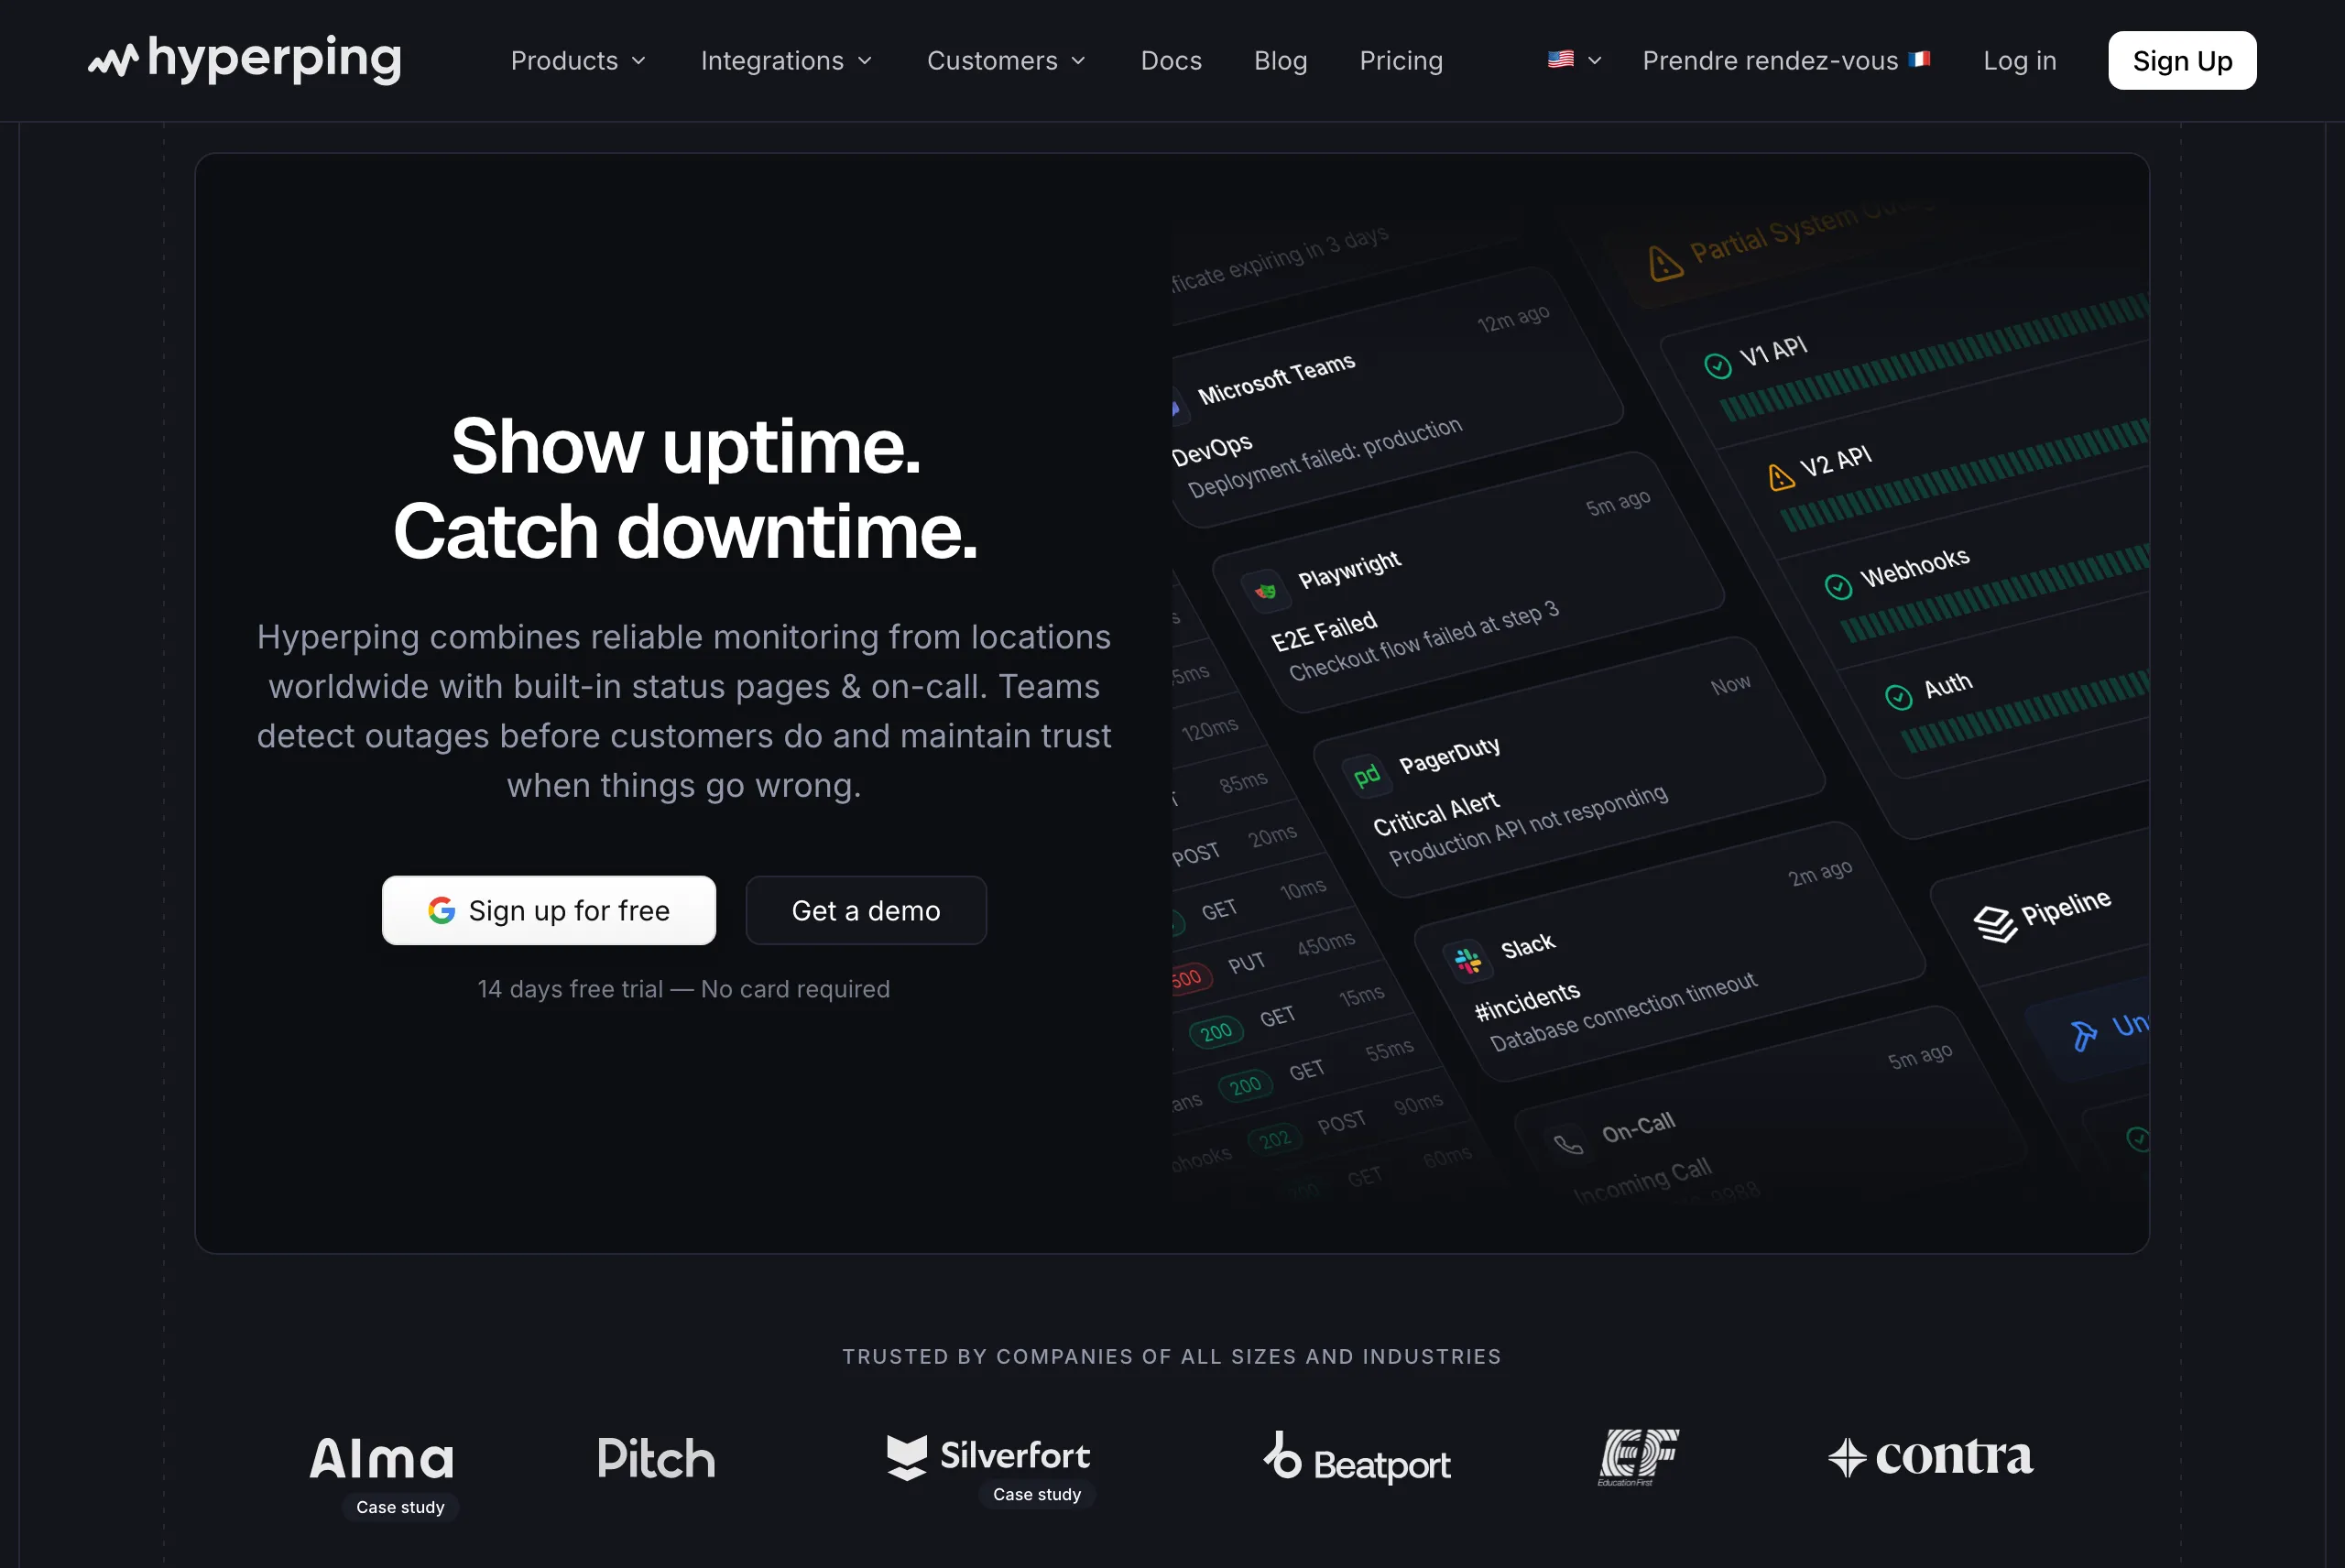
Perfect for
Small and mid-sized teams running a handful to a hundred Windows servers (IIS, SQL Server, Active Directory, file servers) next to Linux hosts and web services, who want someone paged when a box goes dark without standing up a monitoring server.
Notable features
- One PowerShell command. Run it in an Administrator PowerShell window on Windows 10, Windows Server 2016 or later (64-bit x86). It checks the download's SHA256, enrolls the host and registers the
hp-agentWindows service, which starts at boot and restarts 5 seconds after a crash. The dashboard gives you the command with your install token already filled in. - Host metrics every 30 seconds. CPU utilization, a load average derived from the processor queue length (Windows has no native load average), memory, used and free space per drive letter, disk I/O per device, network throughput per adapter, plus OS, CPU model, core count, total RAM and boot time.
- Paging when a server stops reporting. A server turns Stale after about 30 seconds without metrics and Offline once its threshold passes (default 90 seconds, minimum 60). Offline opens an outage and the escalation policy bound to the server notifies its channels: email, SMS, phone calls, Slack, Teams, PagerDuty, OpsGenie, webhooks, or an on-call schedule.
- No holes after a network cut. Unsent metrics are queued to disk in
C:\ProgramData\Hyperping\queueand sent once the host is back. - Fleet rollout.
-Name,-Policyand-Groupparameters (or the matching environment variables) let you push the same command through Group Policy, Ansible or an RMM tool. - Uptime checks and status pages in the same account. HTTP, port, ping and keyword checks from outside, plus public or private status pages.
Pricing
- Free: 1 server agent, 20 monitors with 5-minute checks, 1 basic status page
- Essentials: $24/month billed annually or $29 monthly, 5 server agents, 50 monitors, 3 seats, on-call and escalation policies, phone call alerts
- Pro: $74/month billed annually or $89 monthly, 20 server agents, 250 monitors, 10 seats
- Business: $249/month billed annually or $299 monthly, 100 server agents, 1,000 monitors, 20 seats
Server alerting is included on all paid plans. Metric history at 1-minute resolution runs from 2 days on Free to 30 days on Business, with hourly rollups kept for up to 13 months on Pro and Business. The pricing page has the full table.
Considerations
Hyperping watches the host, not what runs on it. It does not track the state of Windows services, read the event log, or collect IIS or SQL Server counters. Per-process CPU and memory and paging file usage are not ingested today either. If you need an alert the moment the MSSQLSERVER service stops, PRTG, Zabbix or Datadog do that directly; with Hyperping you would cover it from the outside with a port check on 1433.
Alerting is based on liveness: the documentation describes pages when a server stops reporting, not when a disk crosses 90%. You see disk, CPU and memory on the dashboard, but threshold alerts on those metrics are not part of the product today.
Windows on ARM and versions older than Windows Server 2016 are not supported.
Is Hyperping right for you?
Choose Hyperping if your main fear is a Windows server that dies at 2am and nobody notices until users call, and you would rather run one PowerShell command than install and patch a monitoring server. It fits best when the same team also needs uptime checks on the sites those servers host and a status page to tell customers. If you need deep Windows internals (services, event logs, performance counters of your choice), pair it with one of the tools below or pick one of them instead.
PRTG: best for Windows-heavy IT teams

Perfect for
IT departments and MSPs running mostly Windows, with switches, firewalls, printers and hypervisors to watch alongside the servers.
Notable features
- Windows-native. The PRTG core server runs on Windows 10, 11 and Windows Server 2016 through 2025, so it fits a Windows team's existing skills and tooling.
- Agentless by default. Sensors read WMI, performance counters, SNMP and HTTP remotely, including CPU load, free disk space, Windows services and event log entries.
- Auto-discovery. Scans a subnet, recognizes Windows hosts and adds a starter set of sensors.
- Maps and dashboards. A drag-and-drop map designer for NOC screens.
- Remote probes. Additional probes monitor other sites and report back to one core server.
Pricing
Paessler now lists subscriptions only, billed annually:
- Freeware: 100 sensors, about 10 devices
- PRTG 500: $200/month, about 50 devices
- PRTG 1000: $358/month, about 100 devices
- PRTG 2500: $742/month, about 250 devices
- PRTG 5000: $1,300/month; PRTG 10000: $1,642/month
A 30-day trial has no sensor limit. One license key applies per core server, so you cannot stack two small licenses.
Considerations
Sensor licensing is where PRTG gets expensive. Paessler sizes its tiers at about 10 sensors per device, and a Windows server reaches that quickly once you add CPU, memory, each disk, each service you care about and a ping. Watch more per host and PRTG 500 covers fewer than 50 devices. The core server is also one more Windows machine to patch, back up and keep alive, and if it goes down, so does your monitoring. On-call rotations and escalation to a backup person usually live in a separate paging tool.
Is PRTG right for you?
Choose PRTG if your estate is mostly Windows and network gear, your team prefers a GUI to config files, and you have somewhere reliable to run the core server. It is the tool r/sysadmin recommends most often for this profile.
Zabbix: best free and open-source option at scale
Perfect for
Teams with Linux skills that want to monitor hundreds or thousands of Windows and Linux hosts with no license cost.
Notable features
- Zabbix agent 2 for Windows, shipped as an MSI, plus official "Windows by Zabbix agent" templates covering CPU, memory, disks, network and Windows services. Event log entries can be collected with the
eventlog[]item. - Any performance counter. Item keys can read any Windows performance counter or WMI query, so you are not limited to a fixed metric list.
- Triggers and escalations. Trigger expressions over history (for example, "free space on C: below 10% for 15 minutes"), and actions with escalation steps.
- Proxies for remote sites and segmented networks.
- Releases. 7.4 is the current release and 7.0 is the long-term support version; 8.0 LTS is in pre-release and scheduled for Q3 2026.
Pricing
- Self-hosted: free and open source, no host limits
- Zabbix Cloud: from $50/month (Nano tier, 50 new values per second), up to $5,000/month; 5-day trial, 10% off with an annual subscription
- Commercial support: quoted by Zabbix
Considerations
The Zabbix server and database run on Linux, so a Windows-only team needs to learn and operate a Linux stack first. Templates, macros and triggers take real time to learn, and teams in the r/sysadmin threads above mention upgrades that broke customizations. The cost is not the license, it is the person who owns the install.
Is Zabbix right for you?
Choose Zabbix if you have someone who can own a Linux-hosted monitoring server and you want full control over what gets collected on each Windows host. Skip it if nobody on the team wants that job.
Datadog: best for full observability on Windows
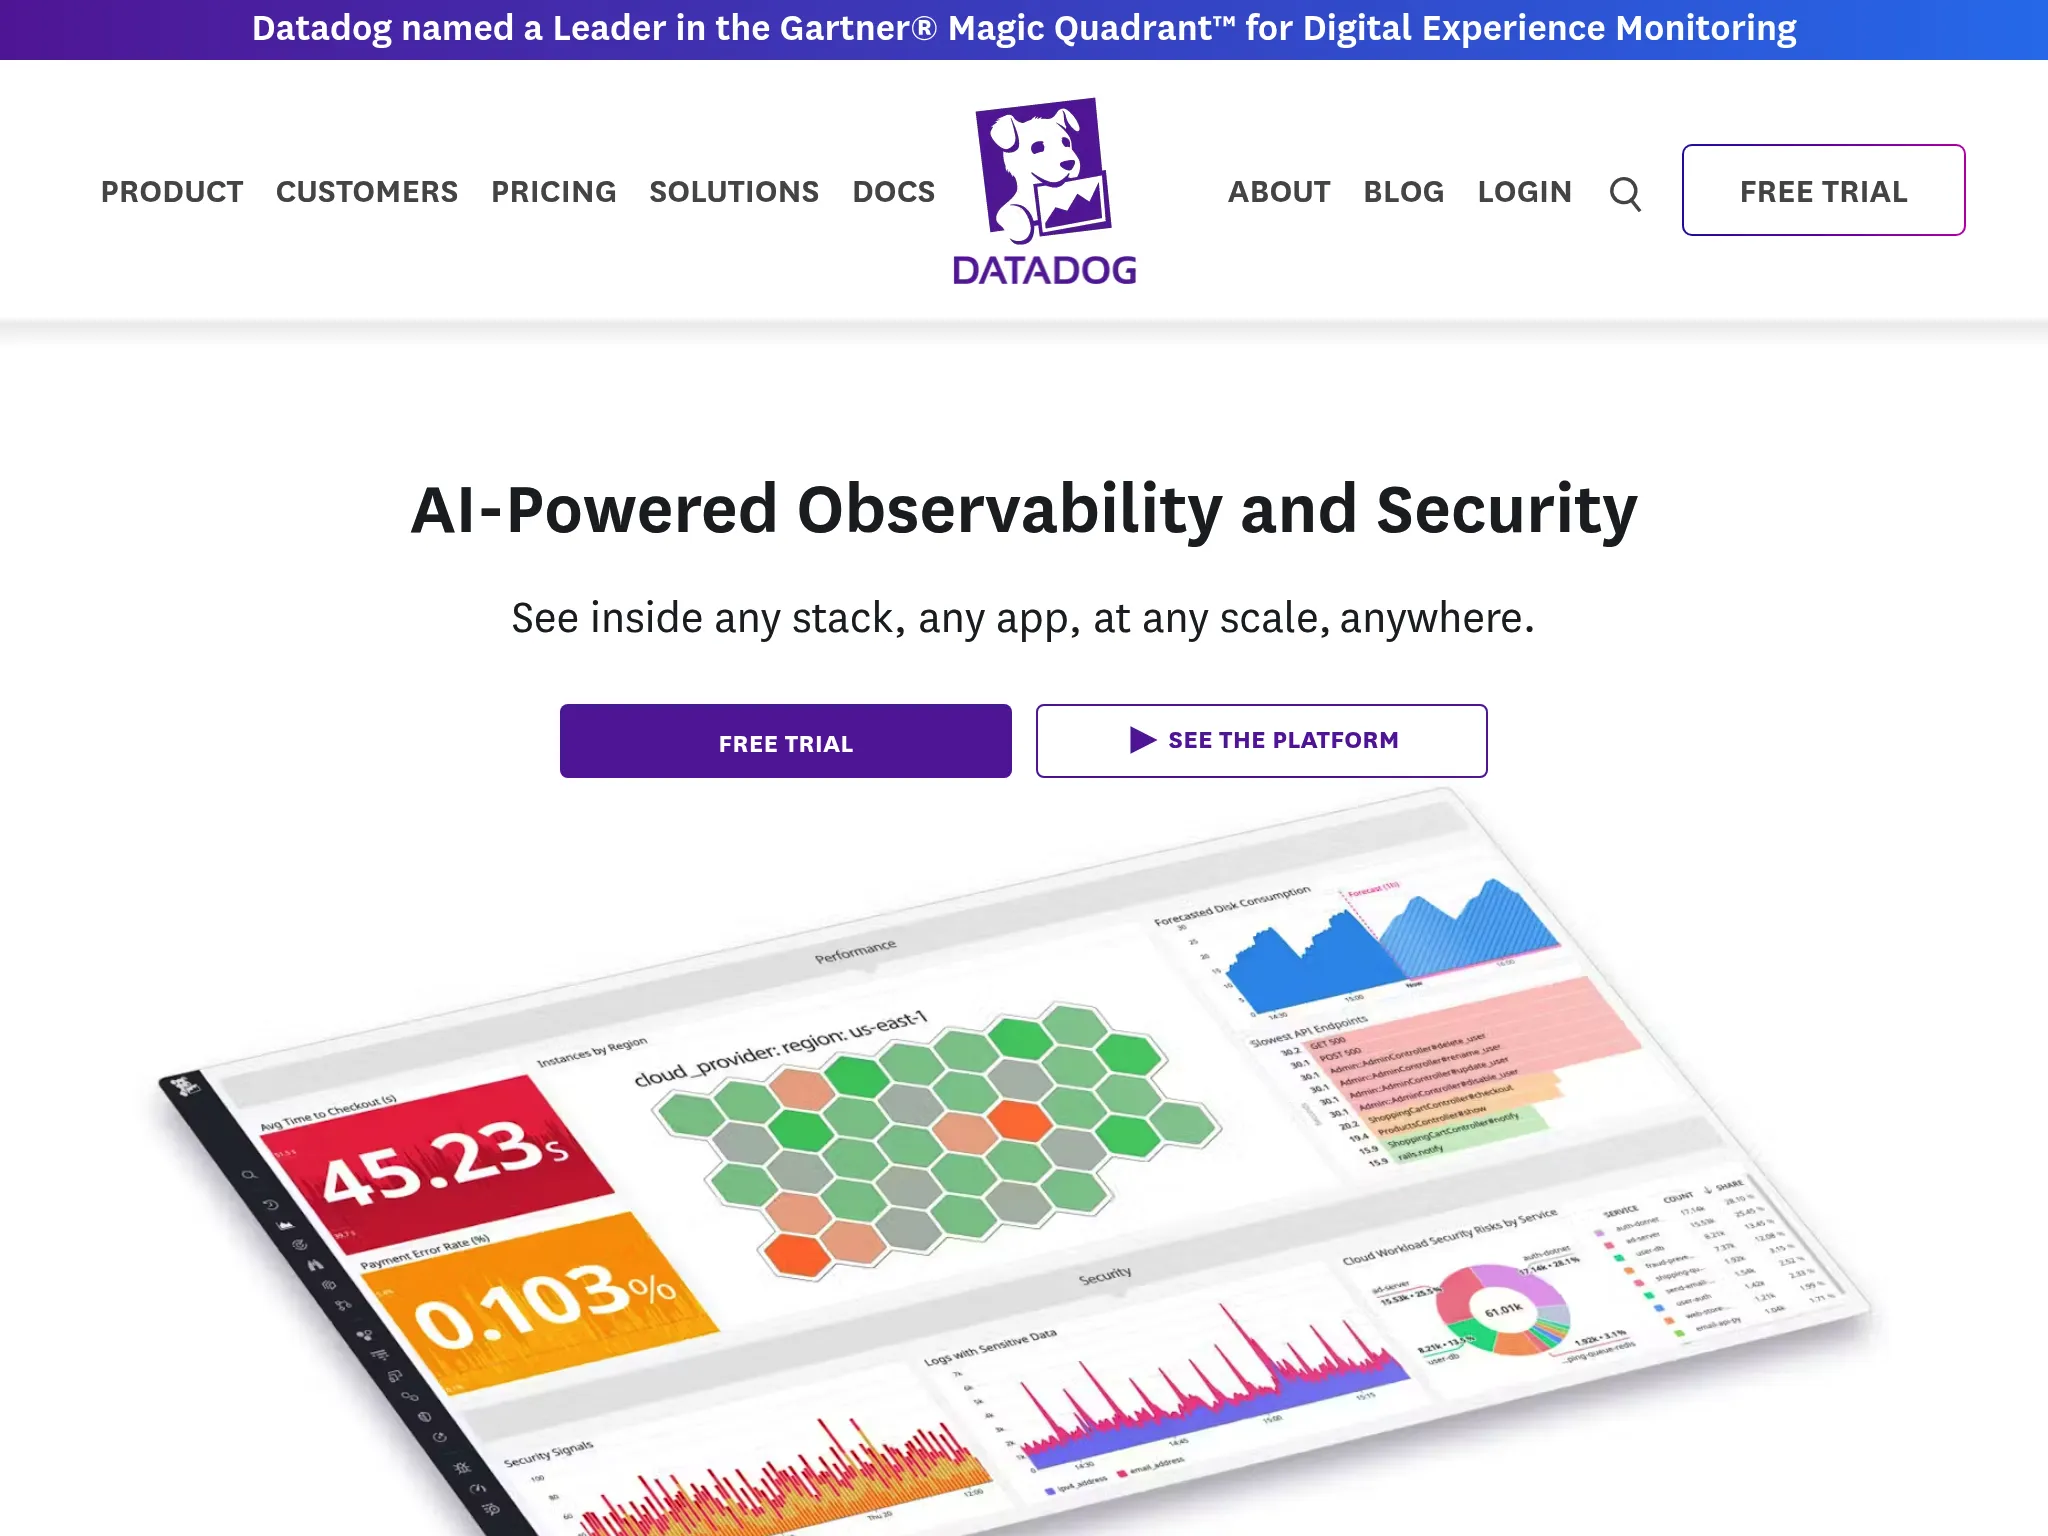
Perfect for
Engineering teams running Windows workloads (.NET services, IIS, SQL Server) inside a larger cloud stack, who need metrics, logs, traces and APM correlated in one place.
Notable features
- MSI agent installed with one
msiexeccommand and an API key, deployable through Group Policy or configuration management. - Windows integrations for Windows services, the Windows event log, WMI, IIS, SQL Server and .NET, among 1,000+ integrations.
- Monitors on any metric, with anomaly and forecast alerts, so "C: will be full in 3 days" is a supported alert.
- APM, logs and RUM on the same hosts, if you pay for them.
Pricing
- Free: up to 5 hosts, 1-day metric retention
- Pro: $15/host/month billed annually, $18 month-to-month, 15-month metric retention
- Enterprise: $23/host/month billed annually, $27 month-to-month
Logs, APM, custom metrics beyond the per-host allotment and paging are billed separately. The Datadog pricing breakdown walks through a realistic bill.
Considerations
Cost predictability is the recurring complaint. A 50-host Windows fleet is $750/month for infrastructure metrics alone on Pro, before logs or APM. Alma, a French fintech, runs Hyperping next to Datadog as a lighter backup layer. Their SRE Fabrice Gregoire told me:
"Datadog charges per check. You [Hyperping] have a package, that's better. Pay per use is annoying and expensive."
The interface is also dense for a team that just wants to know whether its servers are healthy.
Is Datadog right for you?
Choose Datadog if you need to follow an incident from a Windows host metric to the log line and the trace in one tool, and the budget is there. If you only need host health and paging, it is more tool than the job requires. See the Datadog alternative comparison for that case.
SolarWinds: best for enterprises already on the SolarWinds platform
Perfect for
Large IT organizations that already run SolarWinds for network monitoring and want servers in the same console.
Notable features
- Self-hosted Server & Application Monitor (SAM), which runs on Windows Server with a SQL Server database and ships templates for Windows, Active Directory, Exchange, IIS and SQL Server.
- SolarWinds Observability SaaS, the hosted option, covering hosts, network devices, applications, logs and databases.
- Agent or agentless collection, including WMI for Windows hosts.
Pricing
- SolarWinds Observability SaaS: Network and Infrastructure Observability from $15.75/node/month, quoted for multi-year contracts billed annually. Logs are $5/GB/month; database monitoring is $70/instance/month.
- Self-hosted SAM: quote only. Third-party price trackers put entry list prices around $3,000 for small node counts, but I could not confirm a figure on SolarWinds' site.
Considerations
The self-hosted platform is heavy: a Windows server, a SQL Server database, and module licensing that takes a sales call to size. Some security teams still ask about the 2020 Sunburst supply-chain attack during vendor reviews, so expect questions from yours.
Is SolarWinds right for you?
Choose SolarWinds if you already own other SolarWinds modules and want one pane for network and servers. For a new deployment of a few dozen Windows servers, the tools above get you monitoring faster.
ManageEngine OpManager: best budget agentless option
Perfect for
Small IT departments that want agentless Windows and network monitoring at a low yearly price and are comfortable self-hosting.
Notable features
- Installs on Windows or Linux.
- Agentless WMI monitoring of CPU, memory, disk space per partition, Windows services and processes.
- Network monitoring in the same console: switches, routers, firewalls, interface traffic.
- Threshold alerts by email and SMS, with workflows that can restart a service automatically.
Pricing
From ManageEngine's editions page, annual billing:
- Free edition: 3 devices
- Standard: from $95/year for 10 devices
- Professional: from $145/year for 10 devices
- Enterprise: from $4,595/year for 250 devices, for distributed multi-site setups
Prices rise with the device count, so request a quote for your exact number.
Considerations
The interface packs a lot of screens, and the free edition's 3 devices is more of a trial than a free tier. Like every self-hosted tool here, the OpManager server itself needs watching.
Is ManageEngine OpManager right for you?
Choose OpManager if you want PRTG-style agentless monitoring at a lower entry price and you already use other ManageEngine products.
Nagios: best if you already run it
Perfect for
Teams with an existing Nagios setup and a library of checks they do not want to rewrite.
Notable features
- Nagios Core is free and open source; Nagios XI adds a web interface for configuration, wizards and reporting.
- Windows monitoring through an agent: NCPA (Nagios Cross-Platform Agent) or NSClient++ on each Windows host.
- Thousands of community plugins, and escalation rules for notifications.
Pricing
- Nagios Core: free
- Nagios XI free: 7 nodes or 100 services, whichever comes first
- Nagios XI Standard: $2,595 perpetual for 100 nodes, $4,395 for 200 nodes; the Enterprise edition adds features on top
- 30-day XI trial with unlimited nodes
Considerations
Nagios Core runs on Linux and is configured through text files, and the r/sysadmin threads I read mostly mention it as something teams are migrating away from. Getting good Windows coverage means installing and configuring an agent on every host, then writing the checks.
Is Nagios right for you?
Choose Nagios if you already have it and it works. For a new Windows deployment, Zabbix gives you the same open-source control with better Windows templates.
Netdata: best for per-second metrics with little setup
Perfect for
Engineers who want to see what a Windows server is doing second by second, with dashboards that appear without configuration.
Notable features
- Windows agent shipped as a 64-bit MSI. Netdata recommends Windows 10, 11 or Windows Server 2019 and later, and lists support back to Windows Server 2012.
- Per-second collection and automatic dashboards.
- Preconfigured alerts out of the box, plus machine-learning anomaly detection.
- Open-source agent, with Netdata Cloud (or an on-premises version) to view many nodes together.
Pricing
- Community: free, up to 5 nodes
- Homelab: $90/year, unlimited nodes, non-commercial use
- Business: $4.50/node/month billed annually (the page advertises 25% off versus monthly)
- Enterprise On-Premises: quote, from 200 nodes
Considerations
Windows is the newer platform for Netdata, and its own docs flag that silent installs on Windows Server versions older than 2019 can fail on TLS. Per-second data is great for diagnosis, but it is a lot of data if all you want is a page when a host dies.
Is Netdata right for you?
Choose Netdata if you troubleshoot performance on Windows hosts often and want high-resolution charts without building dashboards.
Windows built-in tools: best for diagnosing one server by hand
Every Windows Server already has monitoring tools. They are free, and for a single server they answer a lot of questions.
What you get
- Task Manager and Resource Monitor (
resmon) for a live view of CPU, memory, disk and network per process. - Performance Monitor (
perfmon) to chart any performance counter and record it to disk with Data Collector Sets. - Performance counter alerts, which write an event log entry, start a data collector set or run a scheduled task when a counter crosses a threshold.
- Windows Admin Center, a free browser-based console to manage and watch one or many servers.
- PowerShell (
Get-Counter) to read counters from a script.
Read the key counters from PowerShell
This prints CPU, available memory, free space on C: and the processor queue every 5 seconds, six times:
Get-Counter -Counter '\Processor(_Total)\% Processor Time','\Memory\Available MBytes','\LogicalDisk(C:)\% Free Space','\System\Processor Queue Length' -SampleInterval 5 -MaxSamples 6Counter paths are localized: on a French or German Windows install, \Processor(_Total)\% Processor Time has a translated name, so scripts copied from English docs fail there.
Record a baseline and raise a local alert
logman creates the same Data Collector Sets as the Performance Monitor GUI. This one samples CPU and memory every 30 seconds into C:\PerfLogs:
logman create counter ServerBaseline -c "\Processor(_Total)\% Processor Time" "\Memory\Available MBytes" -si 00:00:30 -o C:\PerfLogs\ServerBaseline
logman start ServerBaseline
And this writes an event to the Application log whenever free space on C: drops below 10%, checked every 5 minutes:
logman create alert LowDiskC -th "\LogicalDisk(C:)\% Free Space<10" -si 00:05:00 -el
logman start LowDiskC
The limit of built-in tools
All of this runs on the server it watches. If the server hangs, blue-screens, loses its network or gets shut down by a botched update, the alert never fires, and the event it would have written sits in a log nobody reads. Built-in tools also stop at one machine: comparing ten servers means ten RDP sessions or a Windows Admin Center tab per host, and nobody gets paged at 2am.
That is the point where you need something outside the box. With Hyperping, the agent sends metrics every 30 seconds, and when they stop arriving, an outage opens and your on-call rotation is notified. If that is the gap you have, get paged when a Windows server stops reporting with the same agent you can install in one command.
Are built-in tools enough for you?
Keep them for diagnosis on any server. Rely on them alone only for a single non-critical machine where finding out the next morning is acceptable.
Free and open-source Windows server monitoring tools
The "best windows server monitoring tools free" and "open source" searches mix two different things: tools that are open source and free to self-host, and commercial tools with a free tier.
Open source, self-hosted
- Zabbix: the most complete open-source option for Windows, with an MSI agent and official Windows templates. Needs a Linux server.
- Nagios Core: free, with NCPA or NSClient++ on Windows hosts. Needs a Linux server and config files.
- Prometheus + windows_exporter + Grafana: windows_exporter exposes CPU, memory, logical disks, network and Windows services to Prometheus. A good fit if you already run Prometheus for Kubernetes.
- Netdata agent: open source and free to run on each host, with Netdata Cloud's free plan for up to 5 nodes.
- Checkmk: its open-source edition includes a Windows agent (MSI) and runs on Linux.
Commercial, with a free tier
- PRTG Freeware: 100 sensors, roughly 10 devices.
- Datadog: 5 hosts, 1-day retention.
- Hyperping: 1 server agent plus 20 uptime monitors. Server alerting starts on paid plans.
- ManageEngine OpManager: 3 devices.
- Nagios XI: 7 nodes or 100 services.
The real cost of free
A self-hosted monitoring server is one more server: it needs patching, backups, disk space for history and its own monitoring. If it runs in the same place as the servers it watches, a power or network failure takes out both, and you hear nothing. Pair any self-hosted stack with at least one external check that runs somewhere else.
Other tools I considered
- Azure Monitor: the natural choice if your Windows servers are Azure VMs or connected through Azure Arc. Priced by data ingested, which makes it harder to estimate for on-premises fleets.
- Site24x7: a broad SaaS with a Windows agent at a low entry price, but a crowded interface.
- Checkmk (commercial editions): strong for hybrid IT with many plugins; covered in the best server monitoring tools guide.
- LogicMonitor: requires a sales call for pricing, which ruled it out for this comparison.
How to monitor a Windows server with Hyperping
This takes about five minutes for the first server. The install reference covers every flag and troubleshooting case.
1. Add the server in the dashboard
Open the Servers view, click New server and give it a display name such as sql-prod-1. Above the install command, switch from Linux / macOS to Windows.
2. Run the PowerShell command as Administrator
Right-click PowerShell, pick Run as Administrator, and paste the command from the dashboard:
& ([scriptblock]::Create((irm https://hyperping.com/install.ps1))) HP_INSTALL_xxxxxOn Windows Server 2016, the command copied from the dashboard starts with an extra line that enables TLS 1.2, which PowerShell 5.1 does not turn on there by default. To confirm the service is running:
Get-Service hp-agent3. Check the metrics and the C: drive
Refresh the Servers view. Within about 30 seconds the server turns Online and fills in CPU, load, memory, disk I/O, network and System Info. Each drive letter is a mount point; C: is the disk shown on the server row, and other drives are listed in the Filesystems table.
4. Bind an escalation policy and tune the offline threshold
Open the server's Alerting panel, pick the escalation policy to page, and set the offline threshold: longer than your worst expected network blip, shorter than you would want to wait. The default is 90 seconds. To test it, stop the agent on a non-critical server with Stop-Service hp-agent, wait for the page, then Start-Service hp-agent to get the recovery notification.
5. Add external checks for the services on the host
The agent tells you the machine is alive. Add an HTTP check for each IIS site and a port check for services like SQL Server (1433) or RDP (3389), so you also know whether users can reach what the server runs. Link those monitors to a status page if customers depend on them.
Which Windows server monitoring tool should you choose?
- Choose Hyperping if you want Windows and Linux hosts, uptime checks, on-call paging and status pages in one SaaS tool, with no monitoring server to run.
- Choose PRTG if your estate is mostly Windows and network gear and your team wants a GUI and agentless setup.
- Choose Zabbix if you want free, open-source monitoring of every Windows service and counter and have Linux skills in-house.
- Choose Datadog if Windows hosts are part of a larger application stack and you need logs, traces and APM correlated.
- Choose SolarWinds if you already run other SolarWinds modules.
- Choose ManageEngine OpManager if you want agentless monitoring at the lowest entry price.
- Choose Nagios if you already run it and it works.
- Choose Netdata if per-second troubleshooting data matters more than long-term reporting.
- Keep Performance Monitor and Windows Admin Center for diagnosis on any single server.
By budget: at $0 with Linux skills, Zabbix; at $0 for a handful of hosts, PRTG Freeware, Netdata Community or Datadog's free tier; under $100/month for up to 20 servers with paging included, Hyperping Essentials or Pro; above that, PRTG, Datadog or SolarWinds depending on how much of the stack you need covered.
Related reading
- The Hyperping agent now runs on Windows: what the Windows agent collects and how it runs
- Best server monitoring tools in 2026: the broader comparison, Linux and cloud-native included
- Where to set server monitoring alert thresholds: picking CPU, memory and disk numbers
- Server monitoring cost calculator: compare costs for your own host count
- Server monitoring docs: install, metrics collected and alerting reference
FAQ
What is the best Windows server monitoring tool? ▼
PRTG is the most common pick for Windows-heavy IT teams that want one self-hosted console for servers and network gear. Datadog fits teams that need metrics, logs and APM together and can absorb per-host pricing. Hyperping fits small teams that want Windows host metrics, uptime checks, status pages and on-call paging in one SaaS tool, installed with a single PowerShell command.
What are the best free Windows server monitoring tools? ▼
Zabbix and Nagios Core are free and open source but need a Linux server to run on. PRTG Freeware covers 100 sensors, roughly 10 devices. Netdata's Community plan is free for up to 5 nodes, Datadog's free tier covers 5 hosts with 1-day retention, and Hyperping's free plan includes 1 server agent. Windows also ships Performance Monitor and Windows Admin Center at no extra cost.
Is there an open-source Windows server monitoring tool? ▼
Yes. Zabbix (with Zabbix agent 2 on Windows), Nagios Core (with the NCPA agent or NSClient++), the Netdata agent, and Prometheus with windows_exporter are all open source. In every case the monitoring server itself is yours to host, patch and back up, and for Zabbix and Nagios Core that server runs on Linux.
Does Windows Server have built-in monitoring? ▼
Yes. Task Manager and Resource Monitor show live usage, Performance Monitor records counters to disk and can raise counter alerts, and Windows Admin Center gives a browser view of one or many servers. None of them page a person when the server itself goes down, because they run on the machine they are watching.
How do I get alerted when a Windows server goes down? ▼
Use something that runs outside the server. An external ping, port or HTTP check catches a host that stops answering, and an agent-based tool that expects metrics every 30 seconds catches a host that stops reporting. In Hyperping, a Windows server that stays silent past its offline threshold (default 90 seconds) opens an outage and pages the escalation policy bound to it.
Agent or agentless: which is better for Windows servers? ▼
Agentless tools like PRTG and OpManager read WMI and performance counters remotely, so nothing is installed on each host, but they need Windows credentials and open remote management ports from the monitoring server. Agents like Datadog, Zabbix agent 2, Netdata or Hyperping only need outbound HTTPS or a single port, and keep collecting through short network cuts. Most fleets over a few dozen hosts end up on agents.