The best Nagios alternatives in 2026 are Hyperping (hosted server and uptime monitoring with on-call and status pages built in), Icinga (the closest open-source drop-in, same plugins), Checkmk (Nagios plugin compatibility plus auto-discovery), Zabbix (all-in-one open-source monitoring with templates), and Prometheus with Grafana (metrics-first monitoring for cloud-native stacks). I also cover Netdata, Datadog, PRTG and LibreNMS for the teams those fit better.
Nagios still works. Nagios Core 4.5.14 shipped on August 5, 2026, and plenty of teams run it without incident. People leave because of what surrounds the checks: hand-written object files, a plugin to install and update on every host, an interface that has changed little in years, and an alerting layer that stops at "send an email to this contact."
In this guide, you'll learn:
- Why teams replace Nagios, based on reviewer feedback and each tool's documentation
- Nine alternatives with pricing, hosting model, setup effort, and how each handles alerting and on-call
- Which ones are open source, which are free, and which work best with Windows hosts
- How to move the paging and customer communication part off Nagios without a big-bang migration
Key takeaways
- Icinga is the lowest-friction open-source move: it runs your existing Nagios plugins, adds a REST API and clustering, and is free with unlimited hosts.
- Checkmk keeps Nagios plugin compatibility but replaces hand-written config with agent-based service discovery and a web UI. Community is free, Pro starts at €190/month billed annually.
- Zabbix and Prometheus + Grafana are the strongest open-source platforms if you're willing to rebuild your checks from scratch rather than port them.
- Hyperping fits teams whose real problem is the pager: a Linux, macOS and Windows agent, on-call schedules, escalation policies and status pages in one hosted tool, from $24/month billed annually.
- PRTG is the pick if you want the monitoring server itself on Windows. Its core server only runs on Windows.
Why you should trust this guide
I'm Léo, founder of Hyperping. That means I have a stake in one of these tools, and Hyperping is listed first. I've tried to be precise about where it falls short, because it does not replace everything Nagios does: it has no plugin system, no SNMP polling of network gear, and no self-hosted edition.
For the other tools, I checked pricing and licensing on each vendor's official site on September 28, 2026, read Capterra reviews of Nagios Core and Nagios XI, and went through the vendors' own documentation for alerting and on-call features. Where I couldn't verify something directly, I say so.
Top picks at a glance
| Best for | Product |
|---|---|
| Hosted server monitoring with on-call and status pages included | Hyperping |
| Drop-in open-source replacement that reuses Nagios plugins | Icinga |
| Nagios compatibility with auto-discovery and web config | Checkmk |
| Free all-in-one monitoring with templates and a web UI | Zabbix |
| Metrics-first monitoring for containers and cloud-native stacks | Prometheus + Grafana |
| Per-second metrics with near-zero configuration | Netdata |
| Full observability with APM, logs and traces | Datadog |
| Windows-based monitoring server with network sensors | PRTG |
| SNMP network device monitoring with auto-discovery | LibreNMS |
Why teams leave Nagios
Nagios started life as NetSaint in 1999 and became the reference open-source monitoring tool of the 2000s. Its check model (run a small program, read the exit code, alert on 0, 1, 2 or 3) is so widespread that half the tools below still speak it. The complaints I found are about everything else.
Plugin sprawl on every host
Every check in Nagios is an external program. Checking disk space on a remote Linux host means installing NRPE or NCPA on that host, deploying check_disk and its dependencies, and keeping the versions in sync across the fleet. Windows hosts need NSClient++ or NCPA on top of that. Custom checks usually end up as Perl, Bash or Python scripts that one person wrote and nobody else understands.
On Capterra, a Nagios XI reviewer described the model as needing you to assemble a collection of test scripts, distribute them, and install their dependencies on every managed node. Multiply that by a few hundred hosts and plugin maintenance becomes a part-time job.
Configuration lives in text files
Nagios Core defines hosts, services, contacts, commands and timeperiods as objects in .cfg files. Adding a server means writing (or templating) its host and service definitions, running nagios -v to validate, and reloading. There is no discovery: nothing appears until someone adds it.
Reviewers flag this more than anything else. From Capterra reviews of Nagios Core:
"There is no auto-discovery function, every host and service must be added manually."
IT admin, computer games industry
"To make it all work, you need to have advanced knowledge of linux command line administration and the ability to modify configuration files from the command line."
Chief operating officer
Nagios XI adds a web-based Core Config Manager and configuration wizards, which removes much of this. But XI is a commercial product, and its free edition stops at 7 nodes or 100 services.
A dated interface with no built-in graphs in Core
The Nagios Core web UI is a set of CGI pages that look much as they did a decade ago. Core has no native metric graphing: teams bolt on PNP4Nagios, Graphite or Grafana to see a CPU trend. A Nagios XI reviewer on Capterra put it plainly: "The UI/UX feels a bit dated compared to modern SaaS observability platforms." XI does include performance graphs, though reviewers still describe its interface as dated.
Alerting stops at notifications
This is the gap that matters most once a team is on call. Nagios notifications are shell commands (notify-service-by-email) sent to contacts during timeperiods. Escalations exist as config objects, but there's no on-call calendar, no rotation you can edit from a phone, no overrides for a sick day, and no acknowledgement flow beyond the web UI.
So most Nagios shops wire a second tool for paging: PagerDuty, Opsgenie (which shuts down on April 5, 2027, see our Opsgenie shutdown guide), or a homegrown script. And customers still find out about outages from support tickets, because Nagios has no public status page. That's three tools, three configs and three places where an alert can get lost.
Licensing cost at scale for XI
Nagios Core is free under GPLv2. Nagios XI Standard is a one-time license starting at $2,595 for 100 nodes and $14,995 for 1,000 nodes, with the Enterprise features priced as an add-on (from $4,690 for 100 nodes). A maintenance and support plan is required to keep premium features after year one, according to the Nagios XI pricing page. One Capterra reviewer summed it up: "License cost is very high."
Quick comparison: Nagios alternatives
| Tool | Starting price | Hosting | Setup effort | Alerting and on-call | Windows hosts |
|---|---|---|---|---|---|
| Hyperping | Free; $24/mo billed annually | Hosted (SaaS) | Low: one command per host | On-call schedules, escalation policies, phone/SMS/Slack/Teams, status pages included | Native agent (Windows 10 / Server 2016+) |
| Icinga | Free; subscriptions from $2,000/yr | Self-hosted | Medium to high | Rule-based notifications; schedules in Icinga Notifications (beta) | Icinga for Windows (PowerShell) |
| Checkmk | Free Community; Pro from €190/mo billed annually | Self-hosted or Cloud | Medium | Rule-based notifications; paging through integrations | Native agent |
| Zabbix | Free; Cloud from $50/mo | Self-hosted or Cloud | Medium to high | Actions with escalation steps; no on-call calendar | Native agent |
| Prometheus + Grafana | Free; Grafana Cloud Pro $19/mo + usage | Self-hosted or Grafana Cloud | High | Alertmanager routing; Grafana IRM for on-call ($20/active user) | windows_exporter |
| Netdata | Free (5 nodes); Business $4.50/node/mo | Agent + Netdata Cloud or on-prem | Low | Alert notifications; no on-call scheduling | Native agent |
| Datadog | Free (5 hosts); $15/host/mo annual | Hosted (SaaS) | Low to medium | Monitors + separate On-Call product ($20/seat) | Native agent |
| PRTG | Free (100 sensors); $200/mo billed annually | Self-hosted (Windows) or PRTG Hosted Monitor | Medium | Notification triggers; no on-call scheduling | Core server is Windows-only |
| LibreNMS | Free | Self-hosted (Linux) | Medium | Alert rules to email, Slack and more; no on-call | SNMP |
Hyperping: Best for hosted monitoring with on-call and status pages built in
Who Hyperping is built for
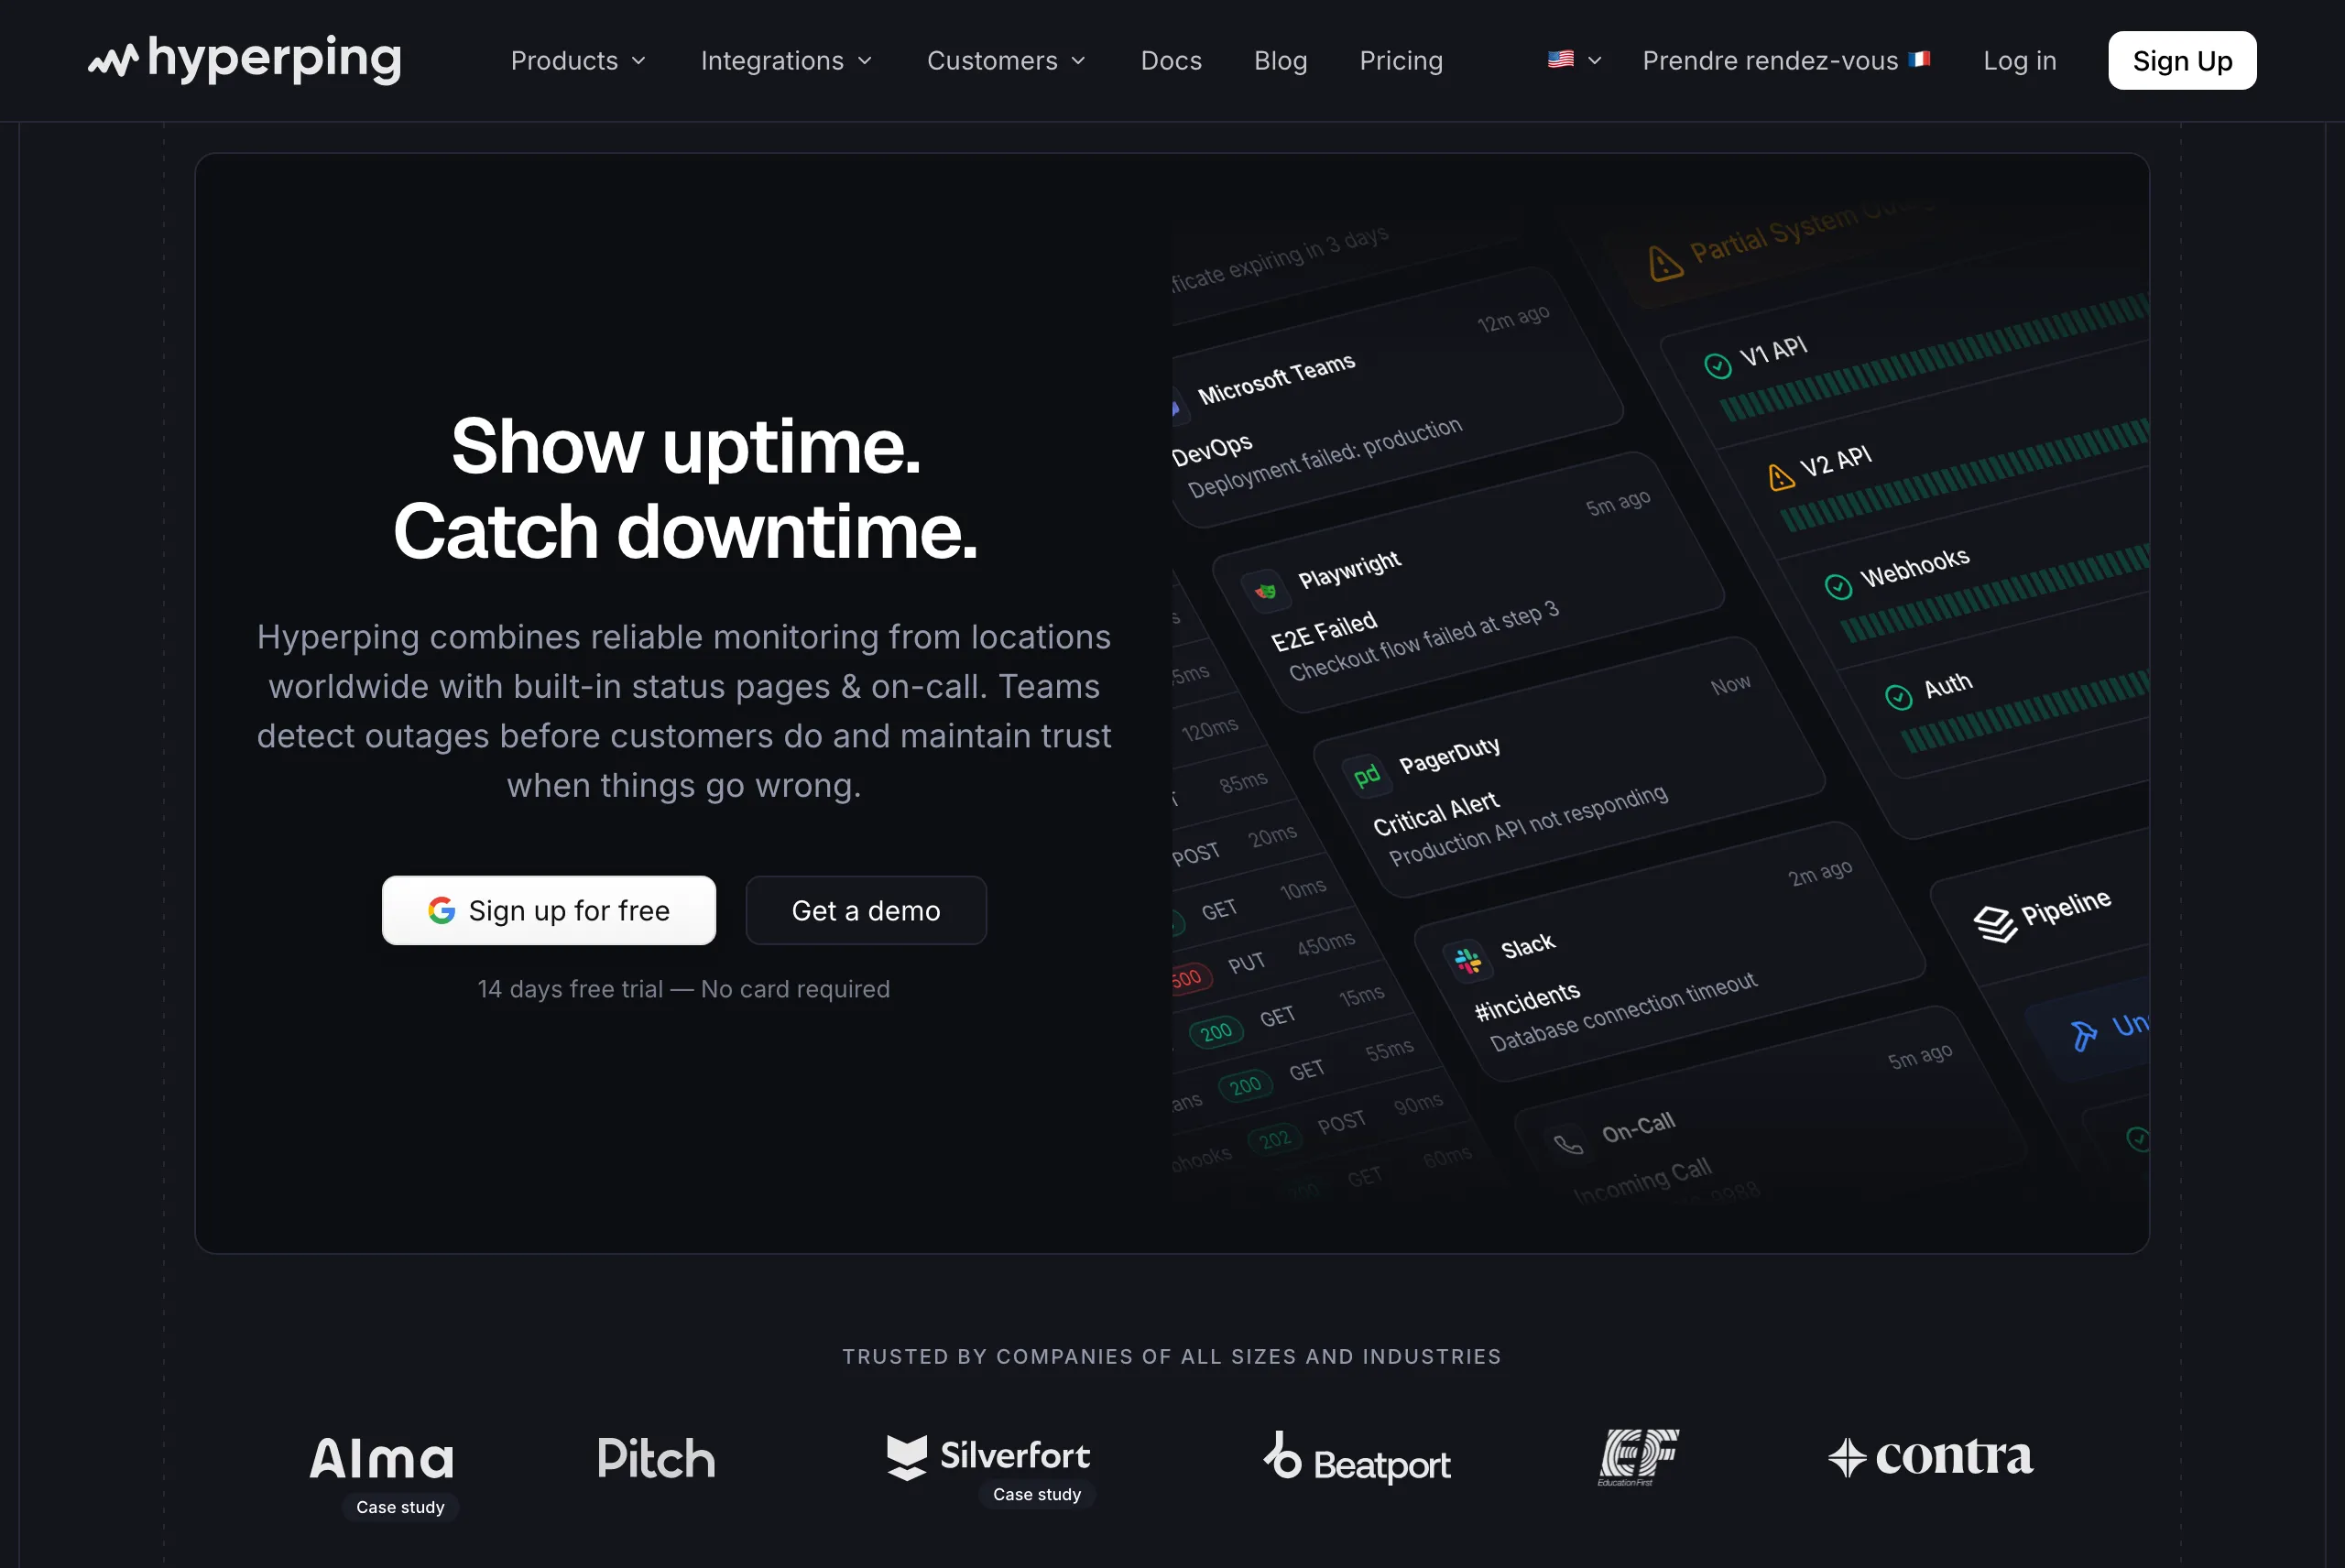
Teams running a few to a few hundred servers who want to stop maintaining the monitoring server itself, and whose biggest gap is what happens after a check fails: who gets paged, what happens if they don't answer, and how customers hear about it.
Hyperping is not a like-for-like Nagios replacement. It doesn't run Nagios plugins or poll switches over SNMP. It covers the part of a Nagios setup that most small and mid-size teams actually use (is the host alive, is it running out of CPU, memory or disk, is the service answering) and adds the paging and status page layer Nagios never had.
Notable features
- One-line agent for Linux, macOS and Windows: A single install command registers a systemd, launchd or Windows service. It runs on amd64 and arm64 (amd64 on Windows), targets around 50 MB of memory, and needs outbound HTTPS only. Details are in the agent install reference.
- Host metrics every 30 seconds: CPU utilization with 1, 5 and 15-minute load averages, memory used and available, filesystem usage per mount point, disk I/O per device, and network bytes per interface, plus host metadata (OS, kernel, CPU model, uptime). The full list is in metrics collected.
- No config files to write: The server appears in the dashboard with its metrics about 30 seconds after the install. Flags like
--name,--policyand--grouplet Ansible or Terraform enroll a fleet with the right escalation policy from the first run. - Offline detection that pages on-call: When a server stops reporting for longer than its offline threshold (90 seconds by default, 60 seconds minimum), an outage opens and the escalation policy bound to that server pages its channels: email, SMS, phone calls, Slack, Teams, PagerDuty, OpsGenie, webhooks or an on-call schedule. Recovery notifications go to the same channels.
- On-call schedules and escalation policies: Included from the Essentials plan, shared between server monitoring and uptime monitors. See on-call.
- Uptime monitors: HTTP, port, ping and keyword checks against your services from outside your network, the same job as Nagios
check_httpandcheck_tcppointed at your public endpoints. - Status pages: One status page with a custom domain on Essentials, three public or private pages on Pro, with email subscribers (and SMS subscribers from Pro). See status pages.
- Metrics survive network blips: The agent queues unsent data on disk and retries, so a short ingest outage or reboot doesn't leave holes in your graphs.
Why choose Hyperping over Nagios?
Nothing to host, patch or back up
Nagios needs a server, a web server, a set of plugins, and someone to upgrade them. Hyperping's agent is the only thing on your hosts, and the monitoring side is hosted. If your Nagios box goes down, you lose monitoring and alerting at the same time. That failure mode goes away.
Paging and rotations are part of the product
In Nagios, a rotation means editing contacts and timeperiods and reloading. In Hyperping, you define a schedule and an escalation policy once, and servers, uptime monitors and status pages all route through them. Each step of the policy has its own delay and channels, so a page that goes unanswered moves on to the next person. Our escalation policies guide and on-call rotations guide cover how to design them.
Customers hear about incidents from you
Nagios has no status page. With Hyperping, the incident that paged your engineer can be posted to a branded status page that emails subscribers, without a second tool.
If your Nagios setup has shrunk to "tell me when a box dies and wake the right person," and the PagerDuty bill plus the Nagios upkeep costs more than the checks are worth, that's the point where it makes more sense to get paged when a server goes silent without running a monitoring server than to keep maintaining the stack yourself.
What actual Hyperping users say
"We made our Hyperping status page publicly available and it became a crucial part of our sales pitches. We are proud of our uptime and we love that we can share it with prospects and customers in such an easy way."
How much does Hyperping cost?
- Free: 1 server monitoring agent, 20 monitors with 5-minute checks, 1 basic status page
- Essentials: $24/month billed annually ($29 monthly) for 5 server agents, 50 monitors, 3 browser checks, 1 status page with custom domain, on-call and escalation policies, phone call alerts, 3 seats
- Pro: $74/month billed annually ($89 monthly) for 20 server agents, 250 monitors, 3 public or private status pages, SMS subscribers, account SAML SSO, 10 seats
- Business: $249/month billed annually ($299 monthly) for 100 server agents, 1,000 monitors, 10 status pages, white labeling, audit logs, 20 seats
Server alerting is included on all paid plans, and there's a 14-day free trial. Metric history depends on the plan: 7 days at 1-minute resolution and 6 months hourly on Essentials, up to 30 days at 1-minute and 13 months hourly on Business.
Where Hyperping falls short
No threshold alerts on metric values yet. Hyperping pages you when a server stops reporting. It does not currently alert when CPU crosses 90% or a disk hits 85%: you see those in the dashboard, but they don't open an incident. If Nagios check_disk warnings are central to how you work, keep them running for now or pick Checkmk or Zabbix.
No plugins or custom checks on the host. You can't point Hyperping at a Nagios plugin, a RAID controller check or a custom script. The agent collects a fixed set of system metrics.
Metrics it doesn't ingest today: per-process CPU and memory, swap usage, packet errors and disk operation counts.
No SNMP, no network devices, no self-hosted edition. Switches, routers, printers and UPS units are out of scope, and there's no way to run Hyperping inside an air-gapped network. LibreNMS, PRTG or Zabbix are better fits there.
Is Hyperping right for you?
Choose Hyperping if your fleet is Linux, macOS or Windows servers rather than network gear, if nobody wants to own the Nagios box anymore, and if you're currently paying for a separate paging tool and status page. Teams with deep plugin investments or SNMP-heavy estates should look at Icinga, Checkmk or LibreNMS first.
Icinga: Best drop-in open-source replacement
Who Icinga is built for
Teams with years of Nagios configuration and custom plugins who want a modern engine without rewriting their checks. Icinga began as a Nagios fork in 2009, and Icinga 2 was rebuilt with its own configuration language while staying compatible with the Nagios plugin API.
Notable features
- Runs Nagios plugins unchanged: Your
check_*scripts and Monitoring Plugins keep working. - Cleaner configuration DSL: Apply rules assign services to hosts by attribute, so one rule replaces hundreds of service definitions.
- Icinga Director: A web interface for configuration, with imports from CMDBs and cloud APIs.
- REST API and native clustering: Distributed monitoring across zones and satellites without add-ons.
- Icinga for Windows: A PowerShell-based framework for monitoring Windows hosts.
- Icinga Notifications: A newer component with schedules built from rotations and escalations triggered by incident age or severity. As of its 0.2.0 release (November 2025) it was still labelled beta.
How much does Icinga cost?
The open-source edition is free with unlimited hosts and services. Paid subscriptions from Icinga's subscription page:
- Module subscription: $2,000/year (€2,000 in Europe) for enterprise modules
- Repository subscription: $5,000/year for RHEL, SLES and Amazon Linux packages
- Support subscription: from $15,000/year, bundling modules and repository access
Considerations
Icinga removes the worst of Nagios's config pain, but you still host, scale and upgrade everything: the core, the database, the web stack and Director. Notification schedules only arrived recently and in beta, so most Icinga teams still pipe alerts into a separate paging tool. There's no public status page.
Who might consider Icinga
Choose Icinga if your checks are your main asset and you want to keep every one of them while getting a better engine, API and UI. It's the smallest step away from Nagios.
Checkmk: Best for Nagios compatibility with auto-discovery
Who Checkmk is built for
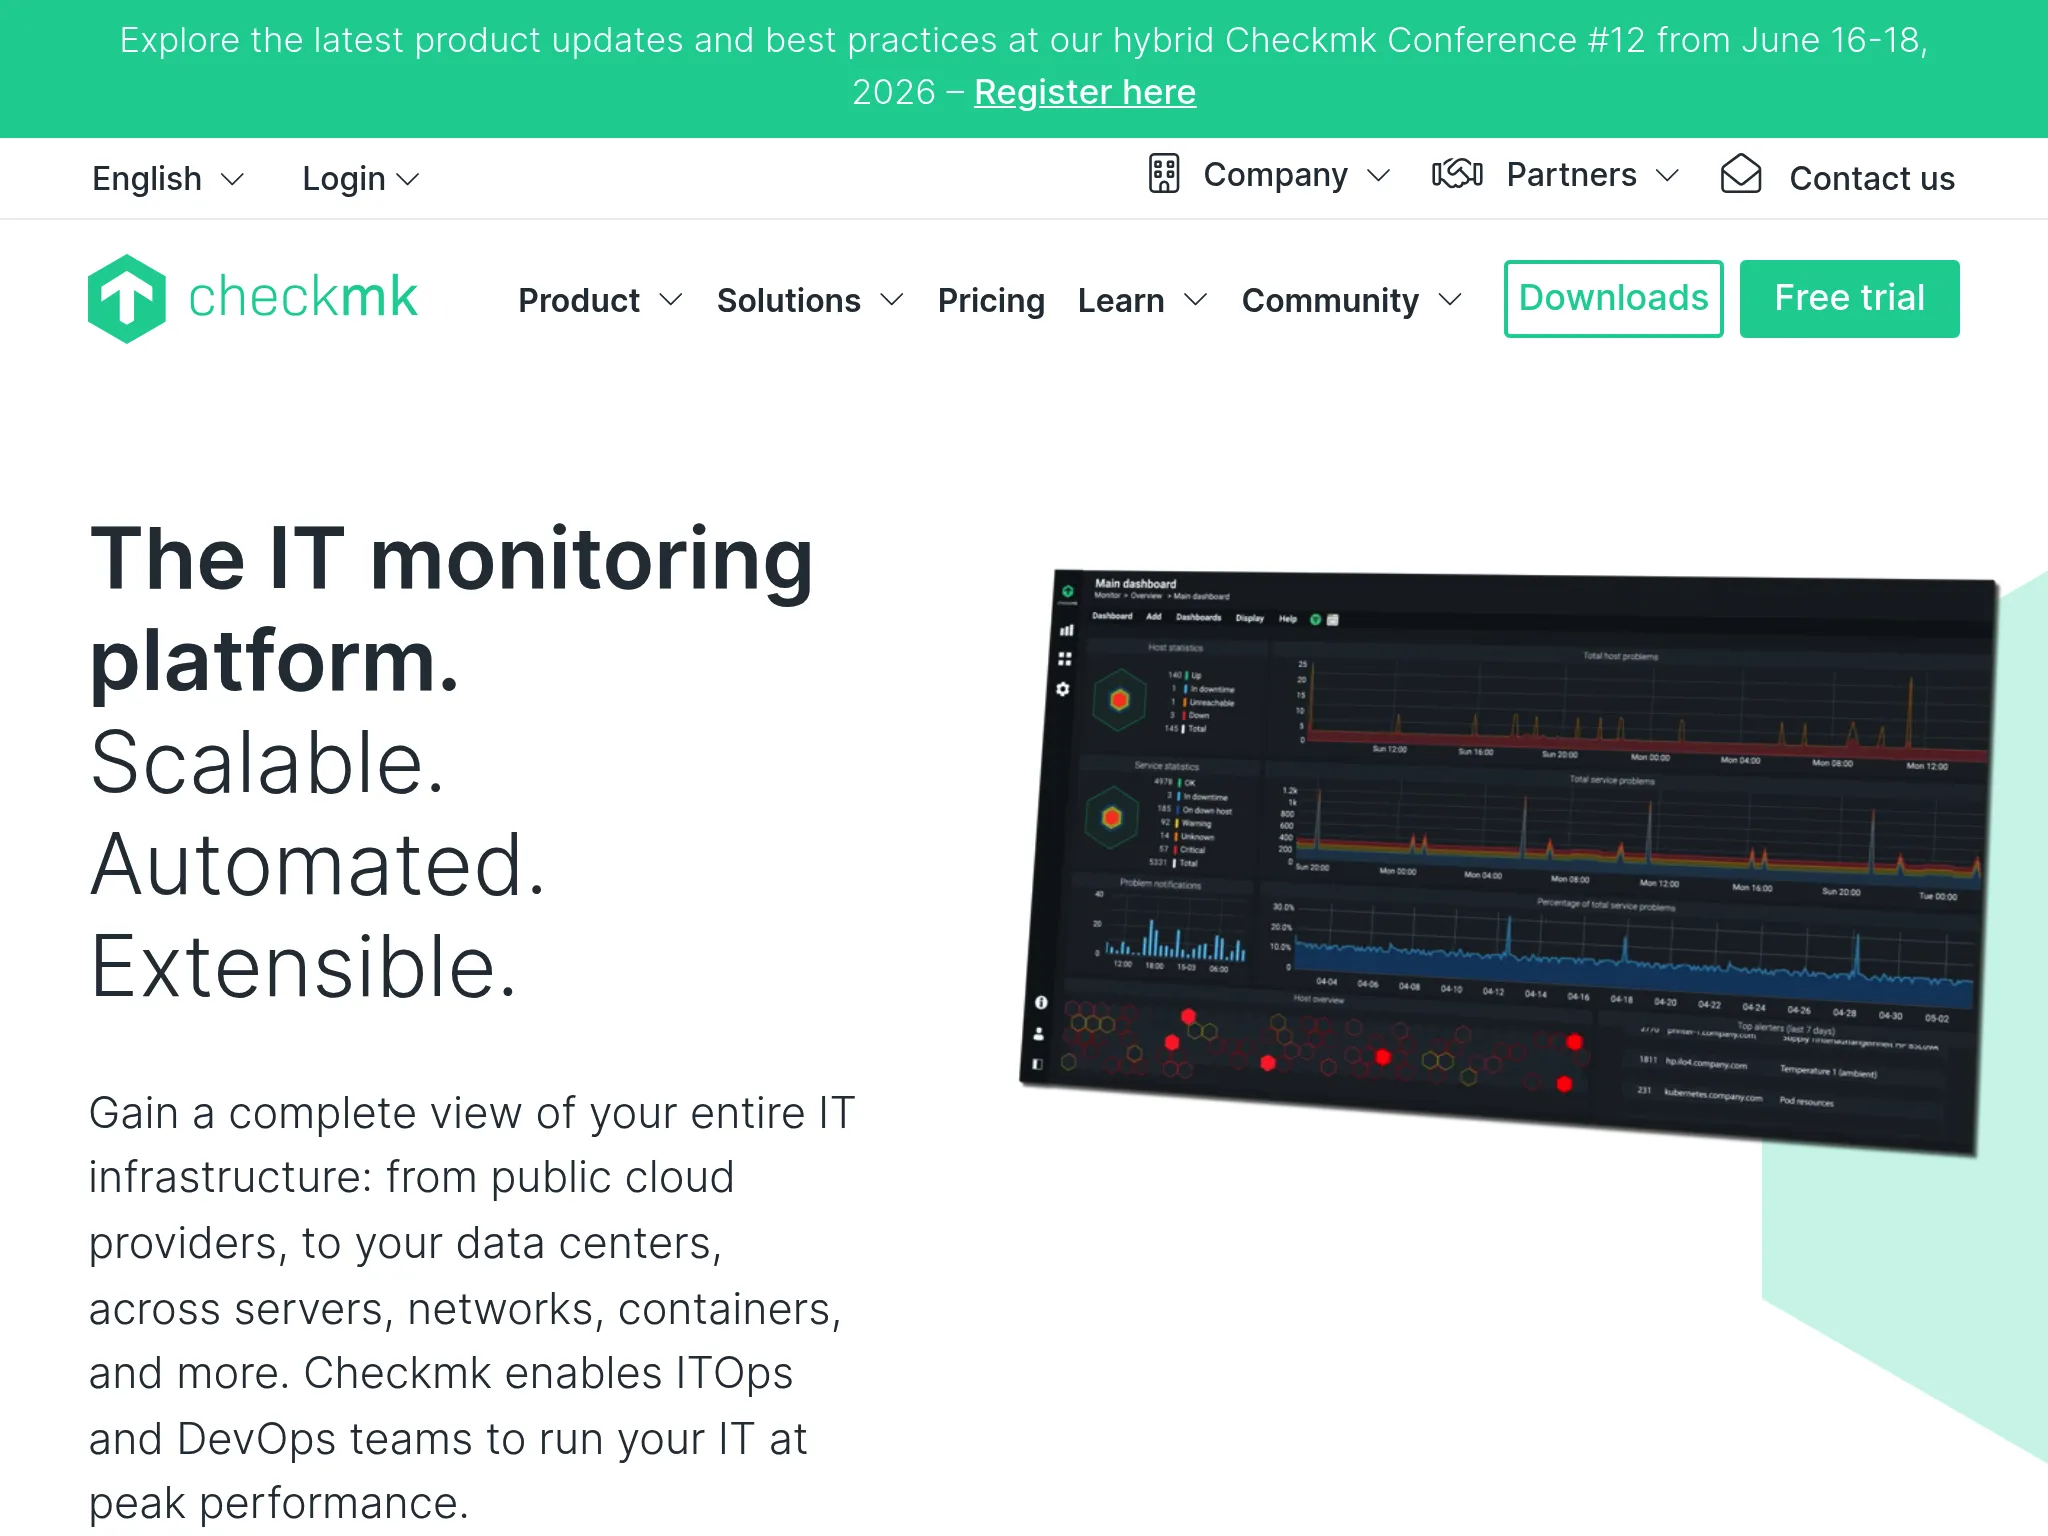
Ops teams that like Nagios's check model but are tired of writing config. Checkmk grew out of the Nagios ecosystem, and its free edition has long used the Nagios core as its engine. Its agents discover services on each host automatically.
Notable features
- Automatic service discovery: Install the agent, run discovery, and file systems, interfaces, services and processes show up as checks.
- Rule-based web configuration: Thresholds and notification rules are set in the UI and apply to folders or host tags instead of individual objects.
- Nagios plugin support: Existing plugins run as "classical" checks alongside Checkmk's own.
- Native agents for Linux and Windows, plus SNMP for network devices.
- Checkmk Cloud: A managed SaaS edition if you don't want to run the server.
Starting with version 2.5, the editions were renamed: Raw is now Community, Enterprise is Pro, and Cloud is Ultimate, with a separate hosted Checkmk Cloud.
How much does Checkmk cost?
From the Checkmk pricing page, with service-based pricing (roughly 30 services per host):
- Community: free and open source, positioned for up to about 100 hosts
- Pro (self-hosted): from €190/month billed annually
- Ultimate (self-hosted): from €275/month billed annually
- Checkmk Cloud (SaaS): €240/month billed annually
Considerations
Service-based pricing means your bill grows with the number of things discovered on each host, not just host count. The Checkmk server runs on Linux only. Notifications are powerful but rule-driven, and on-call rotations still come from an integration like PagerDuty or ilert rather than Checkmk itself.
Who might consider Checkmk
Choose Checkmk if you want to keep the Nagios way of thinking (states, checks, thresholds, plugins) with far less hand-written configuration. For mixed Linux, Windows and network estates of 50 to several thousand hosts, it's the most complete upgrade path from Nagios.
Zabbix: Best free all-in-one platform
Who Zabbix is built for
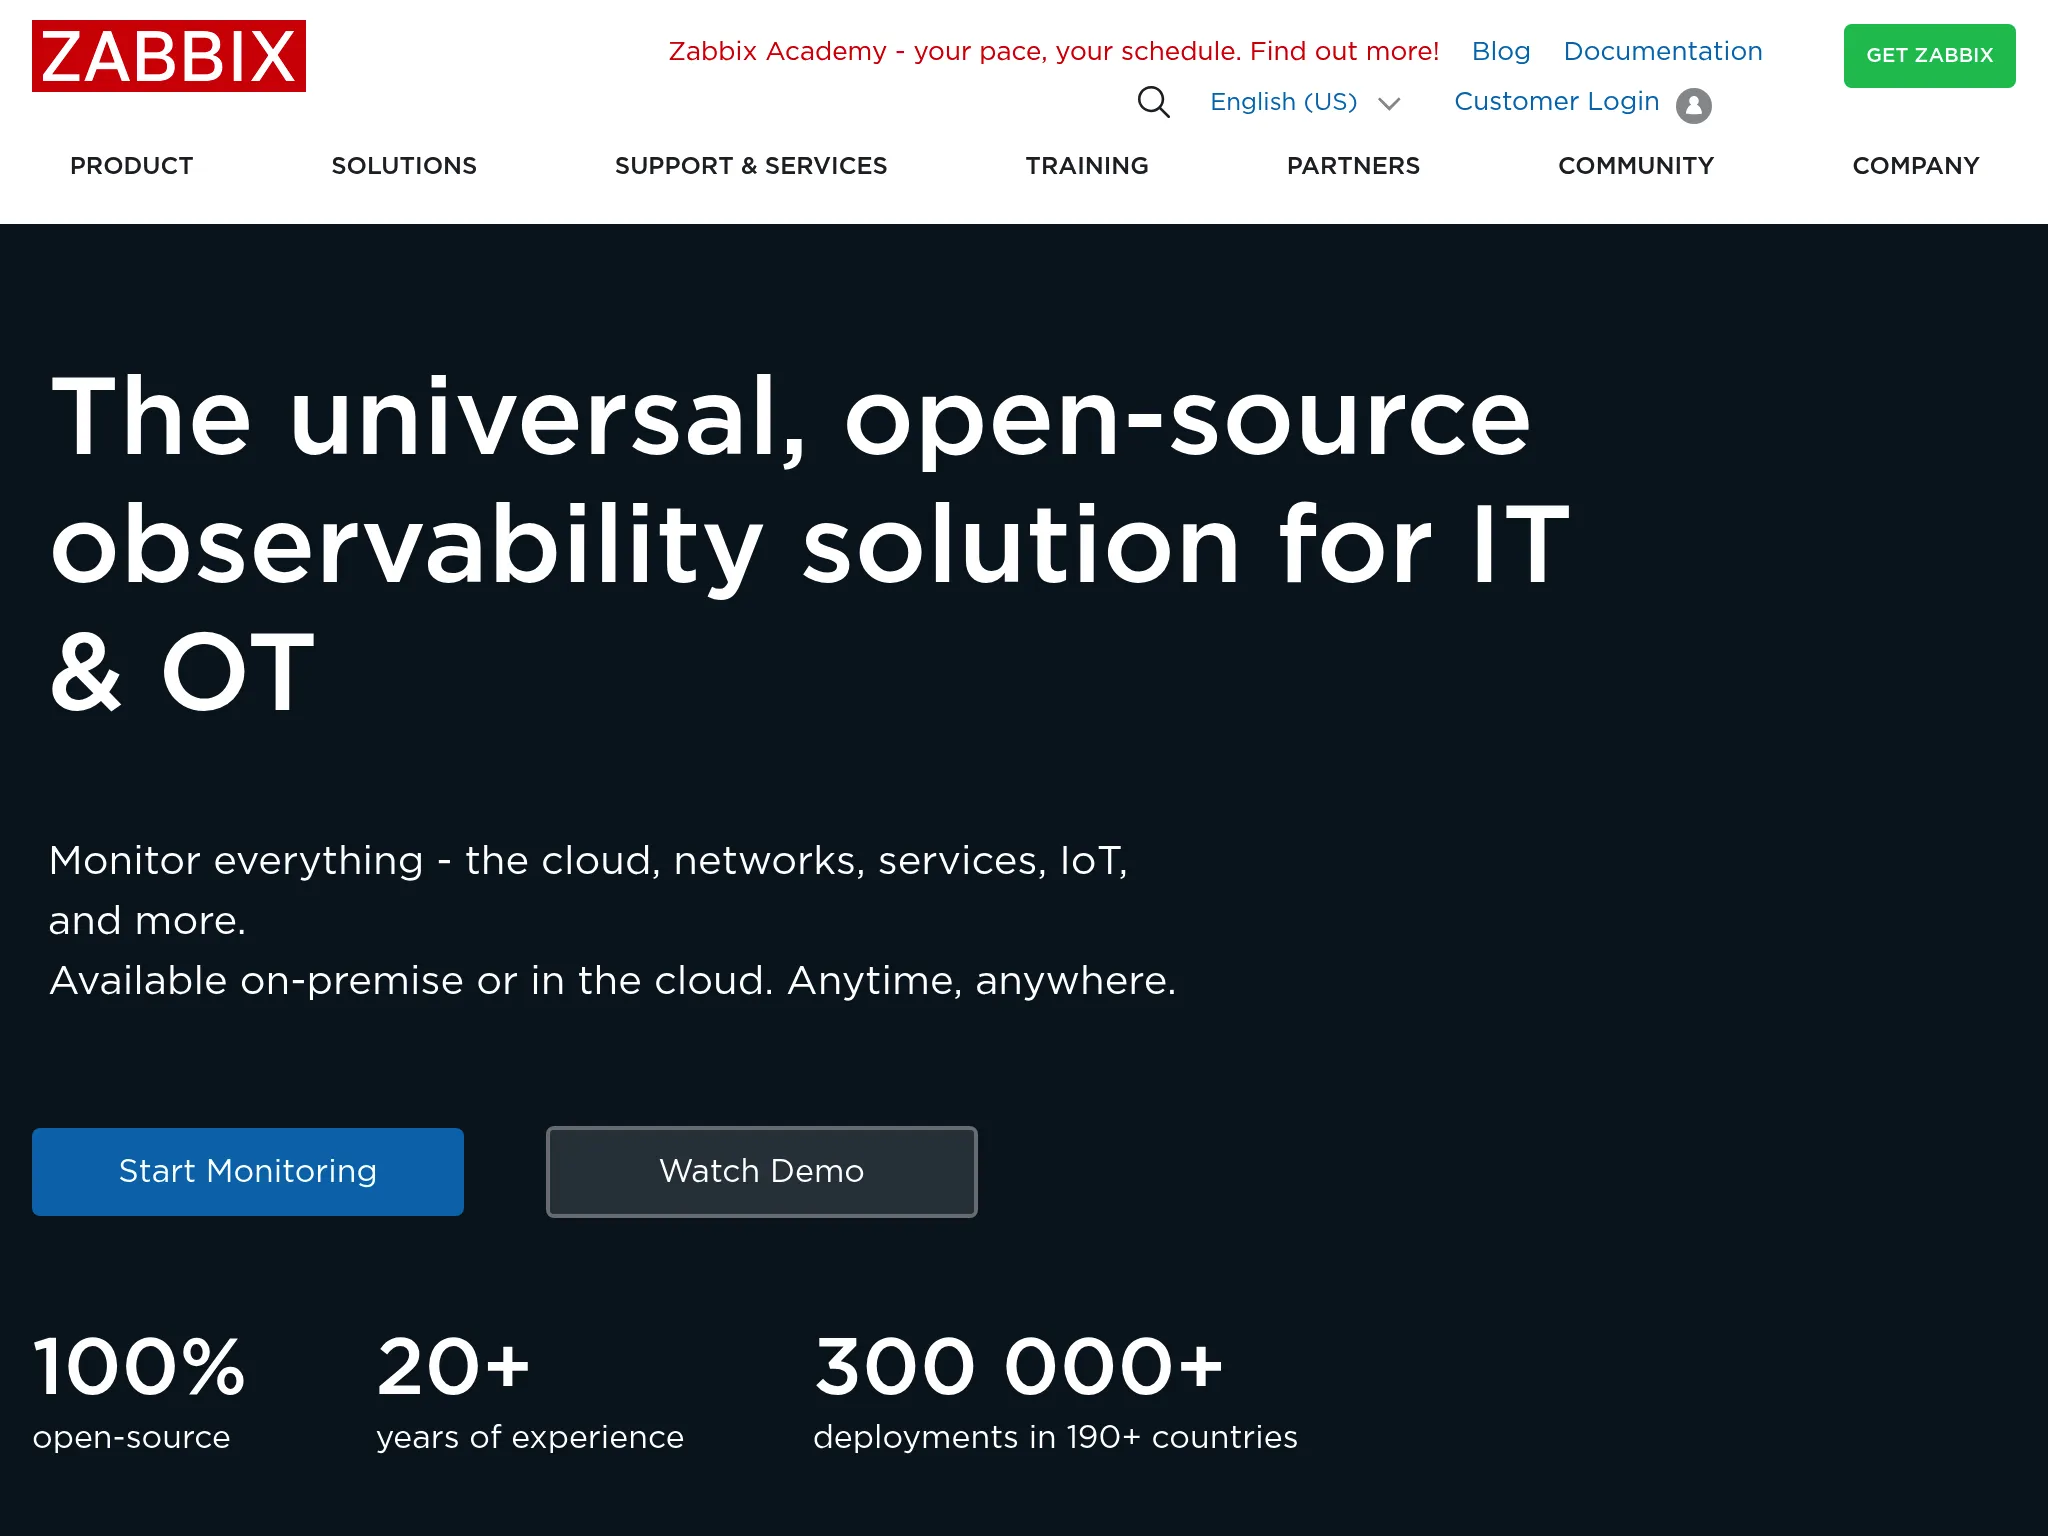
Infrastructure teams that want a single open-source system for servers, network devices, VMs and applications, and are ready to rebuild their monitoring around templates rather than port Nagios plugins one by one.
Notable features
- Templates for hundreds of devices and apps: Linux, Windows, MySQL, VMware, Cisco and more, with items, triggers and graphs predefined.
- Low-level discovery: File systems, interfaces and services on each host are discovered and monitored automatically.
- Triggers with expressions: Threshold, trend and anomaly conditions evaluated on the server.
- Actions with escalation steps: Send a message, wait, then notify another group or run a remote command.
- Native agents for Linux and Windows, plus SNMP, IPMI and agentless checks.
How much does Zabbix cost?
Zabbix is free and open source: GPLv2 up to 6.4, and AGPLv3 from version 7.0. Zabbix Cloud starts at $50/month (Nano tier, 50 new values per second) and goes up to $5,000/month, with a 5-day trial. Commercial support subscriptions are quoted by Zabbix.
Considerations
Zabbix is database-heavy: at scale you'll tune MySQL or PostgreSQL (often with TimescaleDB) and housekeeping. The template and trigger model has its own learning curve, and Nagios plugins don't carry over directly. Escalations exist inside actions, but there's no on-call calendar and no public status page.
Who might consider Zabbix
Choose Zabbix if you want one free, self-hosted tool that covers servers and network gear with thresholds and trends, and you have someone who can own the database and the templates.
Prometheus + Grafana: Best for cloud-native and container stacks
Who Prometheus is built for
Teams running Kubernetes, containers or microservices, where hosts come and go and a static list of Nagios host definitions can't keep up. Prometheus scrapes metrics from exporters and services, Grafana visualizes them, and Alertmanager routes alerts.
Notable features
- Pull-based metrics with service discovery: Targets are discovered from Kubernetes, Consul, EC2 and others instead of listed by hand.
- PromQL: A query language that turns raw metrics into rates, percentiles and alert conditions.
- Exporters for everything:
node_exporterfor Linux hosts,windows_exporterfor Windows, and exporters for databases, queues and hardware. - Alertmanager: Grouping, inhibition, silences and routing to receivers.
- Grafana dashboards: The de facto standard for metric visualization.
How much does it cost?
Prometheus (Apache 2.0) and Grafana (AGPLv3) are free to self-host. Grafana Cloud has a free tier with 10,000 active metric series, 50 GB of logs, 3 active users and 14-day retention. The Pro tier is a $19/month platform fee plus usage. On-call lives in Grafana IRM: free for 3 active IRM users, then $20 per active IRM user per month.
Considerations
This is a stack, not a product. You'll run and scale Prometheus (plus Thanos, Mimir or VictoriaMetrics for long-term storage), maintain exporters, and write PromQL for every alert. Prometheus is built for metrics, so "is this service answering" checks need the blackbox exporter. Alertmanager routes alerts but has no schedules or escalation to a second person, which is why Grafana sells IRM separately.
Who might consider Prometheus + Grafana
Choose it if your workloads are containerized, your engineers already read PromQL, and you want metrics-first monitoring that follows dynamic infrastructure. For a static fleet of VMs, it's usually more machinery than the problem needs. For a head-to-head, see Datadog vs Grafana Cloud.
Netdata: Best for per-second metrics with almost no setup
Who Netdata is built for
Engineers who want to install something and immediately see detailed metrics for a host, without writing any configuration. Netdata's agent auto-detects services and collects metrics every second.
Notable features
- Per-second collection with thousands of metrics auto-detected on each host.
- Zero-configuration dashboards for the host and the applications it finds.
- Built-in ML anomaly detection on every metric.
- Native Windows agent alongside Linux, macOS and containers.
- Hundreds of preconfigured alerts that ship with the agent.
How much does Netdata cost?
From Netdata's pricing page:
- Community: free, limited to 5 active connected nodes and 1 custom dashboard per room
- Homelab: $90/year with unlimited nodes under a fair-usage policy
- Business: $4.50/node/month billed annually, with RBAC, SSO, unlimited dashboards and Netdata AI
- Enterprise on-premises: from 200 nodes, pricing on request
Considerations
The agent itself is GPLv3, but the full experience lives in Netdata Cloud, and the free tier's 5-node cap is tight for a Nagios replacement. On Windows, Netdata's docs note the local dashboard is locked on the free Community tier, so you view data in Netdata Cloud. Alerts notify channels, but there's no on-call scheduling or status page.
Who might consider Netdata
Choose Netdata when you want deep, real-time visibility into individual hosts for troubleshooting, and you're comfortable with a per-node subscription once you pass 5 nodes.
Datadog: Best for full observability
Who Datadog is built for
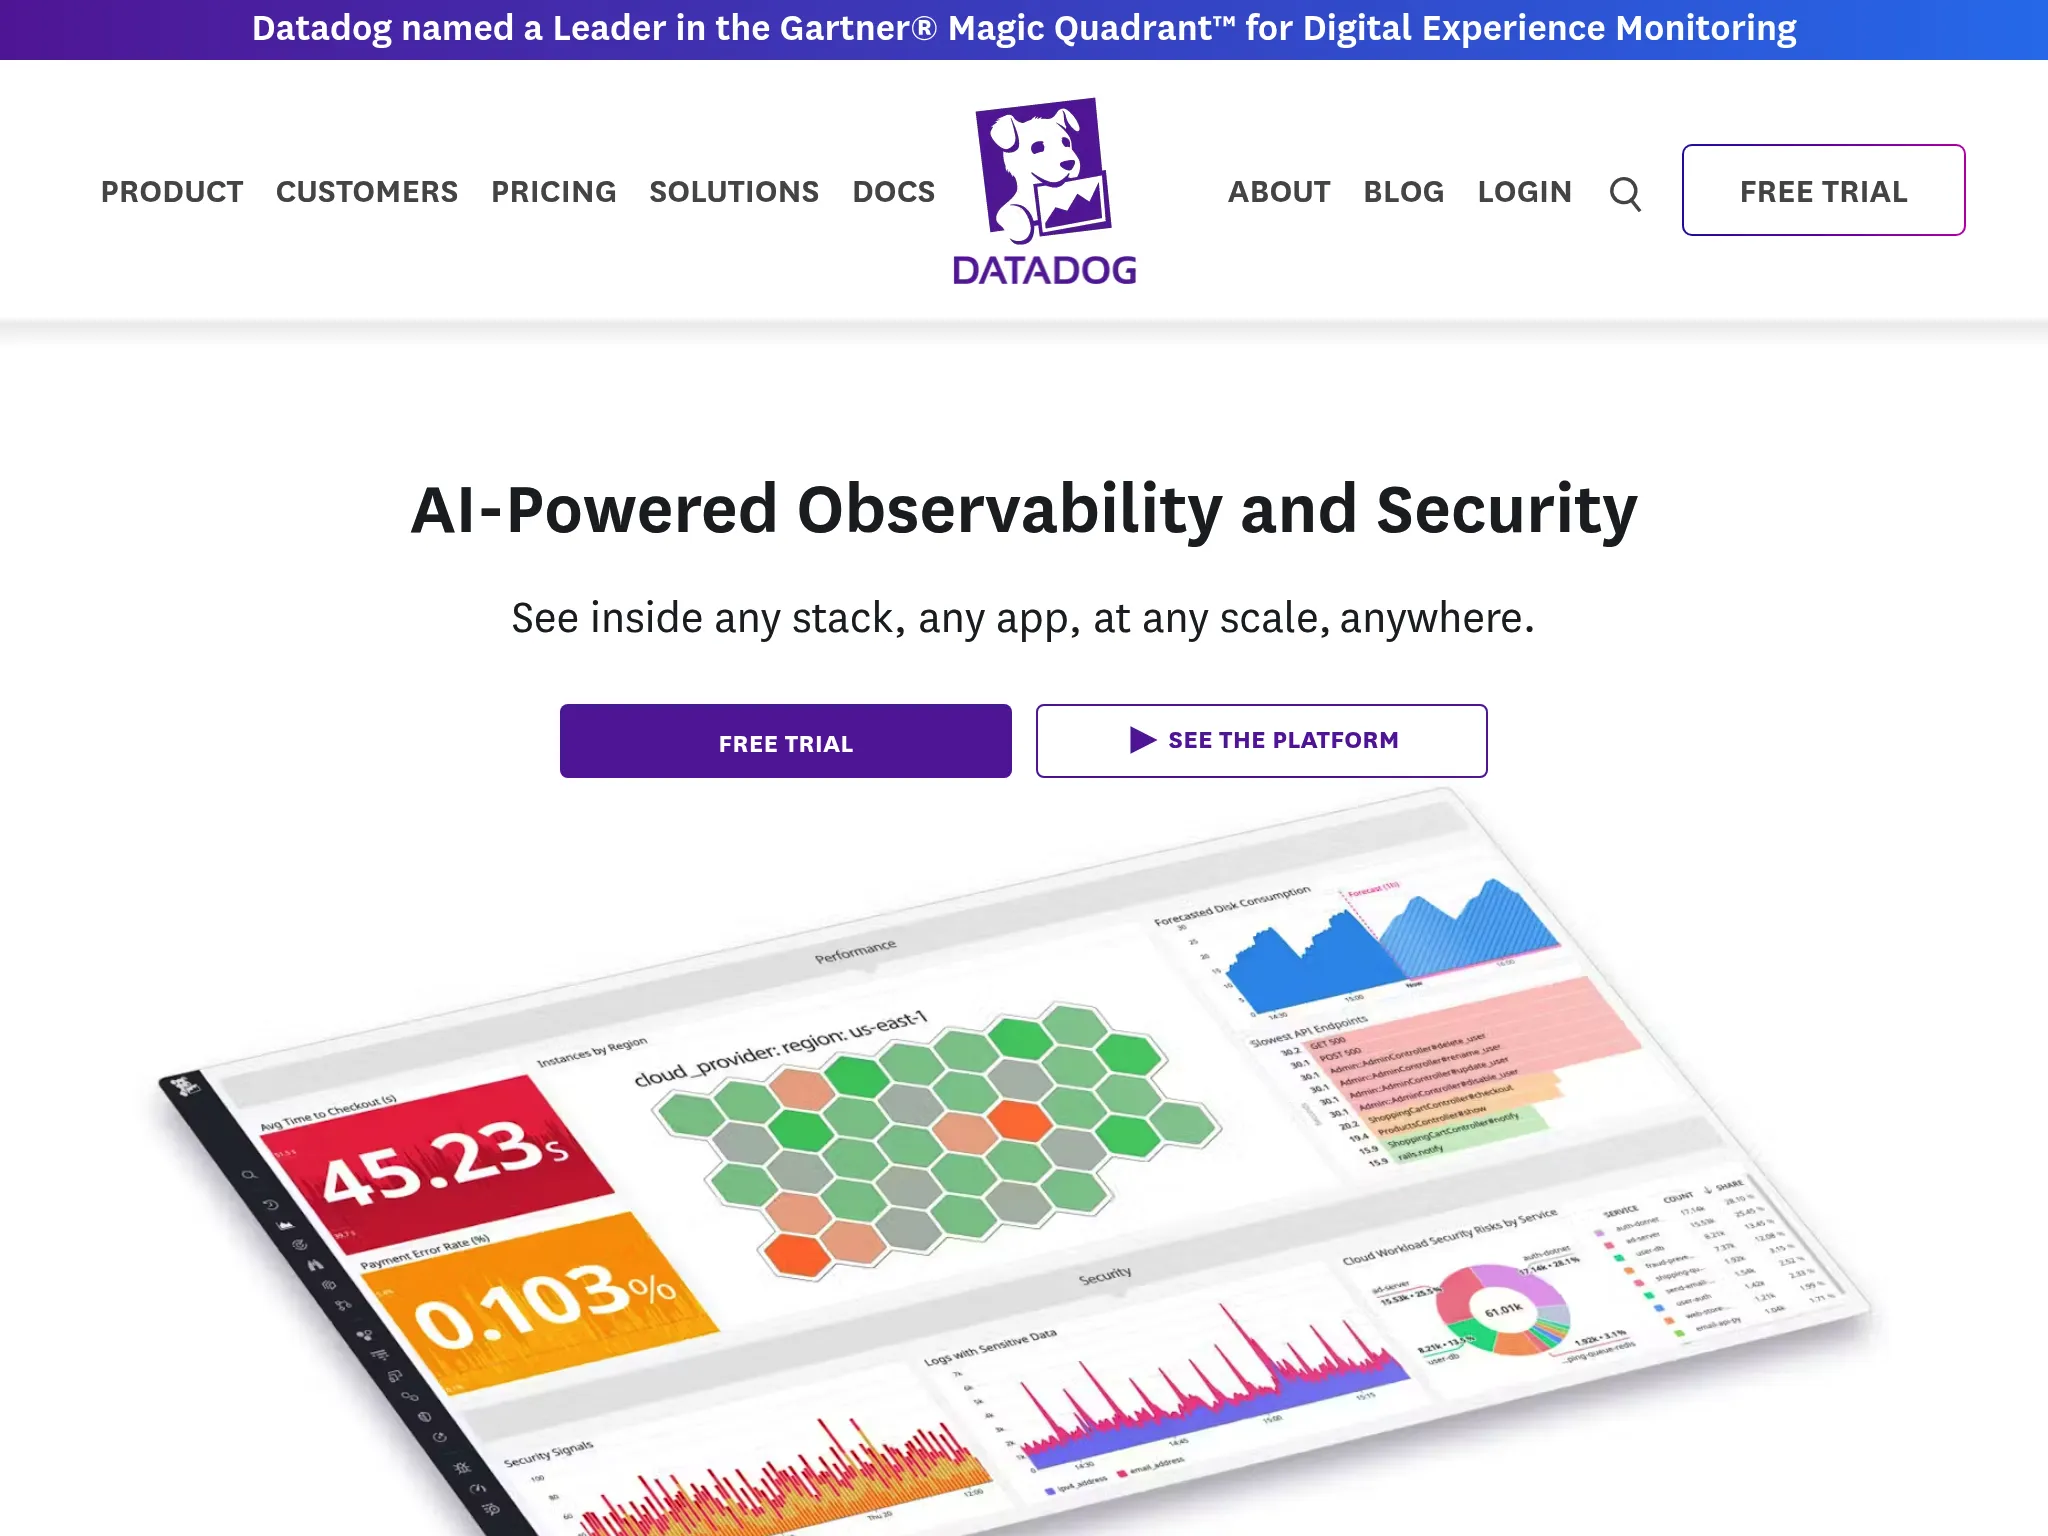
Engineering organizations that need infrastructure metrics, APM, distributed tracing, logs and synthetics correlated in one place, and have the budget for per-host, per-GB and per-seat pricing.
Notable features
- Infrastructure monitoring with 1,000+ integrations and 15-month metric retention on Pro.
- APM, logs, RUM and synthetics in the same platform.
- Datadog On-Call for schedules and escalations, sold per seat.
- Status Pages as part of Datadog's Incident Response suite.
- Native agents for Linux, Windows, macOS and containers.
How much does Datadog cost?
From Datadog's pricing page:
- Free: up to 5 hosts with 1-day metric retention
- Infrastructure Pro: $15/host/month billed annually, $18 on demand
- Infrastructure Enterprise: $23/host/month billed annually, $27 on demand
- On-Call: $20/seat/month on an annual plan, on top of infrastructure
Considerations
Datadog replaces Nagios and several other tools at once, but the bill is the sum of hosts, custom metrics, log ingestion and indexing, synthetic runs and seats. Teams coming from free Nagios Core often find the jump hard to justify for "is the host healthy" monitoring. Our Datadog alternative comparison and Datadog alternatives guide go into the numbers.
Who might consider Datadog
Choose Datadog if you need APM and logs next to host metrics and your team will actually use them. If you only need host health and alerting, you'll pay for a lot of platform you don't touch.
PRTG: Best for a Windows-based monitoring server

Who PRTG is built for
Windows-centric IT departments that want a monitoring server they can install on Windows Server, with a GUI for everything and strong network coverage (SNMP, NetFlow, WMI).
Notable features
- Sensor-based model: Each metric on a device (CPU, a port, a service) is a sensor, with predefined sensor types.
- Auto-discovery of devices on a network range.
- Agentless Windows monitoring through WMI and performance counters.
- Maps and dashboards built in the web interface.
- Remote probes, including a multi-platform probe for Linux, to monitor remote sites.
How much does PRTG cost?
From Paessler's pricing page, all subscriptions billed annually:
- Freeware: up to 100 sensors (about 10 devices)
- PRTG 500: $200/month (500 sensors, around 50 devices)
- PRTG 1000: $358/month
- PRTG 2500: $742/month
- PRTG 10000: $1,642/month
Past 1,000 devices, Paessler points you to PRTG Enterprise Monitor. A hosted version, PRTG Hosted Monitor, is also available.
Considerations
The PRTG core server runs only on Windows (Windows Server 2016 to 2025, Windows 10 and 11). Sensor counting adds up quickly: one server with CPU, memory, disk, network and a few services can use 10 sensors. Notification triggers can escalate by repeating or targeting different contacts, but there's no on-call scheduling or public status page.
Who might consider PRTG
Choose PRTG if your team runs Windows infrastructure, wants everything configured through a GUI, and monitors a lot of network equipment alongside servers.
LibreNMS: Best for SNMP network monitoring
Who LibreNMS is built for
Network teams that used Nagios mostly to watch switches, routers, firewalls and access points, and want auto-discovery and per-port graphs without writing service definitions.
Notable features
- Automatic network discovery using CDP, FDP, LLDP, OSPF, BGP, SNMP and ARP.
- Wide vendor support for network OSes, with per-port traffic, errors and device health graphs.
- Alerting rules with transports to email, Slack, IRC and many other channels.
- Distributed polling for large networks.
- Docker images for quicker setup.
How much does LibreNMS cost?
LibreNMS is free and open source under GPLv3. There's no paid edition. Support comes from the community.
Considerations
LibreNMS is focused on network devices. It can monitor servers over SNMP and runs Nagios plugins through a services integration, but it's not the natural fit for application or host-level alerting. You host it yourself on Linux, and there's no on-call scheduling or status page.
Who might consider LibreNMS
Choose LibreNMS if most of your Nagios config was switches and routers. Pair it with a server-focused tool for your hosts.
Open-source Nagios alternatives
If staying open source is a requirement, the options differ mainly on license and on how much of your Nagios work carries over:
| Tool | License | Reuses Nagios plugins? | Best at |
|---|---|---|---|
| Icinga 2 | GPLv2 | Yes, unchanged | Drop-in replacement with API and clustering |
| Checkmk Community | GPLv2 | Yes, as classical checks | Auto-discovery and rule-based config |
| Zabbix | AGPLv3 (7.0+) | Not directly (via external scripts) | All-in-one with templates and triggers |
| Prometheus + Grafana | Apache 2.0 / AGPLv3 | No (exporters instead) | Metrics for dynamic, containerized stacks |
| LibreNMS | GPLv3 | Partially, via services | SNMP network discovery and graphs |
| Netdata agent | GPLv3 | No | Per-second host metrics with no config |
Two things to plan for with any of them. First, you become the uptime of your monitoring: if the monitoring server, its database or its network path fails, nobody gets paged. Second, none of these projects includes a public status page, and only Icinga (in beta) and Grafana (as a paid cloud add-on) offer on-call schedules. Budget for a paging tool even when the monitoring is free.
Free Nagios alternatives
"Free" means two different things here: free software you host, or a hosted free tier with limits.
Free to self-host, no host limit: Icinga 2, Zabbix, Prometheus + Grafana and LibreNMS. Checkmk Community is free too, positioned for up to about 100 hosts. The cost is the server, the storage and the hours.
Hosted free tiers:
- Hyperping Free: 1 server agent, 20 monitors with 5-minute checks, 1 basic status page
- Netdata Community: 5 active nodes
- Datadog: 5 hosts with 1-day metric retention
- Grafana Cloud Free: 10,000 active series, 3 users, 14-day retention, 3 IRM users
- PRTG Freeware: 100 sensors (self-hosted on Windows)
- Nagios XI Free: 7 nodes or 100 services
For a handful of servers, a hosted free tier gets you monitoring in minutes. Past that, the open-source tools are free in license only.
Nagios alternatives for Windows
Windows comes up two ways in searches: running the monitoring server on Windows, or monitoring Windows hosts.
Running the monitoring server on Windows. Nagios Core doesn't run on Windows, and neither do Icinga's core, Checkmk's server, Zabbix server or LibreNMS (all Linux). PRTG is the main option whose server is built for Windows, and it only runs there. Hosted tools (Hyperping, Datadog, Netdata Cloud, Grafana Cloud) sidestep the question since there's no server to install.
Monitoring Windows hosts. With Nagios, that means NSClient++ or NCPA on each machine plus plugins on the Nagios side. The alternatives are simpler:
- Hyperping: the agent installs as a Windows service from an Administrator PowerShell window on Windows 10 or Windows Server 2016 and later. It reports CPU, memory, each drive letter, disk I/O and network, and derives a load average from the processor queue length since Windows has none. See the Windows install notes and the Windows server monitoring announcement.
- Checkmk and Zabbix: native Windows agents with service discovery and Windows templates.
- Datadog and Netdata: native Windows agents (Netdata's local dashboard is locked on its free tier).
- Prometheus:
windows_exporterexposes WMI and performance counter metrics. - PRTG: agentless monitoring through WMI and performance counters.
Which Nagios alternative should you choose?
- You have hundreds of custom Nagios plugins and want to keep them: Icinga.
- You want Nagios-style checks without writing config: Checkmk.
- You want one free tool for servers and network gear, with thresholds: Zabbix.
- Your infrastructure is Kubernetes and containers: Prometheus + Grafana.
- You mostly monitor switches and routers: LibreNMS, or PRTG if you're a Windows shop.
- You need APM, logs and traces too: Datadog.
- You want host health, uptime checks, on-call and a status page without running a monitoring server: Hyperping.
Many teams end up with two: an open-source tool for deep checks and network gear, and a hosted tool for paging and customer communication, so an outage of the monitoring server doesn't also silence the pager.
How to use Hyperping to replace Nagios alerting
You don't have to migrate everything at once. The pattern that works best is to move host liveness, service checks, paging and status communication first, and keep Nagios running for the checks Hyperping doesn't cover until you've decided what to do with them.
1. Install the agent on your servers
In the Servers view, click New server and copy the install command. Run it on each Linux or macOS host with sudo, or in an Administrator PowerShell window on Windows. For a fleet, pass --name, --policy and --group (or the matching environment variables) from Ansible or Terraform. Each host shows up online with CPU, memory, disk, network and system info within about 30 seconds.
2. Bind an escalation policy and tune the offline threshold
Open the server's Alerting panel, attach an escalation policy, and set the offline threshold: long enough to ride out a network blip, short enough that you'd want to be paged. The default is 90 seconds. Test it by stopping the agent on a non-critical host and checking that the page arrives. The server alerting docs cover the details.
3. Recreate your external Nagios checks as monitors
List the check_http, check_tcp and check_ping services that Nagios runs against your public endpoints and recreate them as HTTP, port, ping or keyword monitors. Route them through the same escalation policies, so a dead host and a failing endpoint page the same person.
4. Set up on-call schedules
Replace Nagios contacts and timeperiods with an on-call schedule, then point your escalation policy's steps at it. Later steps, after the delay you set, can page a secondary or the team lead.
5. Publish a status page
Add the services customers care about to a status page on your own domain. When an incident opens, post an update and subscribers get it by email.
6. Run both side by side, then retire Nagios
Leave Nagios running for one to two weeks. Compare what each one caught and how fast the right person was paged. Then remove the Nagios checks Hyperping now covers, and decide whether what's left (threshold checks, SNMP, custom plugins) justifies keeping a smaller Nagios, Checkmk or Zabbix instance.
How to test these tools
- Hyperping: Free plan and 14-day trial
- Icinga: Free download; the Director and Icinga Web modules are free too
- Checkmk: Community is free; 30-day trials for Pro, Ultimate and Checkmk Cloud
- Zabbix: Free download; 5-day trial for Zabbix Cloud
- Grafana Cloud: Free tier, no time limit
- Netdata: Free for 5 nodes
- Datadog: Free for 5 hosts, plus a free trial of paid plans
- PRTG: 30-day unrestricted trial, then freeware for 100 sensors
When you evaluate, test the whole path from failure to human: kill a service on a test host and time how long it takes for the right person's phone to ring, not just for a dashboard to turn red.
Related reading
- Linux server monitoring guide: CPU, memory, disk and network on your hosts
- Escalation policies guide: how to design who gets paged and when
- On-call rotations: building a schedule that doesn't burn people out
- Best PagerDuty alternatives: if you only want to replace the paging layer
- Agent-based monitoring: what an agent sees that external checks can't
FAQ
What is the best alternative to Nagios? ▼
It depends on which part of Nagios hurts. Icinga is the closest drop-in replacement because it runs the same check plugins with a cleaner config language. Checkmk keeps plugin compatibility but adds agent-based auto-discovery and web configuration. If the pain is alerting, rotations and customer communication rather than checks, Hyperping replaces the paging and status page side with a hosted agent, on-call schedules and status pages from $24/month.
What are the best open-source Nagios alternatives? ▼
Icinga 2 (GPLv2), Checkmk Community (GPLv2, formerly Raw Edition), Zabbix (AGPLv3 since 7.0), Prometheus with Grafana (Apache 2.0 and AGPLv3), LibreNMS (GPLv3) and the Netdata agent (GPLv3). Icinga and Checkmk reuse Nagios plugins, which makes them the easiest migrations. Zabbix and Prometheus require rebuilding your checks from scratch.
Is there a free alternative to Nagios? ▼
Yes. Icinga 2, Checkmk Community, Zabbix, Prometheus and LibreNMS are free to self-host with no host limit, though you pay in server time and maintenance. Hosted free tiers are smaller: Hyperping Free includes 1 server agent and 20 monitors, Netdata Community covers 5 nodes, Datadog's free tier covers 5 hosts with 1-day retention, and PRTG freeware covers 100 sensors.
What is a good Nagios alternative for Windows? ▼
Nagios Core itself does not run on Windows, and Windows hosts are monitored through agents like NSClient++ or NCPA. PRTG is the main tool whose server runs on Windows (its core server is Windows-only). For monitoring Windows hosts from a Linux or hosted server, Hyperping, Checkmk, Zabbix, Netdata and Datadog all ship native Windows agents, and Prometheus uses windows_exporter.
Is Nagios still maintained in 2026? ▼
Yes. Nagios Core 4.5.14 shipped on August 5, 2026 with security fixes, and Nagios XI is sold and supported by Nagios Enterprises. Teams rarely leave because Nagios stopped working. They leave because of the configuration workload, the plugin maintenance on every host, and the lack of built-in on-call scheduling and status pages.
Is Icinga better than Nagios? ▼
For most teams, yes. Icinga started as a Nagios fork in 2009 and Icinga 2 was rewritten with its own configuration language, a REST API, native clustering and a modern web interface, while still running Nagios-compatible plugins. The tradeoff is that you still self-host and maintain everything, including the notification layer.
How much does Nagios XI cost compared to alternatives? ▼
Nagios XI Standard is a one-time license starting at $2,595 for 100 nodes, with a maintenance and support plan required after the first year to keep premium features. Checkmk Pro starts at €190/month billed annually, PRTG 500 is $200/month billed annually, Datadog Infrastructure Pro is $15 per host per month on an annual plan, and Hyperping Essentials is $24/month billed annually for 5 server agents, 50 monitors, on-call and a status page.