How to create a monitor
Monitors are the building block of Hyperping's uptime monitoring: every alert, report and status page starts from one. This page covers every setting. If you just want the fast path, take the quickstart.
From your dashboard, click New monitor.
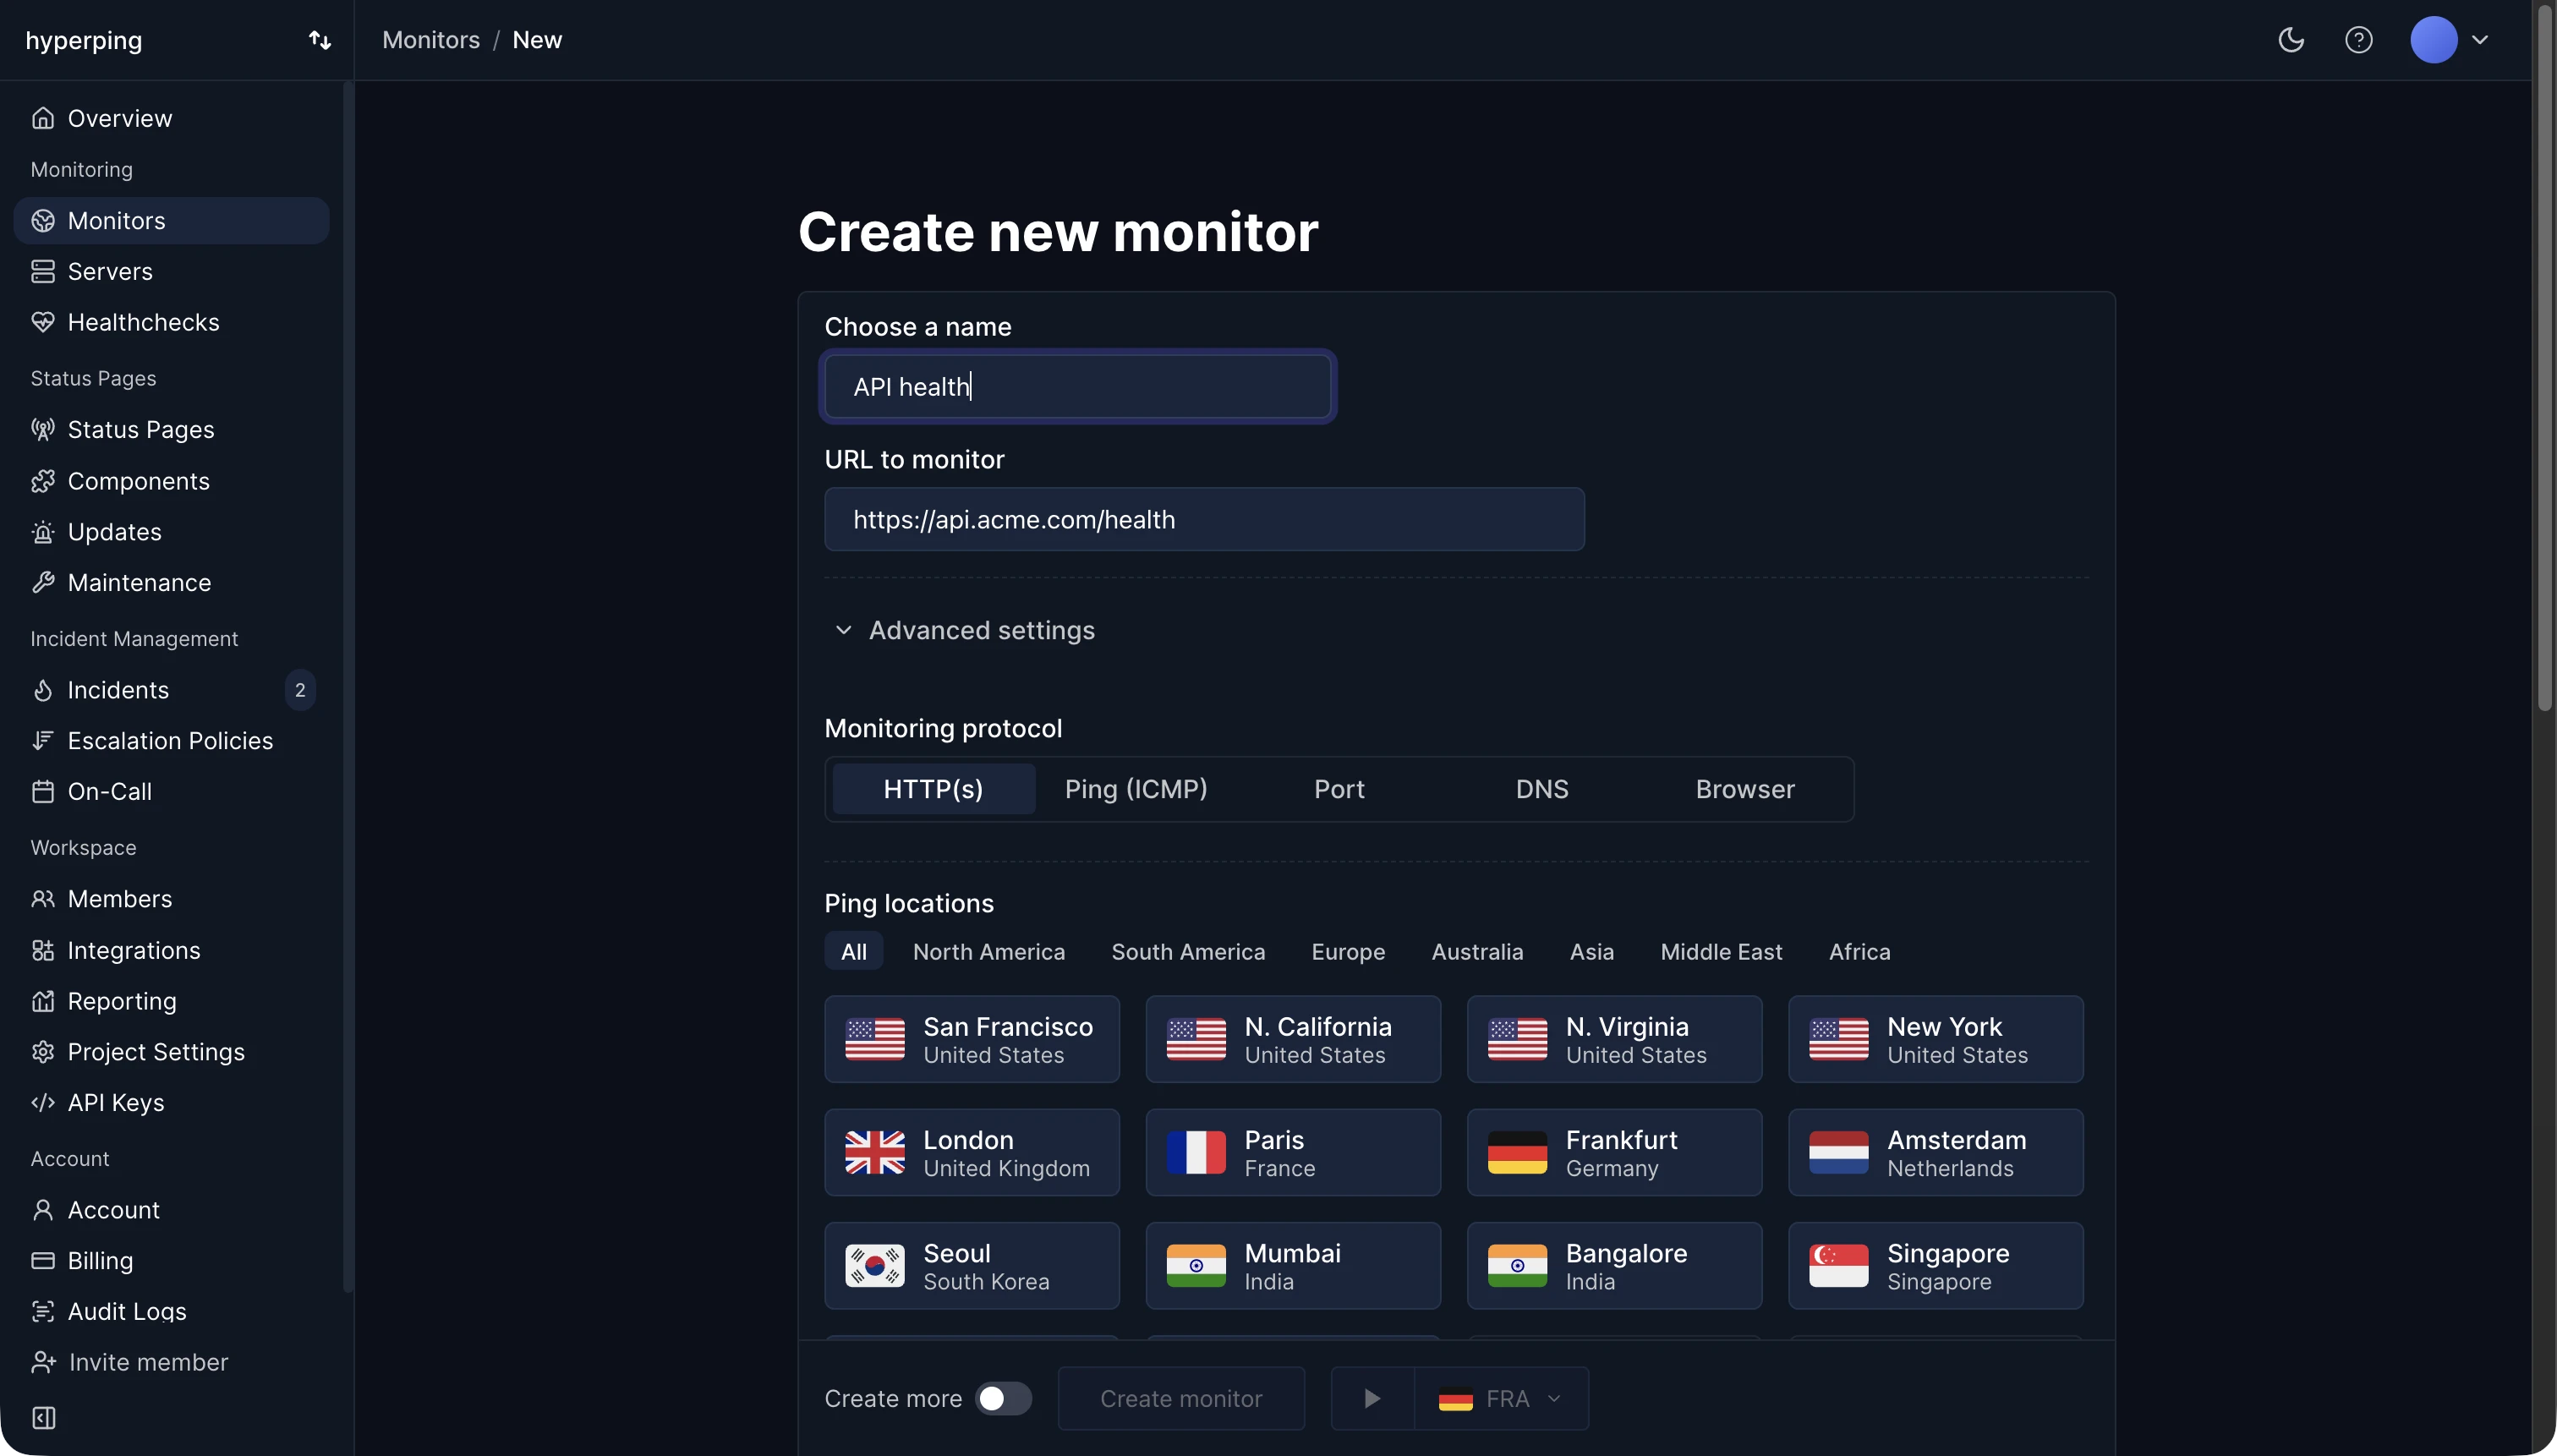
Choose a name
A human readable name, like "API" or "Website". It appears in your dashboard, alert notifications and reports, and can be renamed on a status page without touching the monitor.
Choose a protocol
The most common protocol is HTTP, but Hyperping monitors more than web endpoints:
- HTTP: monitors websites and APIs through their status code. Any response between 200 and 299 counts as up by default.
- ICMP (ping): sends echo requests to check that a host is alive. See Ping and port monitoring.
- Port: checks that a TCP port accepts connections, for databases, mail servers or any network service.
- DNS: queries a record (A, AAAA, CNAME, MX, TXT and more) and verifies the answer matches what you expect. See DNS monitoring.
- Browser check: runs a Playwright script in a headless browser to test full user flows. See Browser checks.
Set a host or endpoint
For HTTP, the endpoint must start with http:// or https://. For ICMP and port checks, use a hostname or an IP address.
Choose regions
Pick where checks run from. Checks rotate through your selected regions, one region at a time:
- Check from Paris: OK
- Check from Frankfurt: OK
- Check from London: failure. Hyperping immediately double-checks from your other selected regions, and only confirmed failures open an outage and trigger alerts.
Pick a check interval
The frequency at which your monitor is checked. The default is every 30 seconds.
IP version
By default, monitors reach your target over IPv4. To check that your service answers over IPv6, open Advanced settings and switch IP version to IPv6 in the Network block. An IPv6 monitor is checked over IPv6 only: if the target has no AAAA record or doesn't answer on IPv6, the check fails, even when IPv4 works.
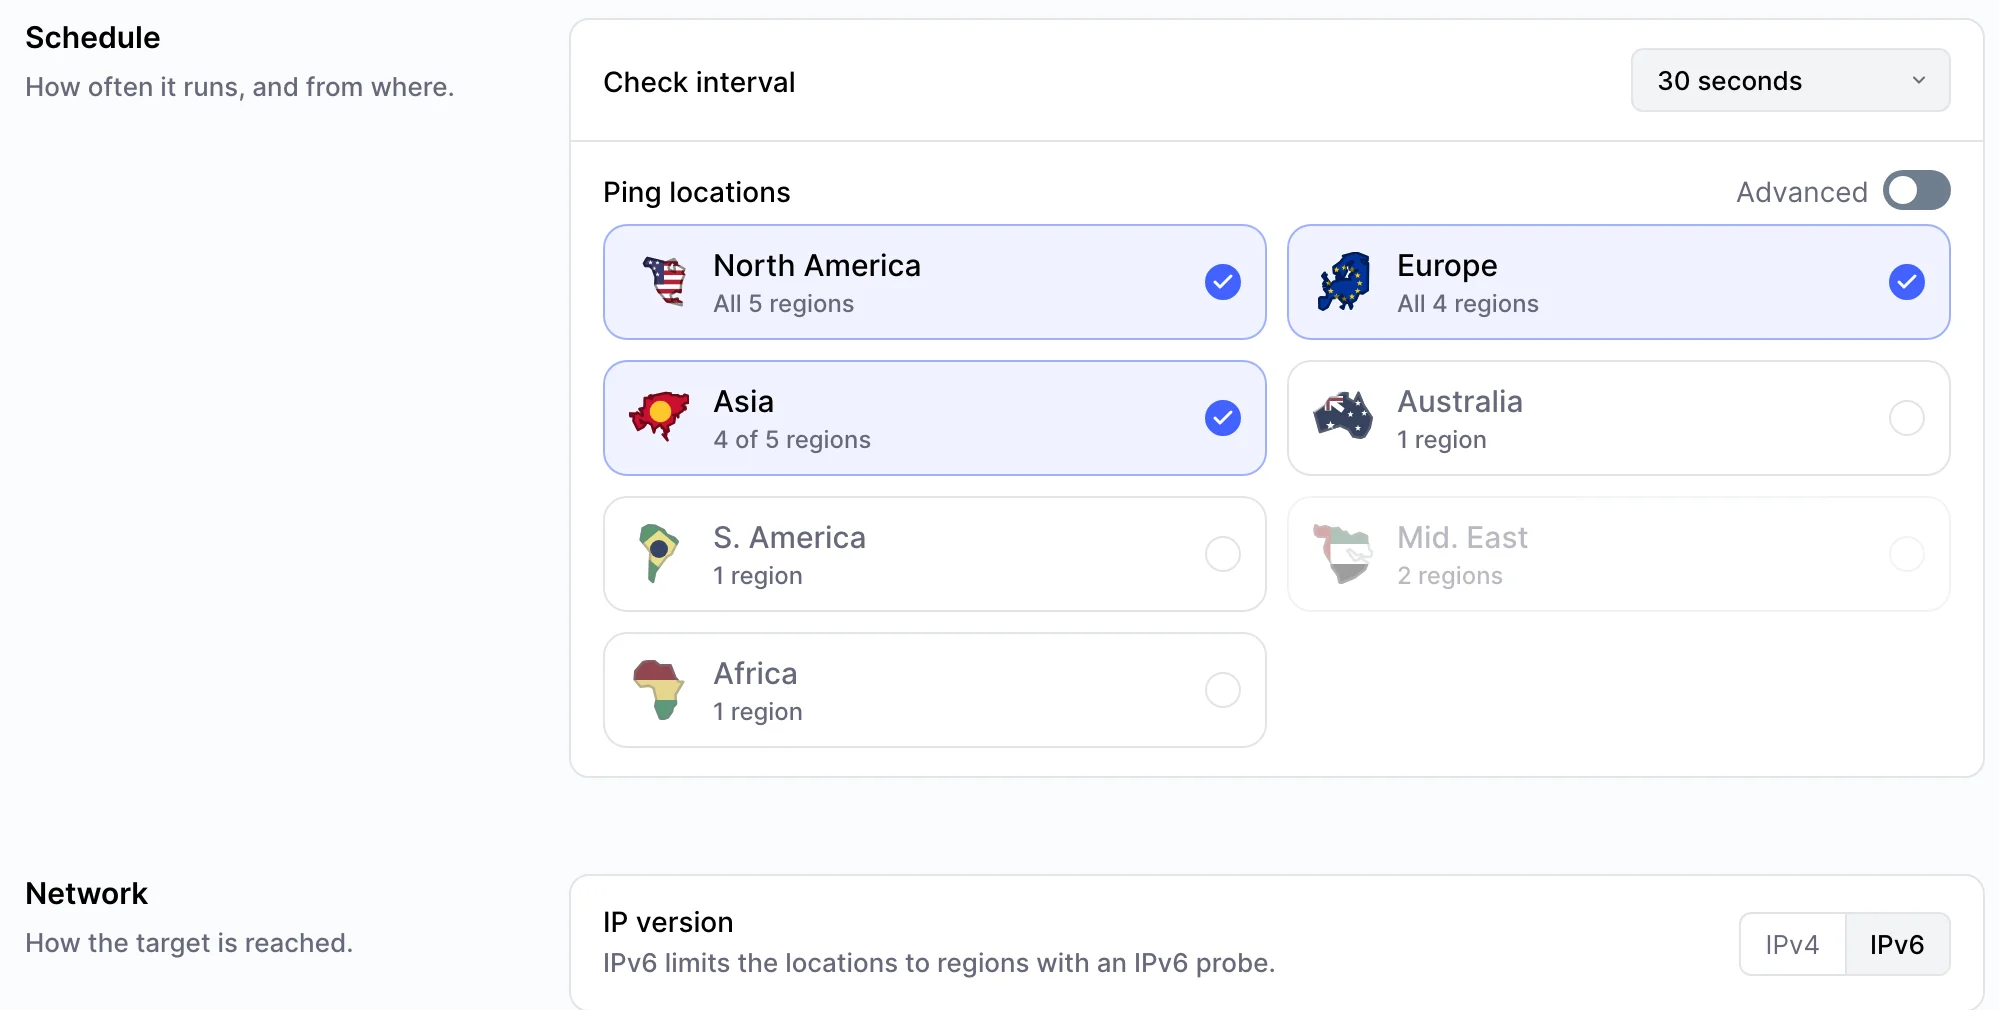
- Protocols: HTTP, port and ping (ICMP). DNS and browser checks don't have the setting.
- Regions: every region has an IPv6 probe except Bahrain. In IPv6 mode, regions without one are greyed out in the picker.
- Shortcut: New monitor → Website / API (IPv6) opens the form directly on IPv6.
Through the API, set ip_version to 6. See the Create monitor API.
HTTP advanced settings
Redirects
Choose whether your monitor should follow HTTP redirects or treat them as final responses.
Expected status code
By default, any status code between 200 and 299 counts as up. If your endpoint is supposed to answer differently, an auth-protected route returning 401 or a forbidden route returning 403, select that expected status code instead: the monitor is then up only when it answers exactly as intended.
Text body assertion
Set a text that the response body must include. This catches error pages served with a 200 and empty renders. See Keyword monitoring for patterns and use cases.
Custom HTTP parameters
Customize the request headers and body, for authenticated endpoints or POST requests.
Create via API or Terraform
Everything above is scriptable:
curl -X POST https://api.hyperping.io/v1/monitors \
  -H "Authorization: Bearer ${API_TOKEN}" \
  -H "Content-Type: application/json" \
  -d '{
    "name": "Website",
    "url": "https://acme.com",
    "protocol": "http",
    "check_frequency": 30,
    "regions": ["paris", "frankfurt", "amsterdam", "london"],
    "request_headers": [
      { "name": "X-Request-Header", "value": "Header value" }
    ]
}'Response201 Created
{
  "name": "Website",
  "url": "https://acme.com",
  "paused": false,
  "regions": ["paris", "frankfurt", "amsterdam", "london"],
  "http_method": "GET",
  "check_frequency": 30,
  "uuid": "mon_3GhAQMYGEQuyUH",
  "status": "up",
  "ssl_expiration": 90,
  "alerts_wait": 0
}
Full field reference in the Create monitor API.
Finalize and save
Click Save. The first check runs immediately, metrics start computing, and you land on the monitor's detailed view with its graphs and logs.
Troubleshooting
The monitor shows down, but the service works in my browser
Open the monitor's logs to see the response we actually received. Common causes: a status code outside your expected range, redirects not followed, or a text body assertion that no longer matches the page.
Response times look higher than expected
Response times are measured from the checking regions. Check them against the regions you selected; a US-hosted service checked only from Asia and Europe will read slower. See Response times.
No alerts fired during an outage
Verify the monitor's escalation policy assignment and test your notification channels with a monitor pointing at a 404 page.