Latency

The time delay between a request being sent and the response being received, typically measured in milliseconds.

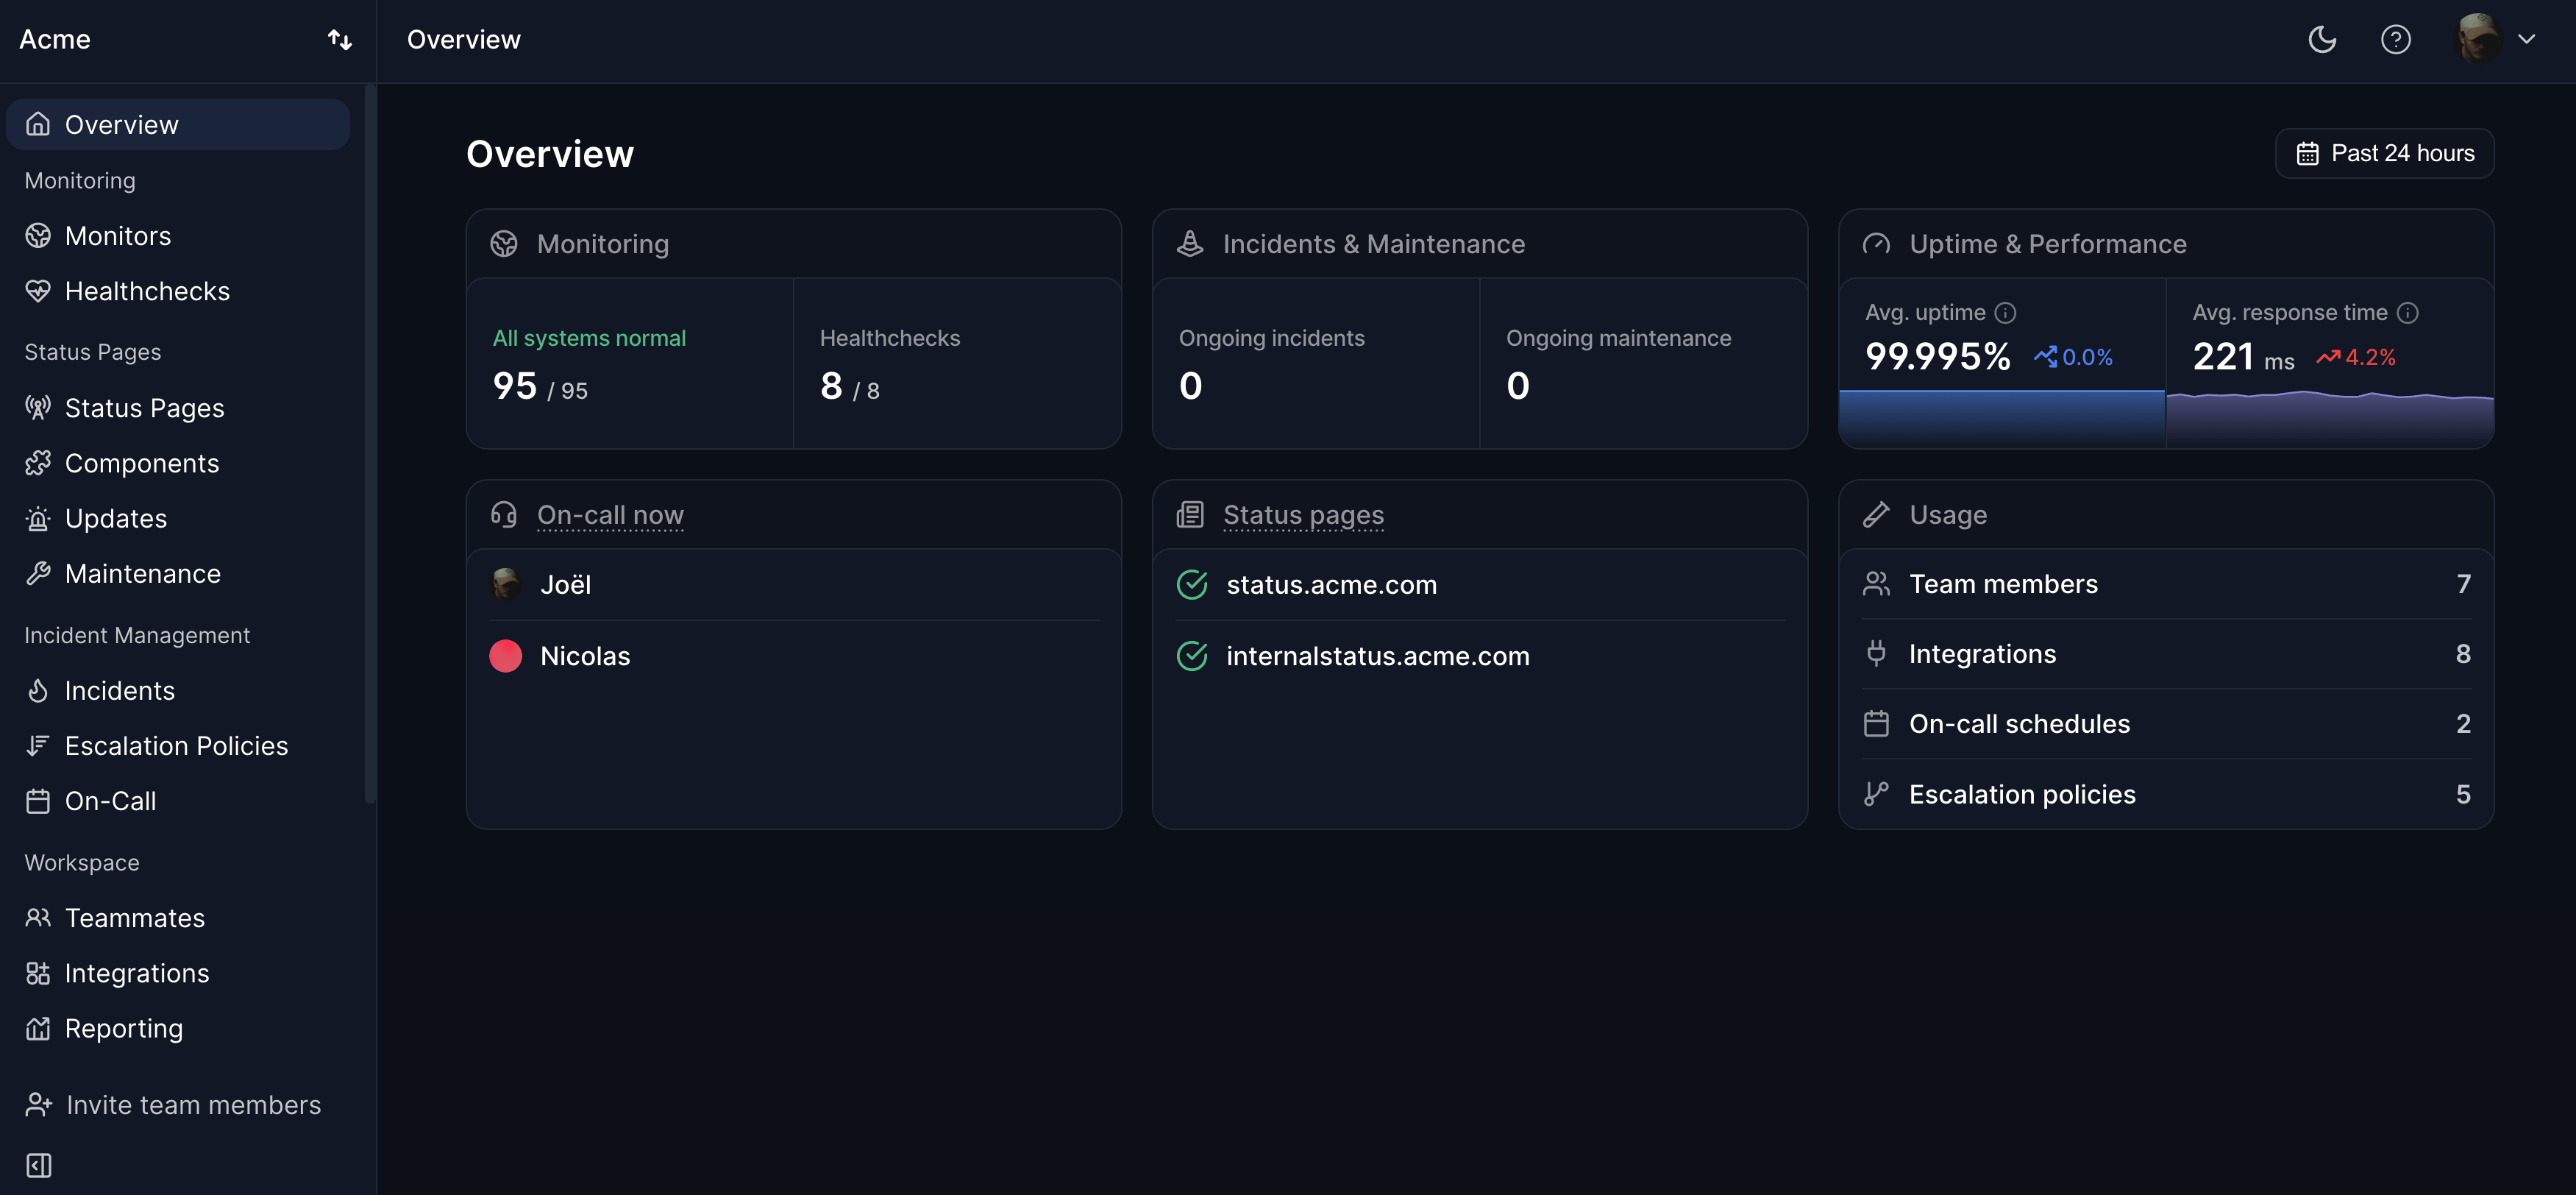
Hyperping monitoring dashboard

Latency is the time delay between initiating an action (such as sending an HTTP request) and receiving the result (the response). In web services, latency is typically measured in milliseconds and is one of the most important indicators of user experience and service health.

Latency is usually analyzed at percentiles rather than averages, because averages can hide outliers. P50 (median) latency shows the typical experience, P95 shows the experience for most users, and P99 captures the tail latency that affects 1 in 100 requests. A service with a low average but a high P99 may still deliver a poor experience for a significant number of users.

Common causes of high latency include network congestion, slow database queries, inefficient code, cold starts in serverless environments, and geographic distance between the user and the server. Monitoring response time from multiple regions — as Hyperping does — helps identify latency issues and track performance over time.

Related Terms

Response time
Response time is the total time between a client sending a request and receiving the complete respon...
P99 Latency
The response time below which 99% of requests are served — used to measure tail latency and worst-ca...
Throughput
The rate at which a system processes requests or data, typically measured in requests per second.
SLA (service level agreement)
An SLA, or service level agreement, is the contract in which a provider promises a level of service,...
Apdex Score
A standardized metric that rates user satisfaction with application response time on a scale from 0 ...

Related Resources

Get started

Start monitoring in the next 5 minutes.

Stop letting customers discover your outages first. Set up monitoring, status pages, on-call, and alerts before your next coffee break.

Free plan, 20 monitors. No credit card, no time limit.