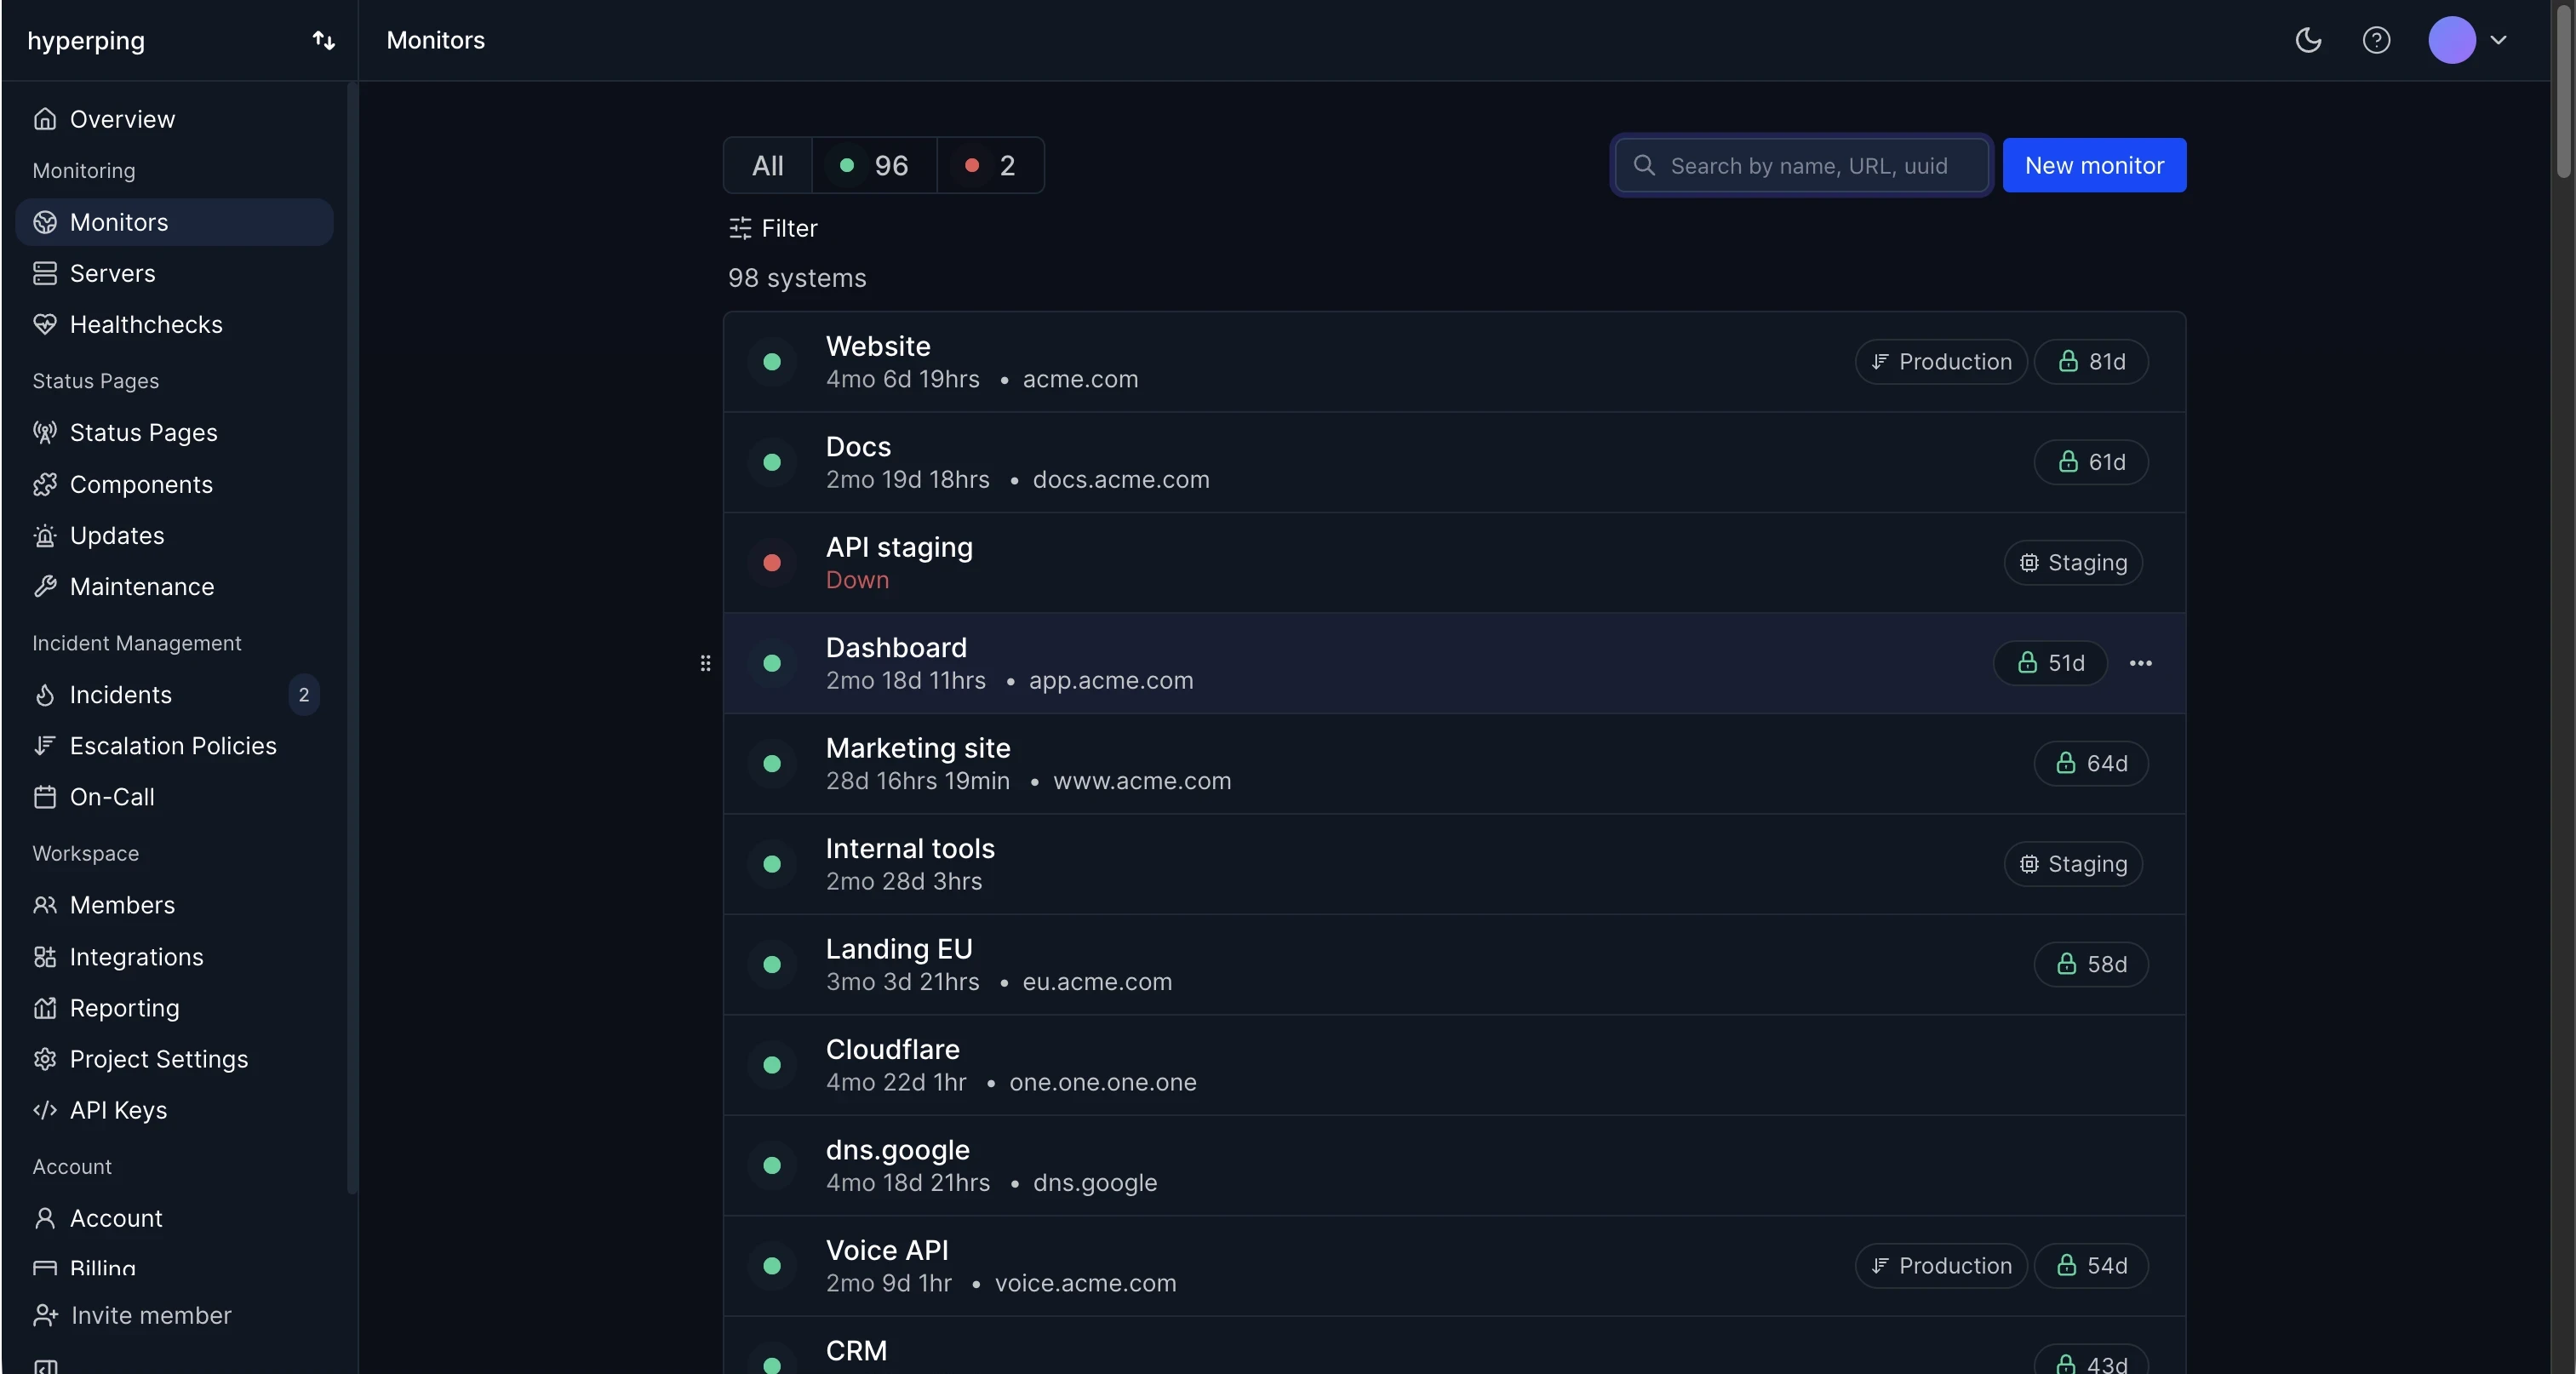
Uptime is measured from outside, by a monitor that checks the service on a schedule. Hyperping checks each monitor every 30 seconds on paid plans from the regions you choose, counts downtime only once a failure is confirmed from more than one region, and calculates uptime as the time between confirmed outages. The percentage shows on the monitor, in the reports, and on your status page as a 90-day history.
How to calculate uptime
uptime = (total time - downtime) / total time
A 30-day month has 43,200 minutes. With 43 minutes of downtime, uptime is 43,157 / 43,200 = 99.90%. The SLA calculator runs it the other way round, from a target percentage to the downtime it allows.
Two choices change the result, so state them next to the number. The first is what counts as down: a timeout, a 5xx error, a wrong page served with a 200, or only a complete outage. The second is whether planned maintenance is excluded. Hyperping's exact rules are on the uptime calculation page.
The nines
Uptime targets are often named by their count of nines:
- Two nines, 99%: 7 hours 12 minutes of downtime per 30-day month. See two nines.
- Three nines, 99.9%: 43 minutes per month. See three nines.
- Four nines, 99.99%: 4 minutes 19 seconds per month. See four nines.
- Five nines, 99.999%: 26 seconds per month. See five nines.
Each extra nine divides the downtime budget by ten, and usually costs a lot more than the previous one.
Uptime vs availability
The two are often used as synonyms. When teams separate them, uptime means the server is running, and availability means users can actually use the service. A server can be up while the app returns errors, so availability is the stricter number and the one customers care about. External monitoring measures availability, because it checks the service the way a user reaches it.
How to measure uptime accurately
- Check from outside your network. A monitor inside the same data center keeps reporting "up" when the data center's internet connection fails.
- Check what users use. Monitor the login page, the API, and the checkout, not only the homepage.
- Confirm before counting. One failed check from one region is often a network blip, not an outage. Counting it drags your uptime down for no reason.
- Check often. With a 5-minute interval, a 4-minute outage can go unrecorded. Every 30 seconds catches it.
FAQ
What is a good uptime percentage?
99.9% for most production websites and SaaS products. Critical services, like payment systems or APIs other companies depend on, aim for 99.99%.
Is 99% uptime good?
Not for a customer-facing product. 99% allows more than 7 hours of downtime a month, enough for customers to notice and complain. It's acceptable for internal tools and prototypes.
How do I check a website's uptime?
For a one-off check, use Is my site down?, which tests a URL from several regions at once. To track uptime over time, set up an uptime monitor. Hyperping's free plan covers 20 monitors.