The best uptime monitoring tools are Hyperping (monitoring + on-call + status pages at a flat rate), Better Stack (monitoring + logging + incident management), Uptime.com (RUM + synthetic monitoring + SLA reporting), Cronitor (cron job monitoring + uptime checks), and UptimeRobot (budget-friendly basic monitoring). I analyzed 28 tools and selected these five based on G2 reviews, hands-on testing, and conversations with DevOps teams.
If you just want a quick answer: Hyperping is the best overall pick for teams that need reliable monitoring, status pages, and on-call scheduling without unpredictable costs. For teams needing advanced logging or full observability, Better Stack fills that gap.
In this guide, you'll learn:
- What to look for in an uptime monitoring tool (8 criteria)
- Which free plans are worth using, and what they leave out
- How pricing works across different tools (with numbers checked on October 29, 2026)
- Which tool fits your team size, technical needs, and budget
- Real user quotes from G2 reviews for each tool
If you want monitoring that catches issues in 30 seconds, status pages that strengthen customer trust, on-call scheduling with smart escalation policies, and pricing you can actually predict, Hyperping delivers exactly that. Start your free trial to see how it works.
Key takeaways
Prices and plan limits below were checked on the vendors' pricing pages on October 29, 2026.
- Hyperping starts at $24/mo billed annually (Essentials, 3 seats included, extra seats billed). Every paid plan includes monitoring, on-call with escalation policies, and status pages. The free plan has 20 monitors.
- Better Stack offers monitoring plus centralized logging and incident management, but pricing scales with add-ons: $29/mo per responder, $21/mo per extra 50 monitors, and $12/mo per extra status page (annual billing).
- Uptime.com stands out for Real User Monitoring (RUM), transaction checks, and SLA reporting. It has no free plan; pricing starts at $9/mo.
- Cronitor is the go-to for cron job monitoring with uptime checks bundled in, but usage-based pricing ($2/monitor/mo plus $5/user/mo) adds up for larger teams.
- UptimeRobot has the largest free plan (50 monitors, 5-minute checks). From Europe, its pricing page lists Solo at $9/mo, Team at $30/mo and Scale at $55/mo billed annually. It still lacks browser checks and on-call scheduling.
Why you can trust this guide
I'm Leo, founder of Hyperping. Yes, that means I have a stake in one of these tools. But I've watched teams choose competitors when they were genuinely the better fit, and my goal is to help you find the right tool for your situation.
I analyzed hundreds of G2 reviews, tested platforms hands-on, reviewed detailed product analyses, and talked to engineering teams about their experiences. Where I couldn't test something directly, I relied on verified user feedback and documented sources. I'll be transparent about where Hyperping falls short, too.
Top picks at a glance
| Best for | Product |
|---|---|
| Monitoring + on-call + status pages at a predictable price | Hyperping |
| Monitoring + logging + incident management | Better Stack |
| RUM + synthetic testing + SLA reporting | Uptime.com |
| Cron job monitoring + uptime checks | Cronitor |
| Budget-friendly basic monitoring | UptimeRobot |
8 criteria to choose the right uptime monitoring tool
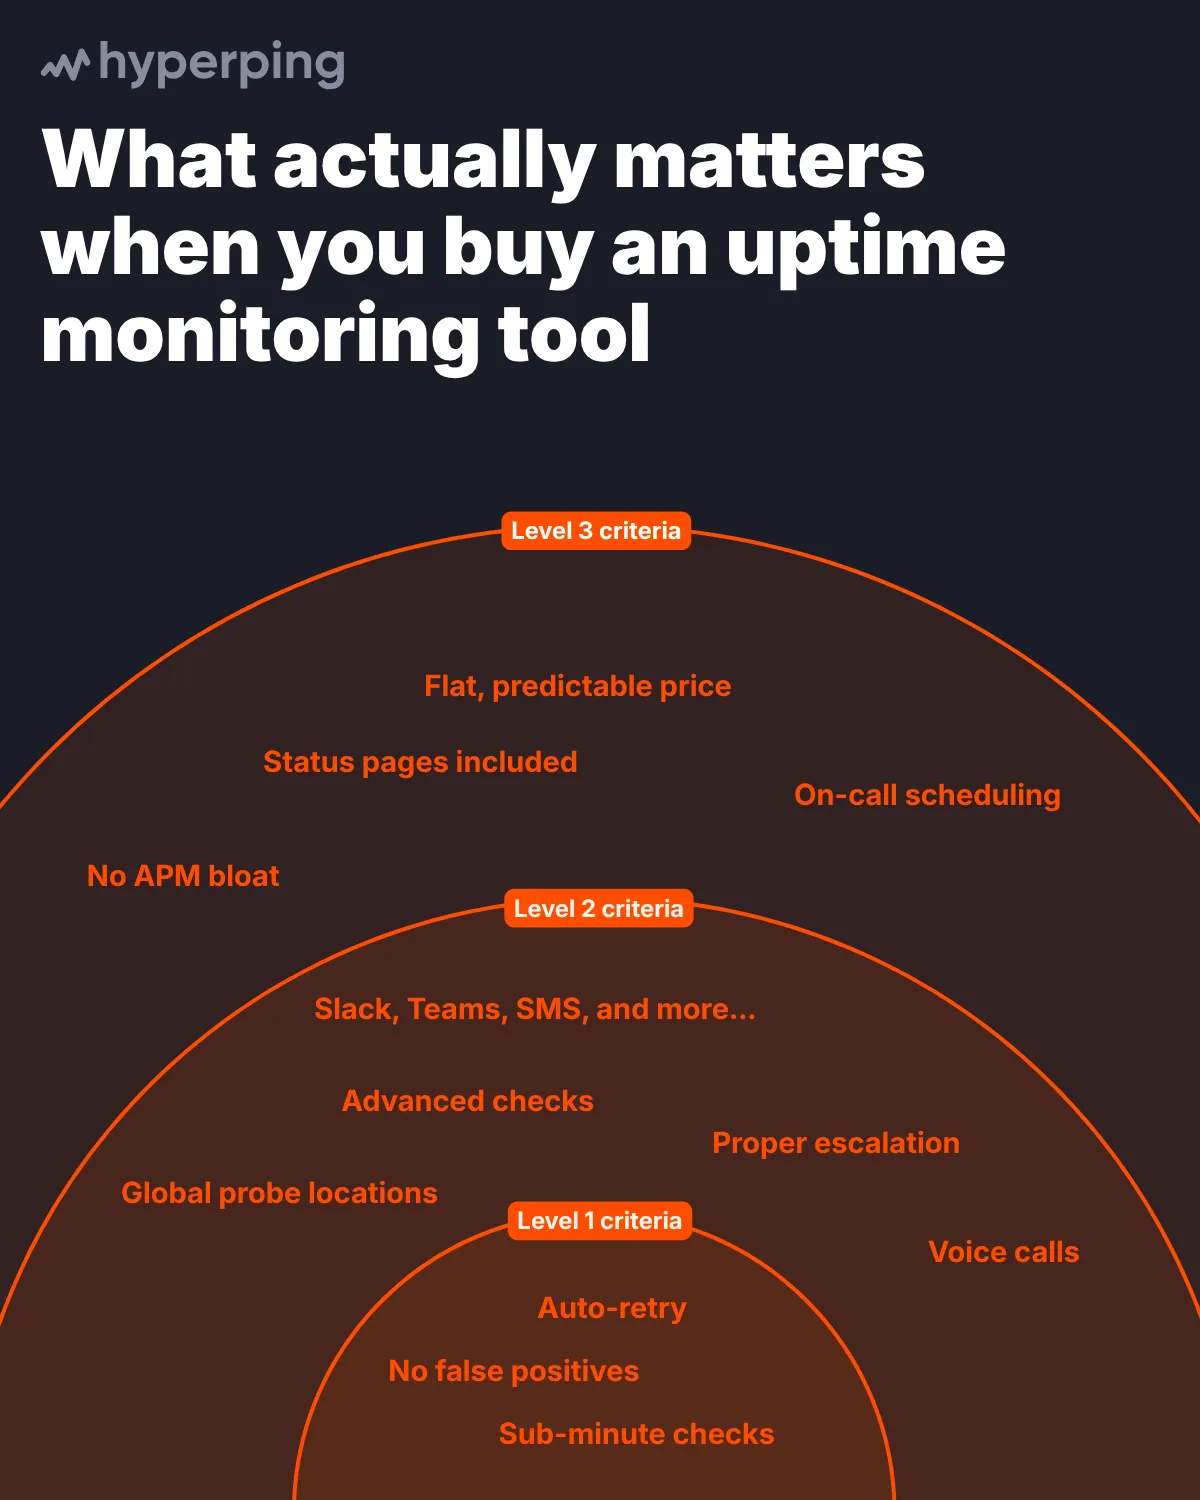
Finding the right uptime monitoring tool does not have to be complicated. From my research, these are the eight criteria that matter most.
- Integrations that fit your workflow: A good monitoring tool connects with your existing stack. When alerts flow directly into Slack, Discord, or PagerDuty, your team stays informed without switching between apps.
- Transparent, predictable pricing: Some monitoring tools charge premium prices that scale unpredictably. Look for pricing that tells you upfront what a seat, a monitor, and a status page cost, so a growing team does not change the bill by surprise.
- Comprehensive monitoring coverage: Great monitoring tools extend beyond basic HTTP checks to include SSL certificate tracking, cron job checks, and synthetic monitoring for proactive issue detection.
- Focused features without bloat: Skip the massive application performance monitoring suites if you do not need them. Choose specialized tools that do uptime monitoring well without unnecessary complexity.
- Built-in status pages: Status pages work best when they are part of your monitoring tool. Built-in status pages automatically update your customers when issues occur, saving you time and manual effort.
- Advanced alerting and escalation: An effective monitoring system should offer escalation policies and flexible alert routing to avoid notification fatigue.
- Fast check frequency: Quick detection requires frequent monitoring. Look for tools that check your services every 30 seconds to 1 minute to minimize downtime impact.
- Global monitoring locations: With users accessing your services worldwide, you need monitoring points across different regions to catch location-specific problems quickly.
I analyzed 28 tools. Here's why only 5 made the cut.
After analyzing 28 popular uptime monitoring tools, I narrowed the selection down to 5 top performers. Many tools fell short for specific reasons:
- Limited monitoring capabilities: Several tools lacked extended monitoring types like synthetic checks, cron job monitoring, or SSL tracking. StatusCake, Pulsetic, and Montastic fell into this category.
- Enterprise complexity and pricing: Many enterprise tools proved too complex and expensive for startup and SMB teams. Datadog, New Relic, and Checkmk are powerful, but overkill for teams that primarily need uptime monitoring and status pages. Uptrends sits close to them: 230+ checkpoints, but credits on a yearly commitment from $42 a month and transactions only on Pro, as of October 2026. If you're leaving it, see Uptrends alternatives.
- Incomplete feature set: Some tools included in other guides were not a fit because they focused on performance monitoring rather than uptime, or they lacked built-in status pages. Tools like Linko, Zippy, and several others did not meet these criteria.
- Narrow focus: A few tools excelled at one thing (like status pages or log management) but lacked the broader monitoring features teams need day to day.
The five tools that survived my analysis all deliver solid uptime monitoring, useful alerting, and some form of status page capability, while remaining accessible to teams that are not staffed with dedicated SRE departments.
Feature comparison table
As of October 2026, here is how the five tools compare across key features:
| Feature | Hyperping | Better Stack | Uptime.com | Cronitor | UptimeRobot |
|---|---|---|---|---|---|
| HTTP/HTTPS monitoring | Yes | Yes | Yes | Yes | Yes |
| SSL monitoring | Yes | Yes | Yes | Yes | Yes |
| Cron job monitoring | Yes | Yes | Heartbeat checks | Yes (core strength) | Yes |
| Synthetic monitoring (browser checks) | Playwright, from 2 regions | Playwright-based | Transaction checks | Metered add-on | No |
| On-call scheduling | Yes (paid plans) | Yes | Limited | No | No |
| Escalation policies | Yes (paid plans) | Yes | Per-monitor setup | No | No |
| Phone call alerts | Yes (paid plans) | Yes | Yes | No | Credits |
| Status pages | 1 to 10 by plan, custom domain on paid plans | 1 included, $12/mo each extra | Some features in add-ons | 1 included, $25 to $50/mo extra | 3 (Solo), 100 (Team), no cap (Scale) |
| RUM (Real User Monitoring) | No | No | Yes | Yes (basic) | No |
| Fastest check interval | 30 seconds (20 on Business) | 30 seconds | 1 minute | 30 seconds (Business) | 15 seconds (Scale) |
| Free plan | Yes (20 monitors) | Yes (10 monitors and heartbeats) | No | Yes (5 monitors) | Yes (50 monitors) |
The free plans compared
Free tiers are where most people start, and the answer to "best free uptime monitoring tool" depends on what you need beyond a ping. As of October 29, 2026:
| Free plan | Monitors | Fastest interval | Status page | What you give up |
|---|---|---|---|---|
| UptimeRobot Free | 50 | 5 minutes | 1 | Faster checks, team seats, alert routing |
| Hyperping Free | 20 | 5 minutes | 1 basic page on a hyperping.app address | Custom domain, subscribers, browser checks, on-call, phone alerts |
| Better Stack Free | 10 (monitors and heartbeats combined) | Not stated | 1 | Labeled "for personal projects"; on-call needs a paid responder license |
| Cronitor Hacker | 5 | 5 minutes | 1 (50 subscribers) | One user, no SMS alerts, no branded or private pages |
| Uptime Kuma | Your server's limit | You choose | Yes | You host and patch it, and it goes down with the server it runs on |
| Uptime.com | No free plan | 30-day money-back guarantee instead |
Pick UptimeRobot Free for the most monitors at no cost. Its pricing page says the free plan is "good for personal and commercial projects."
Pick Hyperping Free if you want server metrics next to your checks: it includes one server monitoring agent and HTTP, port, ping, and keyword checks, plus cron job healthchecks. The status page is basic: a custom domain and subscriber notifications start on Essentials.
Pick Uptime Kuma if you already run infrastructure and want full control. Host it somewhere other than the services it watches, or it will not tell you when they go down together.
Free plans check every 5 minutes, so an outage can last several minutes before the first alert. Paying is worth it once a minute of downtime costs you customers, or once more than one person needs to be woken up. For free status pages on their own, see the best status page software; for UptimeRobot's paid tiers, see our UptimeRobot pricing breakdown.
Pricing comparison (as of October 2026)
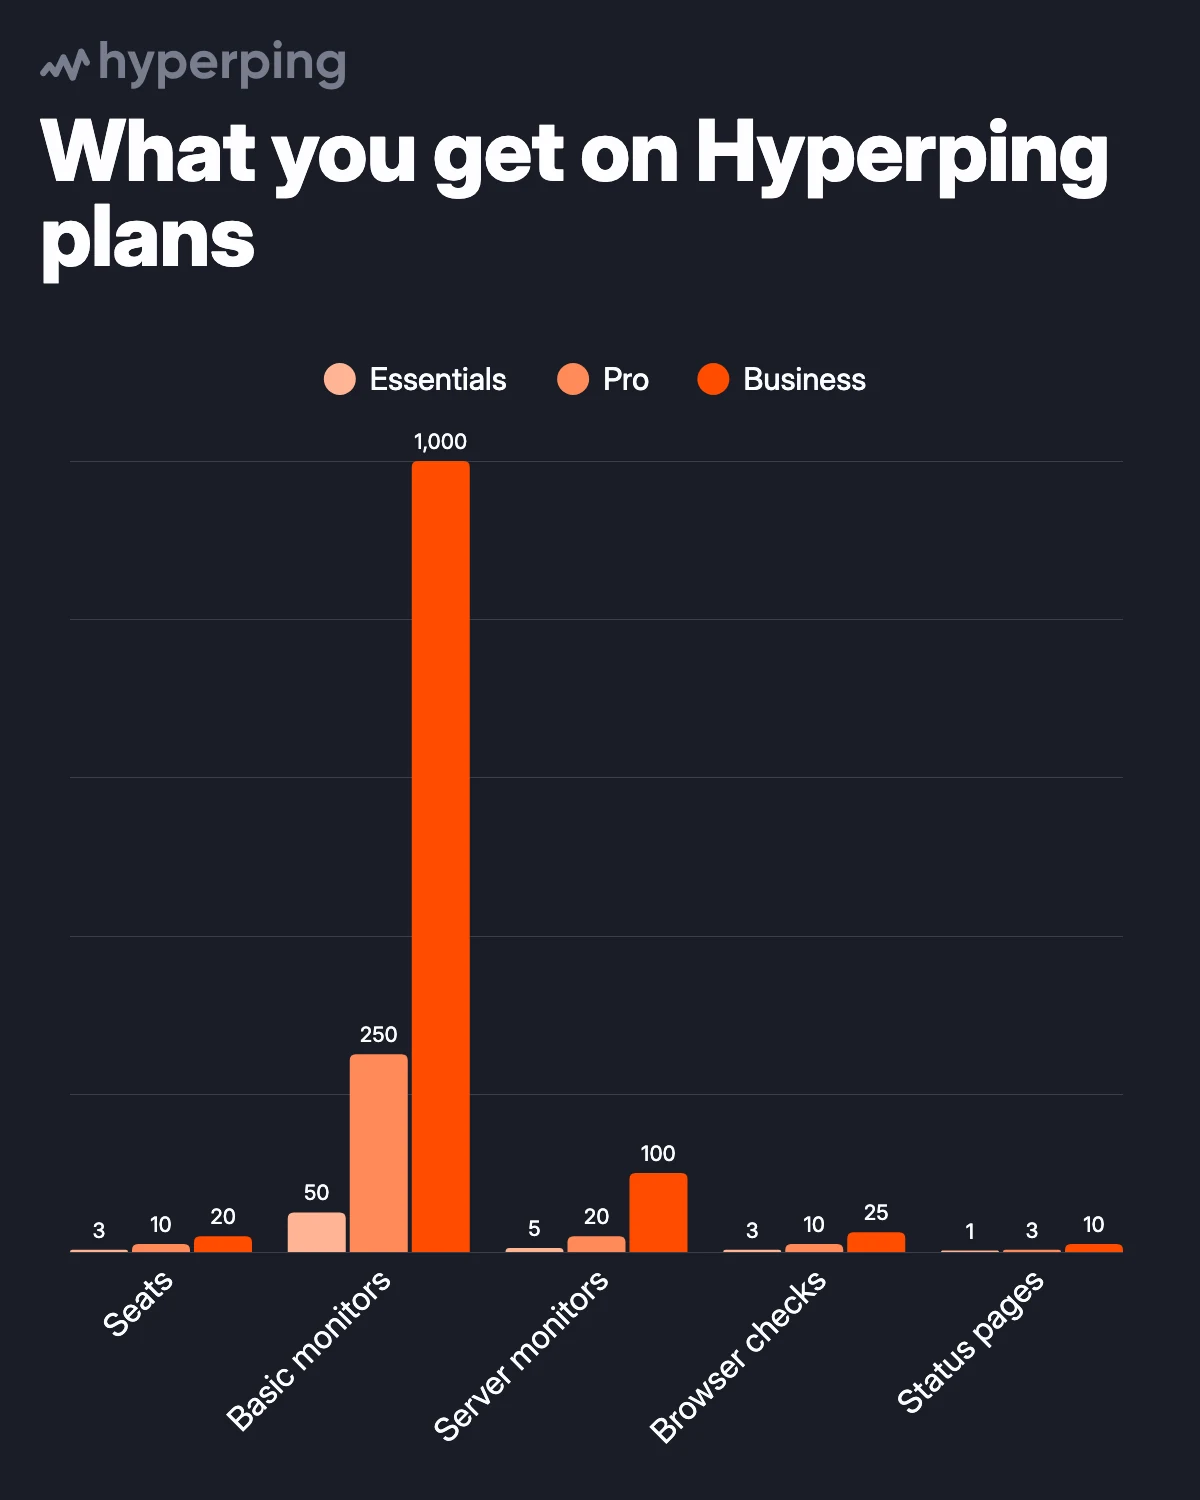
Hyperping Pro costs $74/month billed annually ($89 monthly) for 250 monitors, 10 browser checks, 3 public or private status pages, and 10 seats.
Pricing models differ a lot, so the table shows each tool's entry price and our estimate for the same setup: about 10 people, 250 monitors, and 3 status pages, billed annually.
| Entry paid plan | ~10 people, 250 monitors, 3 status pages | How it is billed | |
|---|---|---|---|
| Hyperping | $24/mo (Essentials, 50 monitors) | $74/mo (Pro) | Flat plans, seats included, extra seats billed |
| Better Stack | $29/mo per responder | ~$419/mo (10 responders, 5 extra monitor packs, 2 extra pages) | Per responder, plus monitor and status page add-ons |
| Uptime.com | $9/mo | Quote from its pricing calculator | By volume of checks, all users included |
| Cronitor | $2/mo per monitor + $5/mo per user | ~$550/mo (250 monitors, 10 users), plus $25/mo per branded page | Per monitor and per user |
| UptimeRobot | $9/mo (Solo, 10 monitors) | Scale 500-monitor tier, plus extra login seats from $15/mo each | Monitor tiers, 3 seats on Team, 5 on Scale |
UptimeRobot shows prices by region. The figures above are what its pricing page displayed from Europe on October 29, 2026; check the page from your own location before you budget.
1. Hyperping
Perfect for
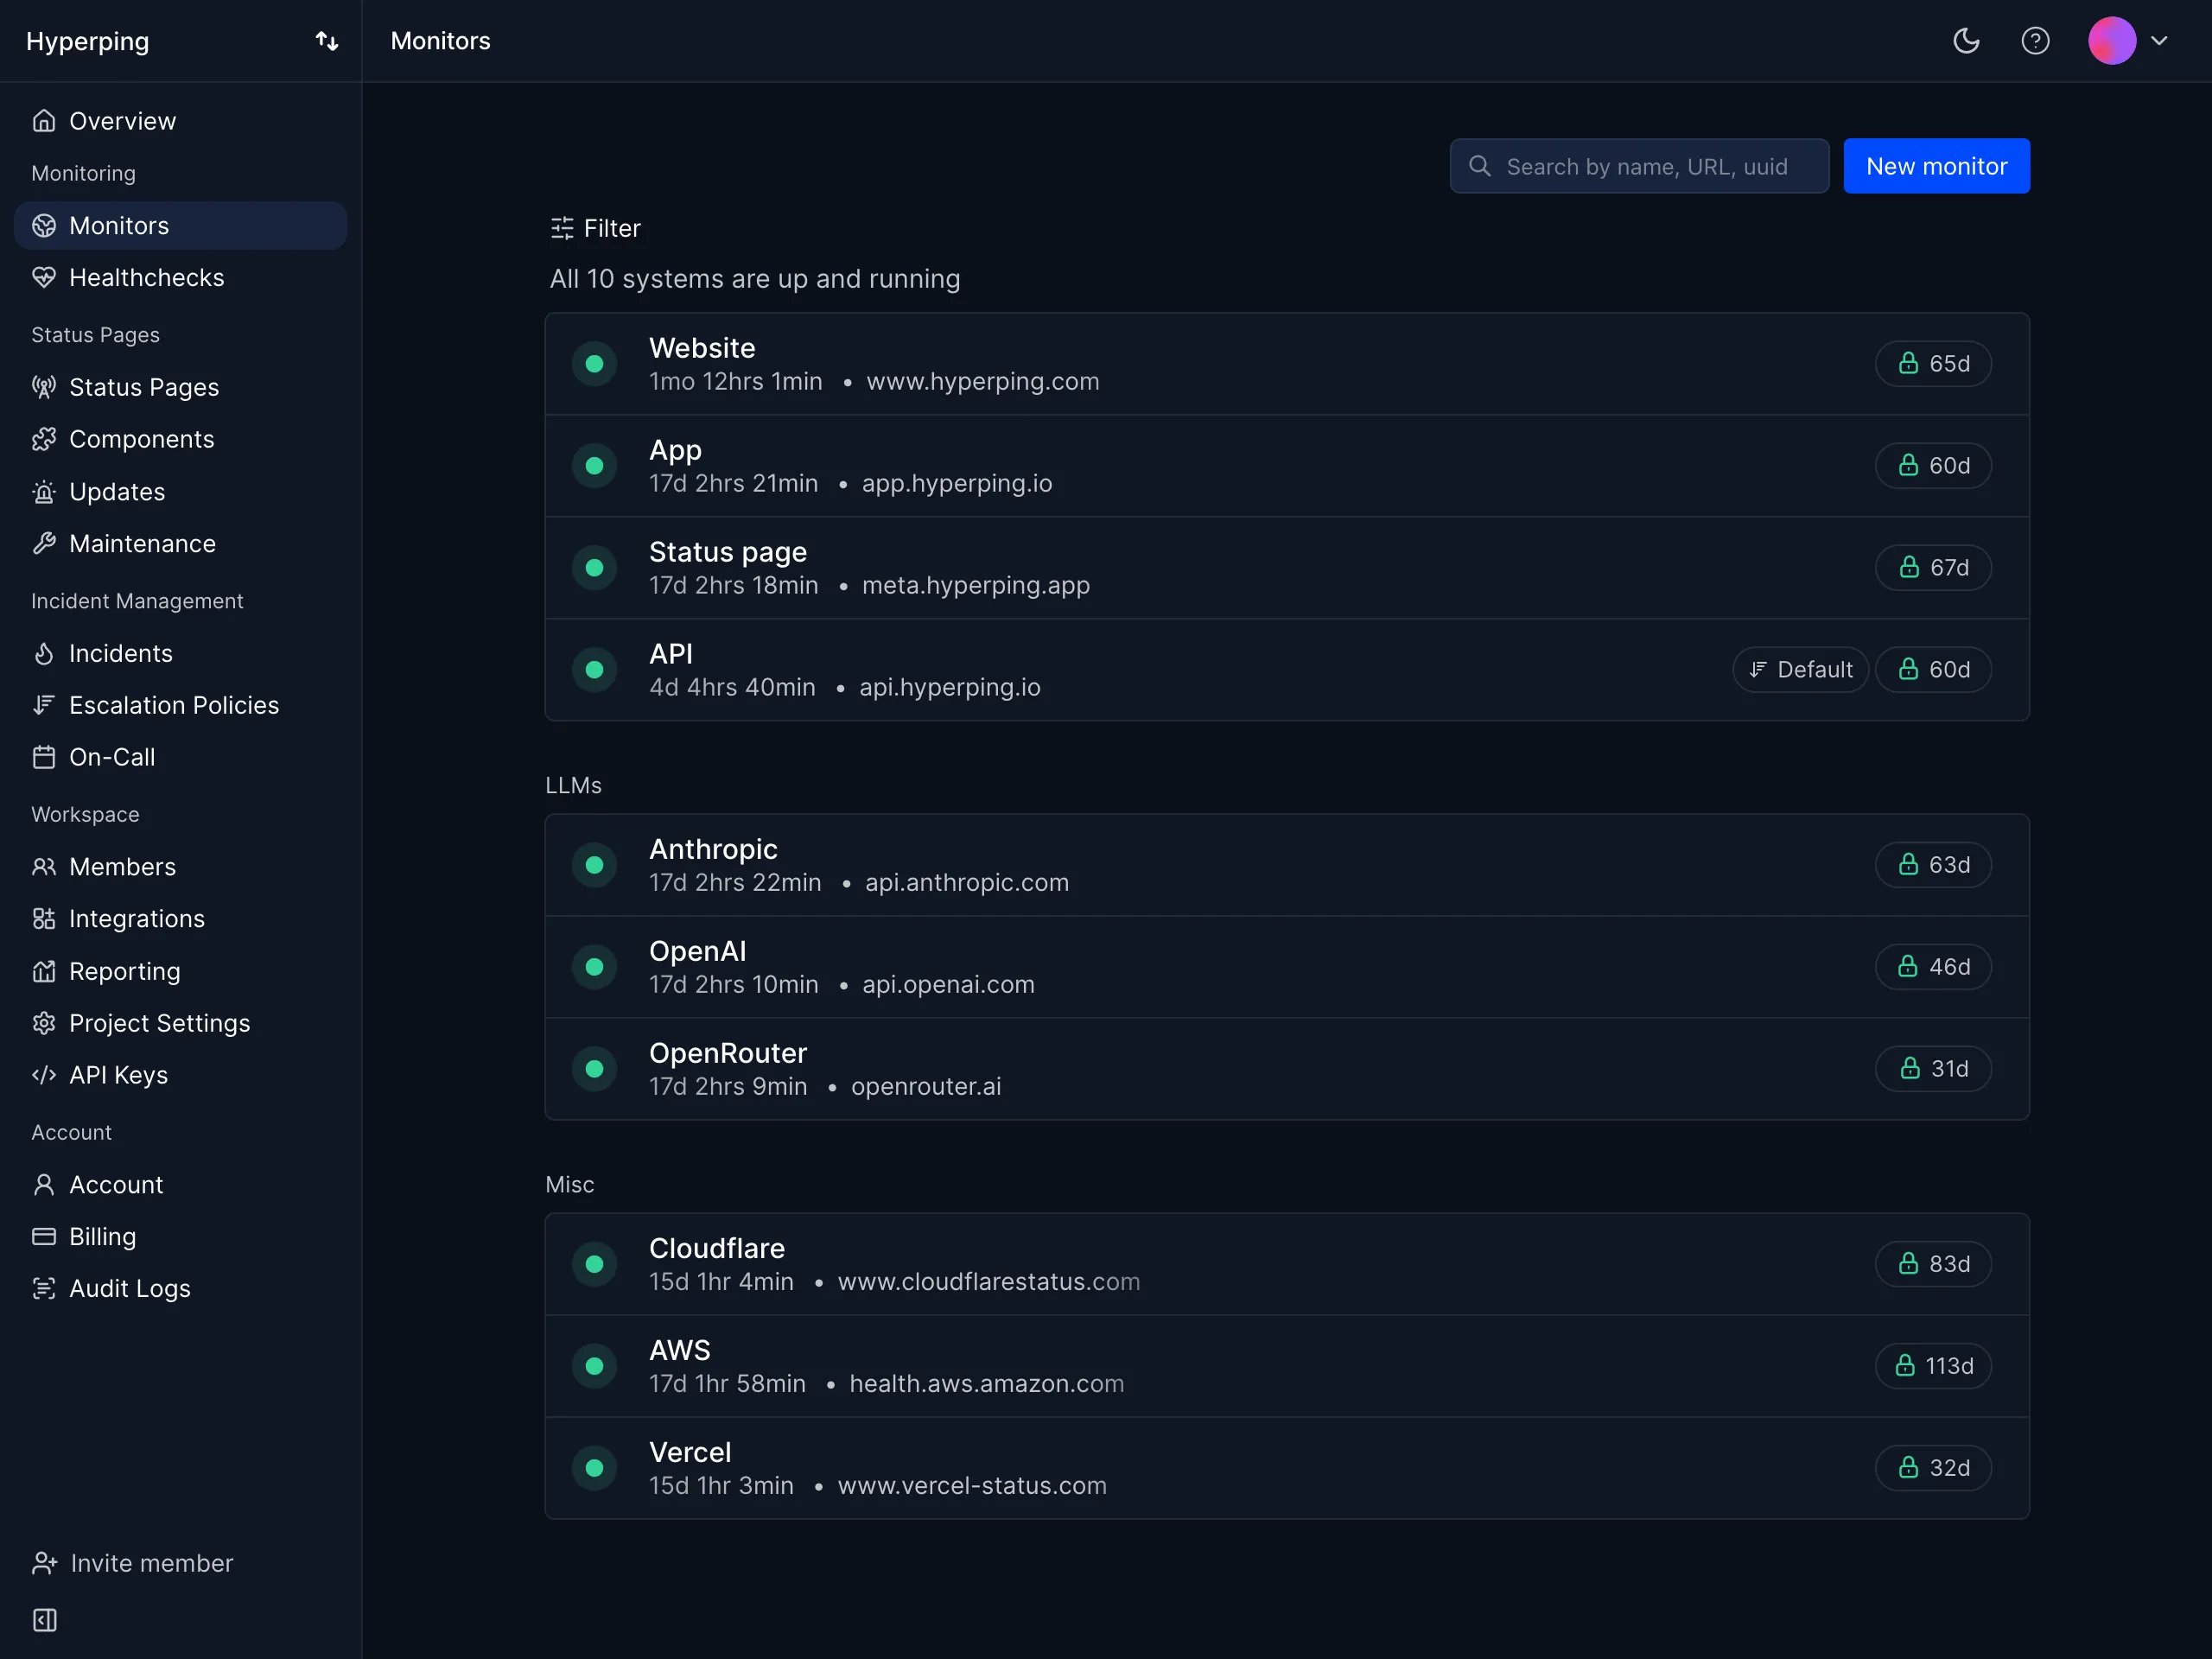
Teams that want reliable uptime monitoring, polished status pages, and on-call scheduling in one platform, without unpredictable pricing or enterprise complexity.
Notable features
- 30-second check intervals: On every paid plan, and 20-second checks on Business.
- On-call scheduling and escalation policies: Flexible schedules with timezone-aware support, automatic rotation, and multi-step escalation, included from Essentials. Not something you typically find in simpler monitoring tools.
- Status pages in the plan: One status page on your own domain from Essentials, 3 public or private pages with multilingual support on Pro, and 10 pages with white labeling on Business. The free plan has one basic page.
- Browser-based synthetic monitoring: Playwright scripts for critical flows like checkout or login, run every 5 minutes at most from Frankfurt and San Francisco in turn.
- Multi-channel alerting: Email, Slack, Microsoft Teams, Discord, Telegram and webhooks, plus SMS, phone calls, PagerDuty and Opsgenie on paid plans.
- Multi-region confirmation: A failure is confirmed from other regions before an outage opens, which cuts false positives.
- Server monitoring: A one-line OpenTelemetry agent install collects CPU, memory, filesystem, disk I/O, and network metrics from Linux and macOS hosts, with server alerts routed through the same escalation policies as your uptime checks.
- European hosting: All data is stored in the EU, in GDPR-compliant, ISO/IEC 27001-certified data centers.
Why choose Hyperping?
Predictable pricing with seats included
Unlike Better Stack's usage-based model (where costs depend on responder count, monitor add-ons, and status page fees), Hyperping sells flat plans with seats included. You know what you will pay each month, and an extra seat has a listed price. With Better Stack, each extra 50 monitors costs $21/month and each responder $29/month (annual billing, October 2026). With Hyperping, 250 monitors, 3 status pages, and 10 seats cost $74/month on Pro.
Complete monitoring platform without enterprise complexity
Most tools force you to choose: simple but limited (basic ping monitors), or powerful but overwhelming (full observability suites requiring dedicated training). Hyperping delivers on-call scheduling, smart escalation policies, synthetic monitoring, and status pages wrapped in an interface you can set up in minutes.
EU-based monitoring that does not compromise on features
Most monitoring tools were built in the US and retrofitted for GDPR compliance as an afterthought. Hyperping is designed from the ground up for European data regulations. Your monitoring data stays in EU data centers, managed by EU companies, with no data transfers to third countries.
Where Hyperping falls short
Hyperping does not try to be a full observability platform. You will not get integrated log management like Better Stack or APM depth like Datadog. If you need to correlate logs, metrics, and traces in a single platform, you will need additional tools.
Browser checks run from two regions only (Frankfurt and San Francisco), every 5 minutes at most, and keep traces and videos for failed runs. If complex browser flows from many locations are critical, a dedicated synthetic platform like Checkly or Datadog goes further. There is no Real User Monitoring and no APM.
Reporting features are more basic than Uptime.com's SLA reporting capabilities.
What users say
"Hyperping has been a total game-changer for us. The service is reliable, easy to use, and incredibly feature-rich. I love that it constantly checks our site and alerts us right away if there are any issues."
"We made our Hyperping status page publicly available and it became a crucial part of our sales pitches. We are proud of our uptime and we love that we can share it with prospects and customers in such an easy way."
Pricing
As of October 2026 (annual billing; monthly billing costs more):
- Free: 20 monitors, 5-minute checks, 1 basic status page, 1 server agent, 1 seat
- Essentials: $24/month ($29 monthly) for 50 monitors, 30-second checks, 1 status page with custom domain and 100 subscribers, 3 browser checks, phone call alerts, on-call and escalation policies, 3 seats
- Pro: $74/month ($89 monthly) for 250 monitors, 3 public or private status pages, 10 browser checks, 10 seats. Includes email access codes, multilingual pages, SMS subscribers, and account SAML SSO.
- Business: $249/month ($299 monthly) for 1,000 monitors, 10 status pages with white labeling, 20-second checks, 25 browser checks, 20 seats, audit logs, and priority support.
Extra seats cost $7, $9, or $12 a month depending on the plan.
Is Hyperping right for you?
Choose Hyperping if you are a startup, SMB, or growing SaaS team that wants solid monitoring, on-call scheduling, and status pages without overpaying or over-configuring. It is particularly appealing for:
- European companies that value GDPR compliance and EU data hosting
- Teams frustrated by per-user or usage-based pricing surprises
- Anyone who wants monitoring that works in minutes rather than hours
- Companies that use status pages as part of their sales and trust-building process
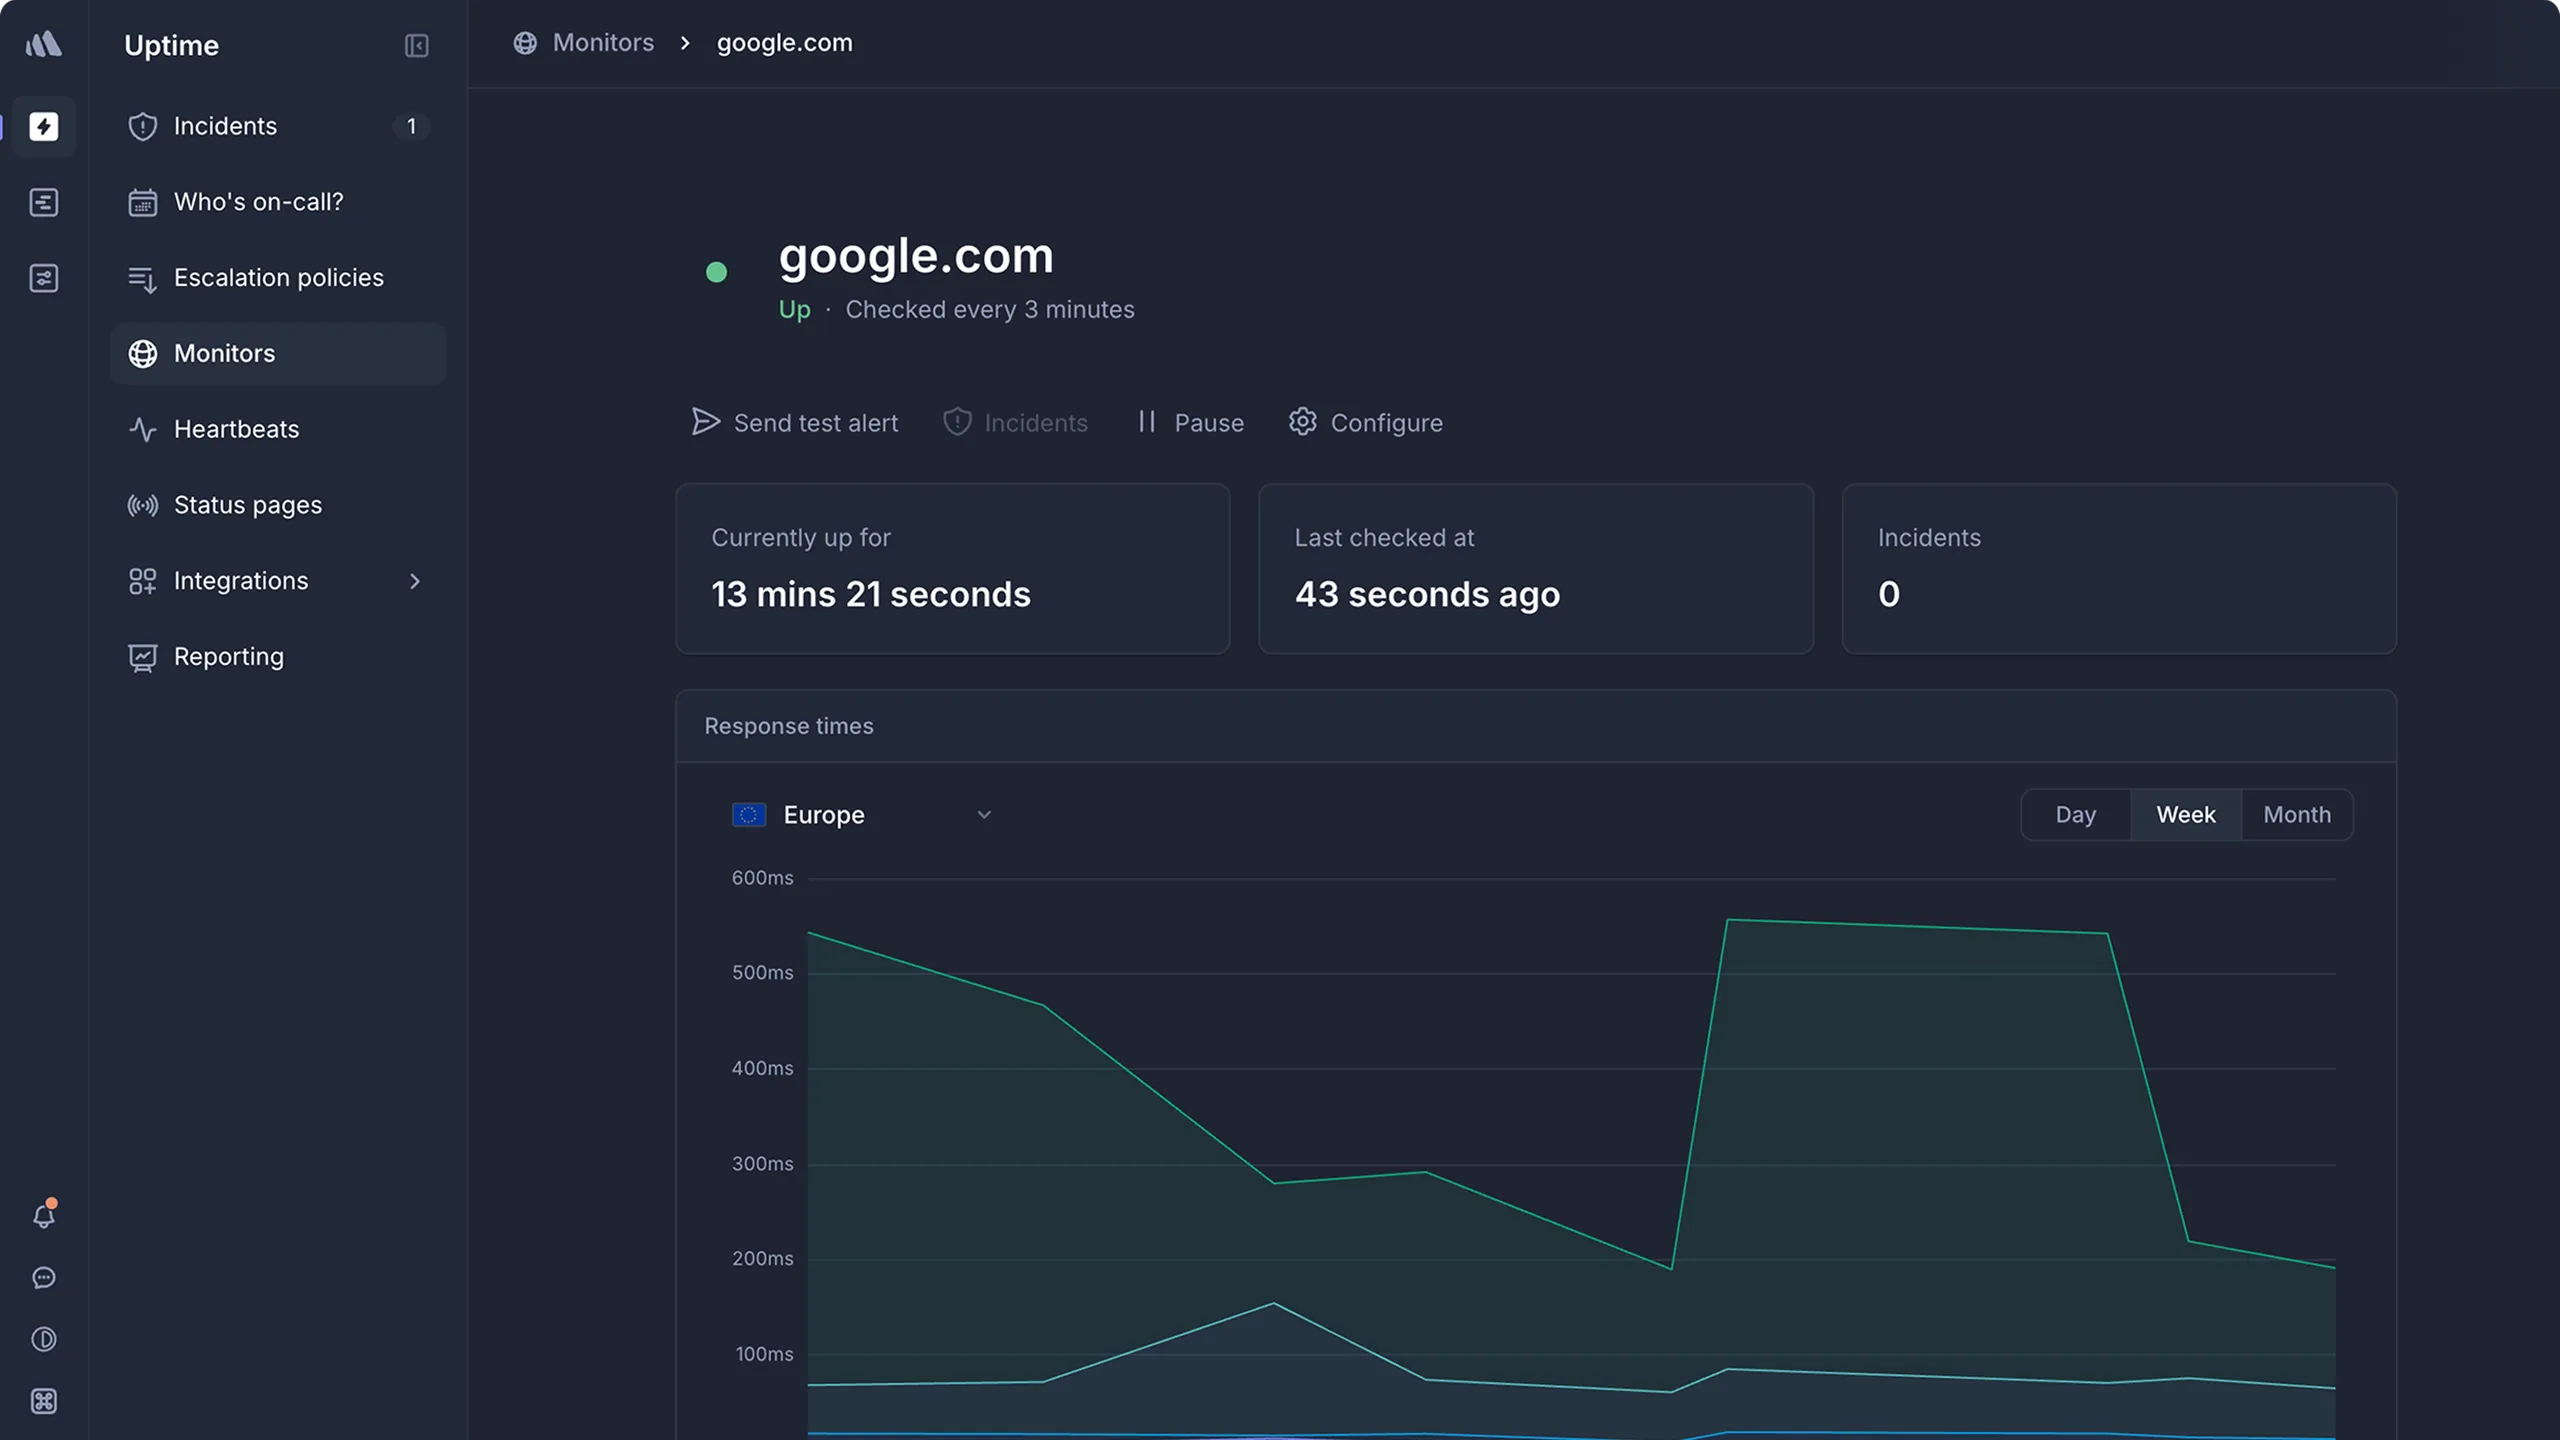
2. Better Stack
Perfect for
Engineering teams that need monitoring combined with centralized logging, incident management, and on-call scheduling in one platform.
Notable features
- Full-stack monitoring: URL checks, SSL monitoring, Playwright-based browser checks, and API monitoring with detailed reporting.
- Centralized log management: Transform logs into structured data with SQL-like querying and visualization across your entire stack.
- Incident management: Built-in incident response tools with AI-powered post-mortems, smart incident merging, and Slack-based workflows.
- On-call scheduling: Calendar-integrated scheduling with smart escalation logic and multi-channel alerting (voice, SMS, Slack, Teams, email, push).
- Status pages: Customizable public status pages with component dependencies and automation.
Why choose Better Stack?
Monitoring, logging, and incidents in one platform
Better Stack combines uptime monitoring with centralized log management and incident response. For teams that currently juggle separate tools for each, this consolidation is the primary draw. Having logging and monitoring in one platform eliminates tool sprawl.
Modern UI and fast setup
The interface is consistently praised in reviews. One user described it as "one of the cleanest interfaces I've used in a monitoring platform." Multiple reviewers noted they had monitoring running "within minutes."
Generous free plan to get started
The free tier (10 monitors) lets teams test the platform without commitment, which is a lower-risk entry point than Uptime.com's paid-only model.
Where Better Stack falls short
Pricing scales quickly with add-ons. As of October 2026, each extra 50 monitors costs $21/month, each responder $29/month, and each extra status page $12/month (annual billing). A G2 reviewer noted that the "initial paid tier starts at $29 which is very steep" for small projects.
The free plan is for personal projects, and it counts monitors and heartbeats against the same limit of 10.
One user reported the UI can be "miserably slow" when loading logs, waiting "2 to 5 minutes" for log data, though this appears to be an isolated experience.
What G2 users say
"Better Stack is an excellent tool for monitoring the availability of sites and services in real-time. Its interface is modern, easy to use, and pleasant on a daily basis."
"The only downside: the cost can quickly rise if you have many monitors or need advanced integrations."
Pricing
As of October 29, 2026:
- Free: 10 monitors and heartbeats combined, 1 status page, for personal projects
- Responder license: $29/month billed annually ($34 monthly) per responder. Paid plans include 10 monitors, 10 heartbeats, and 1 status page. Team members who only read telemetry are free.
Add-ons (annual billing): $21/mo per 50 monitors, $17/mo per 10 heartbeats, $12/mo per extra status page. Logs and other telemetry are billed separately.
Is Better Stack right for you?
Choose Better Stack if you need monitoring, logging, and incident management in one platform and are comfortable with usage-based pricing. It is particularly strong for:
- Teams that want to centralize logs and uptime monitoring in a single dashboard
- Organizations that value a modern UI and fast setup experience
- Startups that can start with the free plan and scale up as needed
If you primarily need monitoring and status pages without logging, Hyperping offers more features at a lower, more predictable price point.
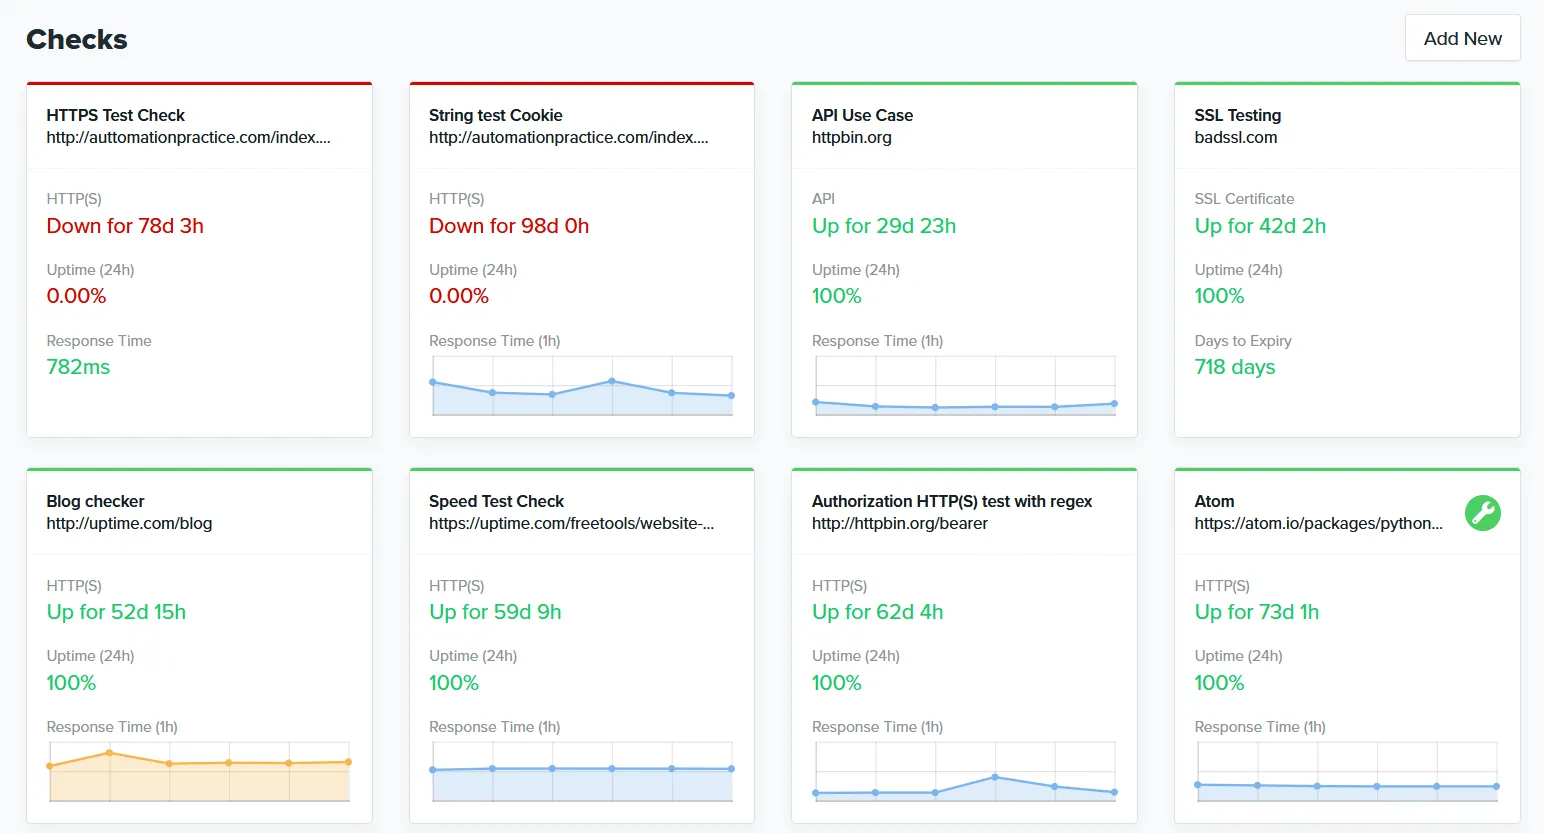
3. Uptime.com
Perfect for
Mid-market and enterprise teams that need comprehensive monitoring with Real User Monitoring (RUM), visual synthetic testing, global probe coverage, and formal SLA reporting.
Notable features
- Visual synthetic monitoring: No-code browser checks through a visual editor for testing user flows without writing code.
- Real User Monitoring (RUM): Track actual visitor experiences and frontend performance metrics across devices and browsers.
- Large global probe network: Checks from many locations, useful for catching regional issues.
- SLA reporting: Detailed SLA compliance reports with historical uptime data, useful for client-facing transparency and executive reporting.
- Multi-type monitoring: HTTP(S), DNS, SSL, WHOIS/domain, TCP/UDP, SSH/SMTP/IMAP/POP, ping, API, and transaction checks.
Why choose Uptime.com?
Real User Monitoring paired with synthetic checks
Few monitoring-focused tools offer both RUM and synthetic monitoring. Uptime.com gives teams full visibility into both simulated and actual user experiences, making it easier to understand how real visitors experience your site alongside your automated checks.
SLA reporting built for client-facing transparency
Uptime.com's SLA reporting is particularly strong. A G2 reviewer noted it was "very helpful for RFPs and vendor contracts." If you need to prove uptime to clients or leadership with formal reports, this is where Uptime.com stands out.
Exceptional customer support
Customer support comes up frequently as a strength in reviews. One reviewer called it "the best I have ever seen" after a detailed, proactive support experience where the team even coordinated with the user's hosting provider directly.
Where Uptime.com falls short
No free plan. Pricing starts at $9/mo as of October 2026, with a 30-day money-back guarantee instead of a free tier.
Several G2 reviewers noted that pricing can feel steep for smaller teams, especially as you scale to more advanced features.
Escalation policies require individual setup per monitor, which can become tedious for large deployments.
The visual editor for synthetic tests is easier to learn than code-based approaches, but it limits flexibility compared to Playwright-based tools.
One reviewer noted the platform could benefit from stronger on-call scheduling and incident management features, which are more limited than dedicated tools like PagerDuty or incident.io.
What G2 users say
"What I like best about Uptime.com is its simplicity and reliability. The platform makes monitoring effortless with clear dashboards, instant alerts, and strong integrations."
"Pricing can feel a bit high for smaller teams, and the initial setup takes some time to fully configure all checks."
Pricing
As of October 29, 2026, Uptime.com sells one Website Monitoring plan priced by volume: it starts at $9/mo ($108/yr), and a calculator sets the price for the number of checks you need. The plan lists uptime, transaction, API, and page speed monitoring, email and SMS alerts, maintenance windows, reporting, and all users included. New accounts get a 30-day money-back guarantee.
Is Uptime.com right for you?
Choose Uptime.com if you need a comprehensive monitoring platform with RUM, SLA reporting, and wide protocol coverage. It is particularly strong for:
- Organizations that need to prove uptime SLAs to clients with formal reports
- Teams that want Real User Monitoring alongside synthetic checks
- Enterprise IT operations that want monitoring from many global locations
If you need on-call scheduling and escalation policies built in, consider Hyperping or Better Stack instead.
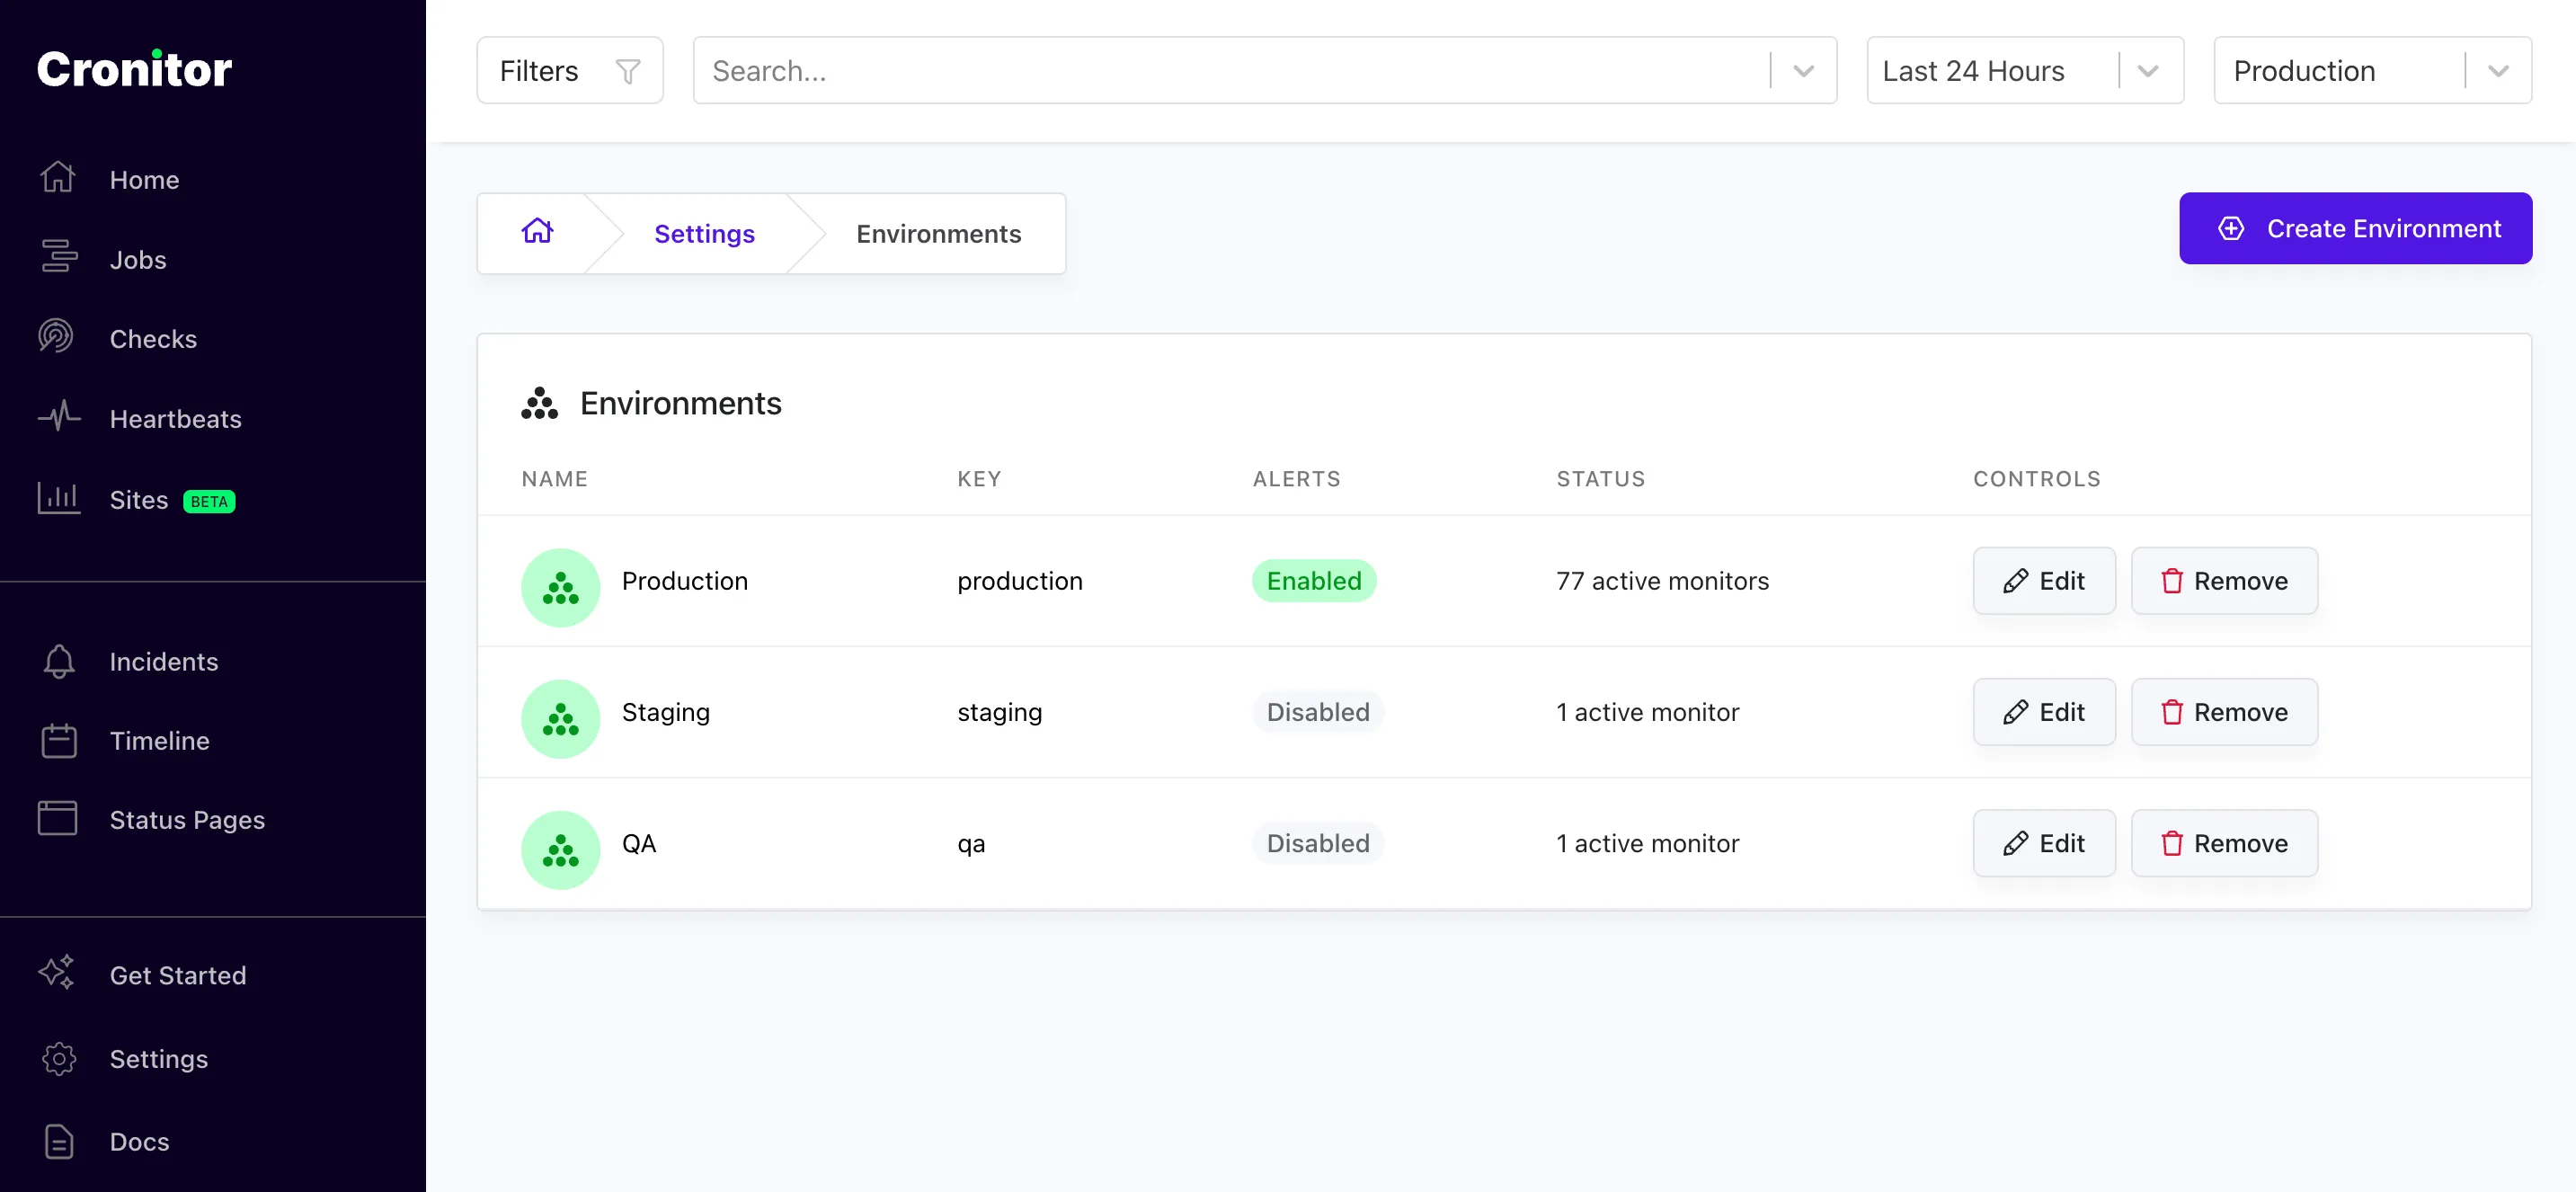
4. Cronitor
Perfect for
Engineering teams that rely heavily on cron jobs and background tasks and want monitoring for those scheduled jobs alongside basic uptime checks and status pages.
Notable features
- Core strength in cron job monitoring: Track cron jobs, background workers, data pipelines, and scheduled tasks using lightweight HTTP pings. Supports cron, fixed-interval, and time-of-day schedules.
- Developer-friendly integration: Jobs call a ping URL via curl/wget without agent installation. Existing crontabs can be imported automatically.
- Uptime monitoring: HTTP checks down to 30-second intervals on Business and Enterprise.
- Status pages: Basic, branded, and private status pages with subscriber notifications.
- Granular alert tuning: Schedule tolerance, performance thresholds, grace periods, and failure tolerance settings to reduce noise.
Why choose Cronitor?
The strongest cron job monitoring available
From the reviews I analyzed, users consistently praise Cronitor for making silent job failures visible. One reviewer noted: "We monitor numerous automated processes with Cronitor, and it has helped us catch small problems before they became large ones." If your team relies on cron jobs for billing, ETL, backups, or reporting, Cronitor's schedule-aware monitoring catches issues that generic uptime tools miss.
Setup in minutes, no agents required
Jobs simply call a ping URL via curl/wget without agent installation. Existing crontabs can be imported automatically. Multiple users reported having monitors running in minutes without complex configuration.
Responsive customer support
Customer support is a recurring theme in positive reviews: "Their support is quick and effective."
Where Cronitor falls short
Per-monitor pricing adds up. At $2/month per monitor on the Business plan, teams with 100+ monitors face significant monthly costs. A recent pricing change impacted teams with high monitor counts.
No voice call alerts. If phone call escalation is important to your team, you will need a separate tool.
No escalation policies. Cronitor lacks the multi-step escalation routing found in Hyperping, Better Stack, or PagerDuty.
Status page functionality is limited compared to dedicated status page tools. A branded page costs $25/month and a private page $50/month.
Some long-time users noted that the UI has become more cluttered as features expanded beyond the original cron monitoring focus.
What G2 users say
"This tool has all you need to monitor your cronjobs, and more."
"Been using this for years, but recently there was a pricing change. If you have many crons, it might not be ideal, since the cost is now based on the number of crons you have."
Pricing
As of October 29, 2026:
- Hacker (Free): 5 monitors, 5-minute checks, 1 user, 1 status page with 50 subscribers
- Business: $2/month per monitor and $5/month per user, 30-second checks, 1 status page with 500 subscribers. Add-ons: branded status page $25/mo, private status page $50/mo, SAML SSO $5/user/mo, browser checks $1 per 1,000 runs
- Enterprise: From $6,000/year, custom limits, advanced SSO and support
Is Cronitor right for you?
Choose Cronitor if your primary need is monitoring cron jobs, data pipelines, and background tasks, with uptime monitoring as a secondary requirement. It is particularly strong for:
- SaaS companies with critical scheduled jobs for billing, reporting, and ETL
- Small to mid-size teams that want cron + uptime + status pages in one tool
- Developers who value quick, code-free setup via simple HTTP pings
If you need escalation policies, voice call alerts, or extensive status pages, consider Hyperping or Better Stack instead.
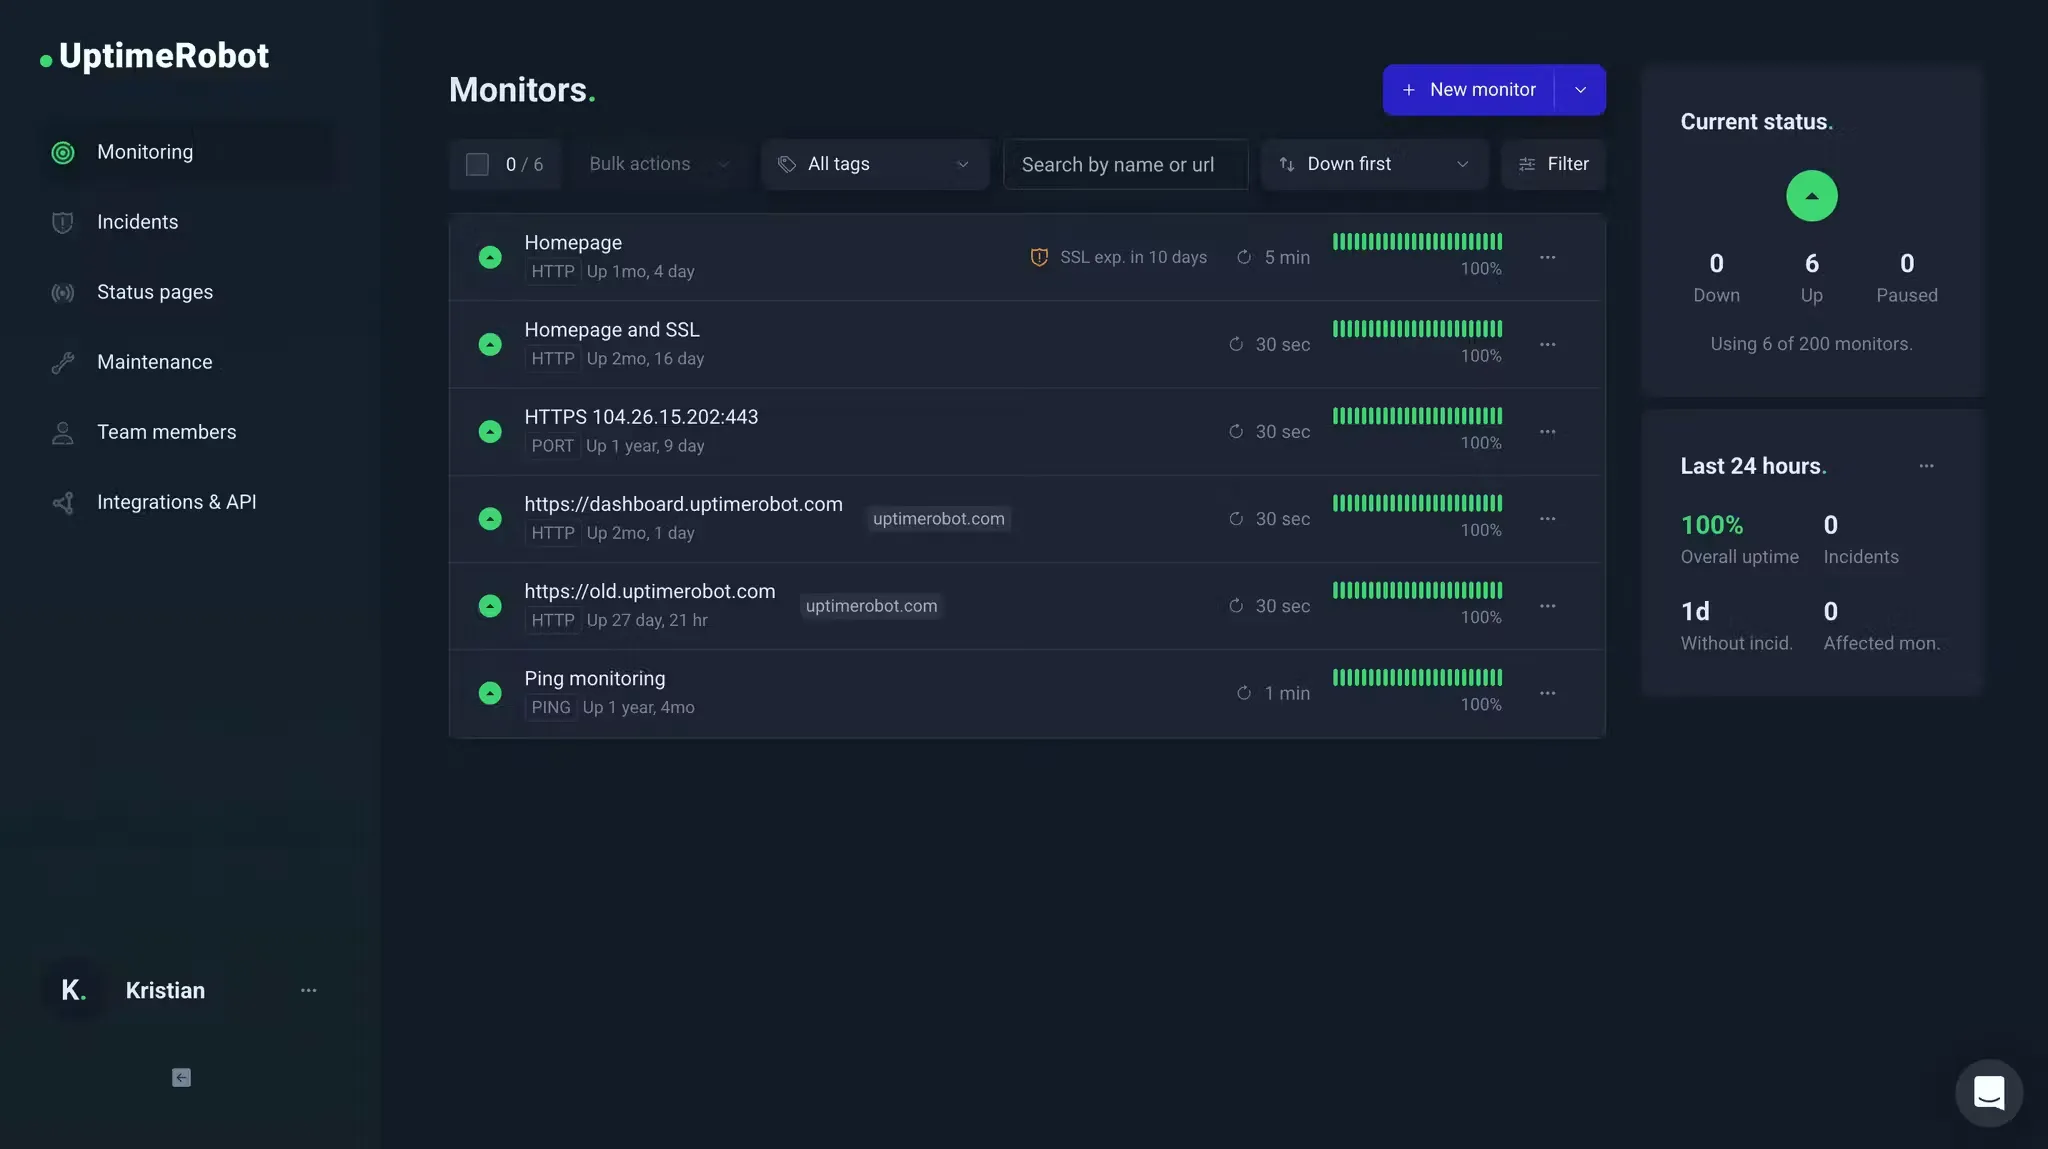
5. UptimeRobot
Perfect for
Small businesses, freelancers, and developers who need straightforward "is it down?" monitoring at the lowest possible cost.
Notable features
- Multiple monitoring types: HTTP(S), ping, port, keyword, DNS, SSL certificate, domain expiry, API, UDP, and heartbeat (cron job) checks.
- Generous free plan: 50 monitors with 5-minute check intervals, significantly more than most competitors' free tiers.
- Status pages: 3 on Solo, 100 white-labeled on Team, and no stated cap on Scale.
- Native mobile apps: iOS and Android apps for on-the-go alert management with push notifications.
- Flexible alerting: Email, SMS, voice credits, push notifications, Slack, Discord, Teams, PagerDuty, webhooks, and more.
Why choose UptimeRobot?
The free plan is genuinely useful
50 monitors at 5-minute intervals covers a lot of ground for personal projects and small sites, and the pricing page allows commercial use. Most competitors cap their free tiers at 5 to 20 monitors, making UptimeRobot the clear winner for budget-conscious teams.
Proven reliability over many years
From the reviews I analyzed, reliability and ease of use are the top themes. One reviewer with 10+ years of experience called it "a very stable tool, reliable, with very few false flags." Another compared it to competitors: "Other tools offer deeper incident resolution capabilities or monitoring from more locations across the globe (BetterStack and HyperPing, for example)," acknowledging the trade-off is feature depth, not reliability.
As of October 29, 2026 (prices as displayed from Europe, billed annually): Solo is $9/month for 10 monitors with 60-second checks, Team is $30/month for 100 monitors with 30-second checks and 3 seats, and Scale is $55/month for 200 monitors with 15-second checks and 5 seats. Scale is the fastest published self-serve interval in this roundup.
Where UptimeRobot falls short
No synthetic monitoring (browser checks). If you need to test multi-step user flows like checkout or login, UptimeRobot cannot do this. Hyperping, Better Stack, and Uptime.com all offer this capability.
No escalation policies. Alerts go to configured channels, and there is incident acknowledgement, but there is no multi-step on-call scheduling.
Free and Solo limitations are noticeable: Free is 5-minute checks. Solo is 60 seconds but only 10 monitors, so upgrading from Free for speed cuts your monitor count. Team matches Hyperping at 30 seconds. Scale is faster at 15 seconds.
On-call and server agents are not in the product. Status-page count is high on Team and Scale, but Hyperping still wins on on-call, server metrics, and Playwright checks.
What G2 users say
"We've been using UptimeRobot for several years as our primary uptime monitoring tool, both for internal and externally facing services. Rock solid stability, generous free tier, and great customer support."
"No Phone Call Alerts. Some competitors offer voice call alerts, but UptimeRobot doesn't."
That second quote is from an older review. UptimeRobot now sells SMS and voice through credits, while phone call alerts are part of every paid Hyperping plan.
Pricing
As displayed from Europe on October 29, 2026 (UptimeRobot prices by region):
- Free: 50 monitors, 5-minute intervals, 1 status page, personal and commercial use
- Solo: $10/month ($9 billed annually) for 10 monitors, 60-second checks, 3 status pages
- Team: $35/month ($30 billed annually) for 100 monitors, 30-second checks, 100 status pages, 3 seats
- Scale: $65/month ($55 billed annually) for 200 monitors, 15-second checks, 5 seats; a 500-monitor tier costs more
- Enterprise: Custom
Extra login seats start at $15/month billed annually.
Is UptimeRobot right for you?
Choose UptimeRobot if you need basic, reliable monitoring at the lowest cost. It is particularly strong for:
- Agencies monitoring dozens of client websites on a tight budget
- Solo developers and freelancers who need a "set it and forget it" monitoring tool
- Small projects where 5-minute check intervals are sufficient
- Teams that want a quick win before investing in a more comprehensive platform
If you need browser checks, escalation policies, or on-call in the same bill, Hyperping provides those at $24/month billed annually on the Essentials plan.
Conclusion
After analyzing 28 uptime monitoring tools, the right choice depends on your specific needs and budget. Here is my tiered guidance:
If you want the best balance of features, simplicity, and value: Hyperping gives you monitoring, on-call, and status pages in flat plans. Seats are included, and additional seats have a listed price. It is the right pick for most startups, SMBs, and growing SaaS teams.
If you need monitoring plus centralized logging: Better Stack combines uptime monitoring with log management and incident response. Be prepared for pricing that scales with usage.
If SLA reporting and Real User Monitoring are priorities: Uptime.com delivers the most comprehensive monitoring coverage with formal SLA reports and a large probe network. Good for enterprise teams with compliance requirements.
If cron job monitoring is your primary need: Cronitor is purpose-built for background task monitoring with uptime checks as a bonus. Watch the per-monitor costs at scale.
If budget is the main constraint: UptimeRobot's free plan with 50 monitors is hard to beat for basic monitoring. Upgrade to Hyperping when you need synthetic checks, on-call, or server agents.
If Site24x7 is on your shortlist: see our Site24x7 alternatives for the full-stack side of the market.
Take these steps to find your best fit:
- List your must-have monitoring needs (SSL checks, cron tracking, synthetic monitoring, status pages)
- Start a free trial of 1-2 tools that match your requirements
- Run the new tool alongside your existing monitoring for at least one week
- Test alerting systems and status pages with your team
Hyperping combines reliable monitoring with on-call scheduling and status pages that teams actually use. Start your free trial to see the difference proper monitoring makes.
Browser checks and API monitoring
This guide ranks tools on uptime first. If scripted user journeys or API assertions are the main job, the shortlists differ:
- Browser checks (synthetic monitoring): see the best synthetic monitoring tools. Hyperping runs Playwright scripts from Frankfurt and San Francisco only; tools built for synthetics offer more locations and devices.
- API monitoring: see the best API monitoring tools, which compares multi-step requests, assertions, and pricing per check.
- Cron jobs: see the best cron job monitoring tools.
What are uptime monitoring tools?
Uptime monitoring tools continuously check your websites, APIs, and servers, then alert you when something goes wrong. They run automatic checks from multiple locations around the world, so you find out about outages before your customers do.
The core benefits:
- Early problem detection: Get alerts before users notice issues. Teams typically cut their downtime in half by spotting and fixing problems early.
- Better customer experience: A reliable website builds trust. When issues occur, your status page keeps users informed automatically.
- Time back for your team: Automated checks free up your team to focus on product improvements, customer support, and feature development.
- Clear performance insights: See exactly how your systems perform, including global availability, response time, and SSL certificate health.
- Streamlined communication: Keep everyone in the loop with automated status page updates, incident history, and maintenance schedules.
Basic vs advanced monitoring
Basic monitoring only checks if your site responds. Advanced monitoring goes further:
- Runs synthetic browser checks that simulate user flows
- Tests from multiple global locations simultaneously
- Alerts specific team members through escalation policies
- Connects to your existing toolset (Slack, PagerDuty, Teams)
- Creates detailed performance reports
Types of monitoring
Different services need different kinds of monitoring. Each type serves a specific purpose to keep your systems running smoothly.
- URL/HTTP monitoring: The simplest check. Does your website respond when someone visits? This confirms your site is accessible to visitors.
- Port monitoring: Checks connection points beyond your website, including database connections, email servers, and other technical access points.
- Cron job monitoring: Confirms your scheduled tasks run correctly. Backups, data pipelines, and maintenance happen when they should.
- Synthetic monitoring (browser checks): Scripts that click through your site in a real browser. See the synthetic monitoring tools guide.
- SSL certificate monitoring: Watches your security certificates to prevent expiration. No more surprise security warnings for your visitors.
- Keyword monitoring: Alerts you when specific words appear or vanish from your pages. Useful for tracking error messages or required content.
- API monitoring: Checks that endpoints answer with the right status and content. See the API monitoring tools guide.
- Performance monitoring: Tracks your website's speed metrics, including page load times, server response, and resource loading.
- Server monitoring: Collects host metrics such as CPU, memory, filesystem usage, disk I/O, and network throughput from an agent running on the machine. External checks cannot see a disk filling up or memory pressure building until a request finally fails.
- Real User Monitoring (RUM): Collects data from actual visitors using your website. You see exactly how people experience your site across different devices, browsers, and locations.
Why use multiple monitoring types
A single monitoring type leaves gaps in your coverage. Combining several types:
- Catches different kinds of problems
- Reveals issues that hide from basic checks
- Gives each team member relevant data
- Provides complete coverage for complex architectures
Monitoring frequency guide
Each type needs its own schedule:
- Basic HTTP checks: Every 30 seconds to 5 minutes
- SSL monitoring: Daily
- Synthetic monitoring: Every 5-15 minutes
- Cron job monitoring: Matches your task schedule
- API monitoring: Every 1-5 minutes
Related reading
- Migrate from UptimeRobot to Hyperping: step-by-step migration guide
- Migrate from Pingdom to Hyperping: step-by-step migration guide
- Migrate from Better Stack to Hyperping: step-by-step migration guide
- Best UptimeRobot alternatives: if you're leaving UptimeRobot specifically
- Best Pingdom alternatives: if you're comparing Pingdom specifically
- Uptrends alternatives: where to go from Uptrends, with Uptrends vs Pingdom
- Best Site24x7 alternatives: full-stack monitoring suites and lighter options
- Best Datadog alternatives: observability tool alternatives
- Best Better Stack alternatives: Better Stack comparison
- Best synthetic monitoring tools: browser checks compared
- Best API monitoring tools: API checks compared
- Escalation policies guide: pair monitoring with proper incident routing
- MTTR guide: measure and improve your incident response time
- SLA vs SLO vs SLI: understand the reliability metrics
- Linux server monitoring guide: CPU, memory, disk, and network monitoring on your hosts
- Uptime monitoring hub: all our monitoring resources
FAQ
What is the best free uptime monitoring tool? ▼
As of October 2026, UptimeRobot has the largest free plan: 50 monitors at 5-minute intervals, allowed for personal and commercial projects. Hyperping's free plan has 20 monitors, 5-minute checks, one basic status page and one server agent. Better Stack's free plan covers 10 monitors and heartbeats combined for personal projects, and Cronitor's has 5 monitors. If you can run your own server, Uptime Kuma is open source and free to self-host.
How do I monitor my website uptime? ▼
Set up monitoring in five steps: choose an uptime monitoring tool, add your website URLs, configure check frequency (typically 30 seconds to 5 minutes), set up notification channels (email, Slack, SMS), and optionally configure status pages for customer-facing communication.
What is a good website uptime percentage? ▼
Most businesses aim for 99.9% uptime ("three nines"), which translates to roughly 8.76 hours of downtime per year. Many enterprise SLAs require 99.99% uptime, allowing less than 1 hour of downtime per year.
How much does uptime monitoring cost? ▼
As of October 2026, every tool in this guide except Uptime.com has a free plan. Paid entry plans start around $9 a month (UptimeRobot Solo, Uptime.com) and $24 a month (Hyperping Essentials, billed annually). For a team of about 10 people with 250 monitors, prices range from $74 a month on Hyperping Pro to several hundred dollars on per-user or per-monitor pricing.
What is the difference between uptime and performance monitoring? ▼
Uptime monitoring checks if your service is responding at all. Performance monitoring measures how well your service performs, tracking metrics like page load times, server response times, and resource loading. Most modern monitoring tools include basic performance data alongside uptime checks.
Can I use multiple monitoring tools together? ▼
Many teams do. We have customers using Hyperping alongside larger tools like Datadog or AWS CloudWatch for external perspective. Refiner uses Hyperping as an independent monitoring solution that pings their API and websites from the outside in addition to CloudWatch.
How often should website uptime be checked? ▼
For critical systems, check every 30 seconds to 1 minute. For standard business websites, every 5 minutes is sufficient. Non-critical systems can be checked every 10-15 minutes. The right frequency depends on how quickly you need to detect and respond to issues.