Uptime reports
Track uptime, outages, MTTA and MTTR across your monitors, and export the numbers for SLA reviews. To convert an SLA percentage into the downtime it allows, use the SLA and uptime calculator.
The reporting dashboard aggregates your monitoring data into per-monitor statistics: uptime percentage, outage counts, total downtime, and recovery metrics like MTTR and MTTA. It gives you both a high-level view across all monitors and the ability to drill down into specific incidents or timeframes.
Reports are useful when:
- You need to prove uptime to a customer or auditor as part of an SLA
- You run a monthly or quarterly reliability review with your team
- You are writing a postmortem and need exact outage counts and durations
- You want to track how quickly your on-call team acknowledges and resolves incidents
Access the reporting dashboard
- Open the Reporting section
Open the Hyperping dashboard and click Reporting in the left sidebar.
- Set the period and filters
Adjust the report period to the timeframe you want to review, and filter down to the monitors or incidents you care about.
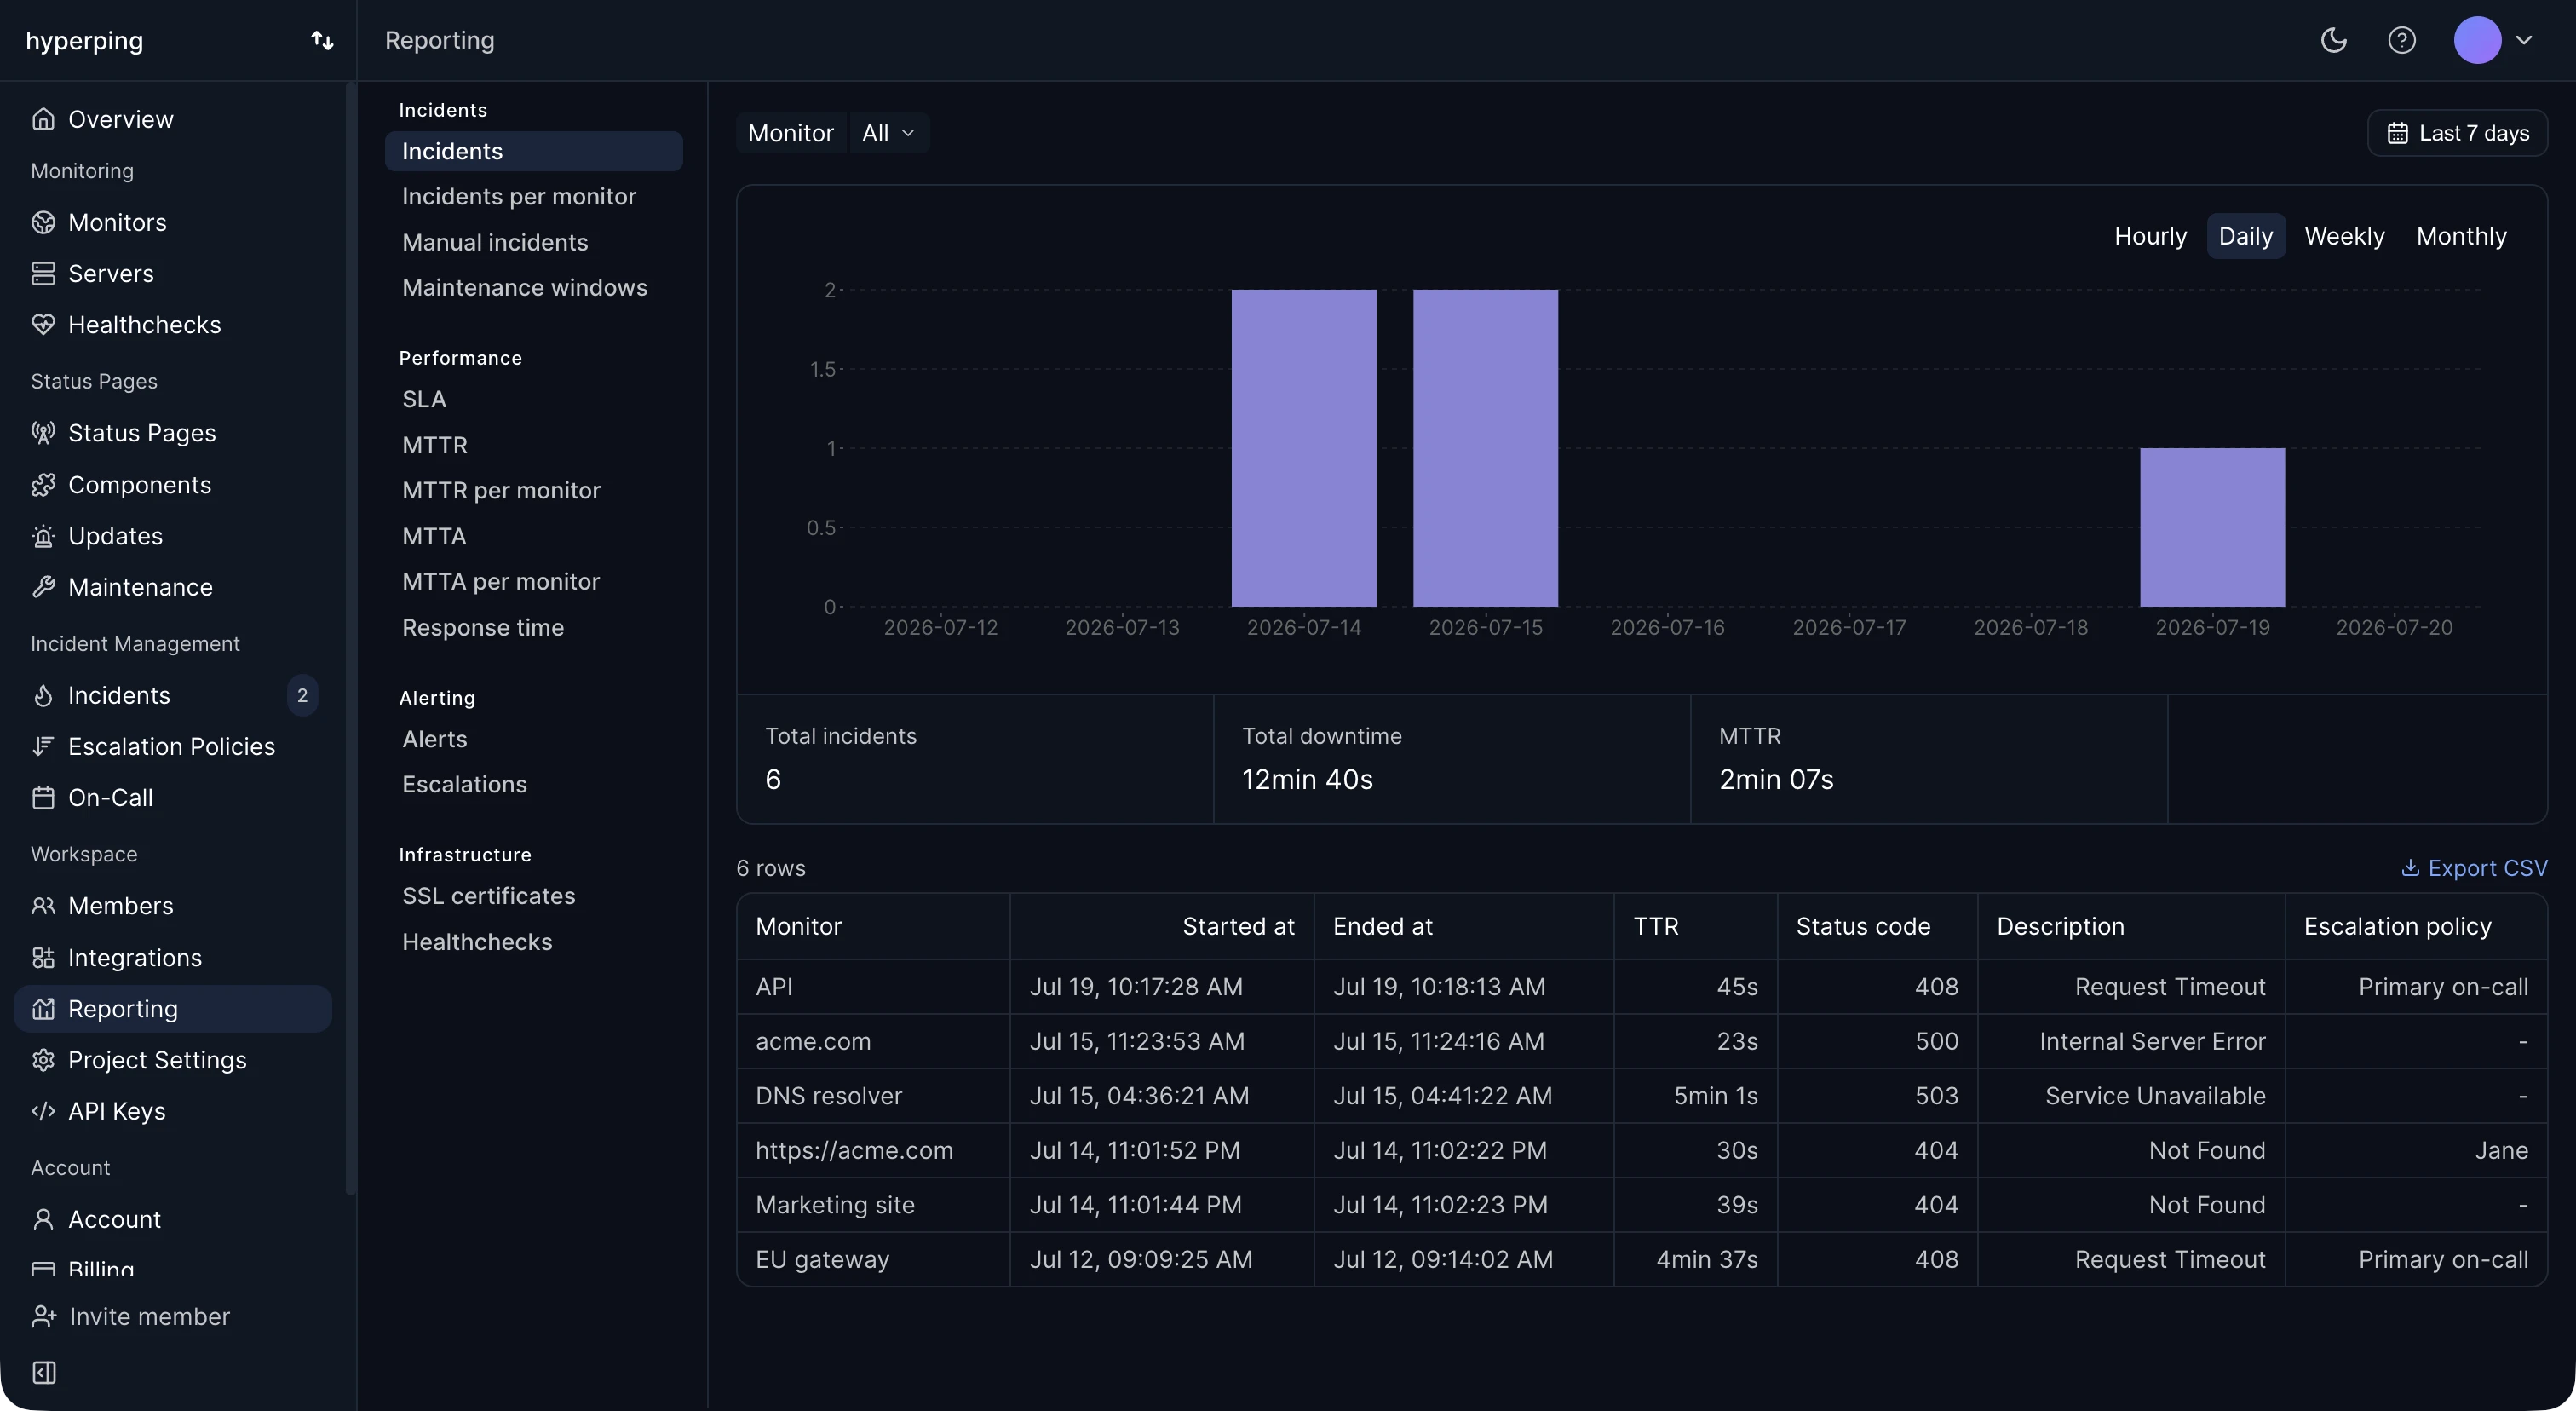
What the report shows
| Metric | Description |
|---|---|
| Uptime (SLA) | Percentage of time the monitor was up during the selected period |
| Outages | Number of outages, total downtime, and the longest outage in the period |
| MTTR | Mean Time to Recovery: how long it takes on average to resolve an outage |
| MTTA | Mean Time to Acknowledge: how long it takes on average for a team member to acknowledge an alert |
The dashboard also keeps a complete outage history you can browse and filter, so every number in the report can be traced back to the individual incidents behind it.
Uptime SLA reporting
If your contracts include an availability commitment, the report gives you the evidence. Set the report period to your contractual reporting window, typically a calendar month or quarter, and read the uptime percentage per monitor. A 99.9% monthly target allows roughly 43 minutes of downtime, so the outage breakdown shows exactly where that budget went.
Because Hyperping checks your services from the outside, these numbers reflect what your customers actually experienced, which is what auditors and customers ask for in SLA reviews.
Weekly email reports
Hyperping can also send you a weekly report by email: a recurring summary of how your monitors performed over the past week, so your team gets the numbers without opening the dashboard. Weekly reports are available on every plan, including Free. If you would rather not receive them, you can turn them off from your settings in the dashboard.
Export to CSV
You can download your metrics in CSV format for custom analysis. The export respects the filters you applied, so you can hand a customer the exact period covered by their SLA, or pull outage data into a spreadsheet for a postmortem.
Common uses:
- Attaching uptime evidence to an SLA review or compliance audit
- Building custom charts in a spreadsheet or BI tool
- Archiving monthly reliability numbers alongside your postmortems
Pull reports programmatically
The same data is available through the Reports API. It returns SLA, MTTR and outage data for all monitors in your project, or for a single monitor:
curl https://api.hyperping.io/v2/reporting/monitor-reports \
-H "Authorization: Bearer ${API_TOKEN}"Response200 OK
{
  "period": {
    "from": "2025-04-30T23:28:48.404Z",
    "to": "2025-05-06T23:28:48.404Z"
  },
  "monitors": [
    {
      "uuid": "mon_e3nJvpusxl6l3C",
      "name": "Website",
      "protocol": "http",
      "sla": 99.184,
      "outages": {
        "count": 2,
        "totalDowntime": 4231,
        "totalDowntimeFormatted": "1hr 10min 31s"
      },
      "mttr": 2116,
      "mttrFormatted": "35min 16s"
    }
  ]
}
Pass from and to query parameters in ISO 8601 format to set the period. Without them, the report covers the last 7 days. The response includes each monitor's sla, outage counts and durations, and mttr, so you can feed the numbers into your own dashboards or scheduled SLA jobs. Your API token is available in the Developers tab of your project settings.
Query reports from AI assistants
If you use Claude, Cursor, or another assistant that supports MCP, you can connect it to the Hyperping MCP server and ask for these numbers in plain language. The server exposes reporting tools like get_monitor_uptime, get_monitor_mttr and get_monitor_mtta, so questions like "what was our uptime last month" or "which monitor has the worst MTTR" get answered from your live data.