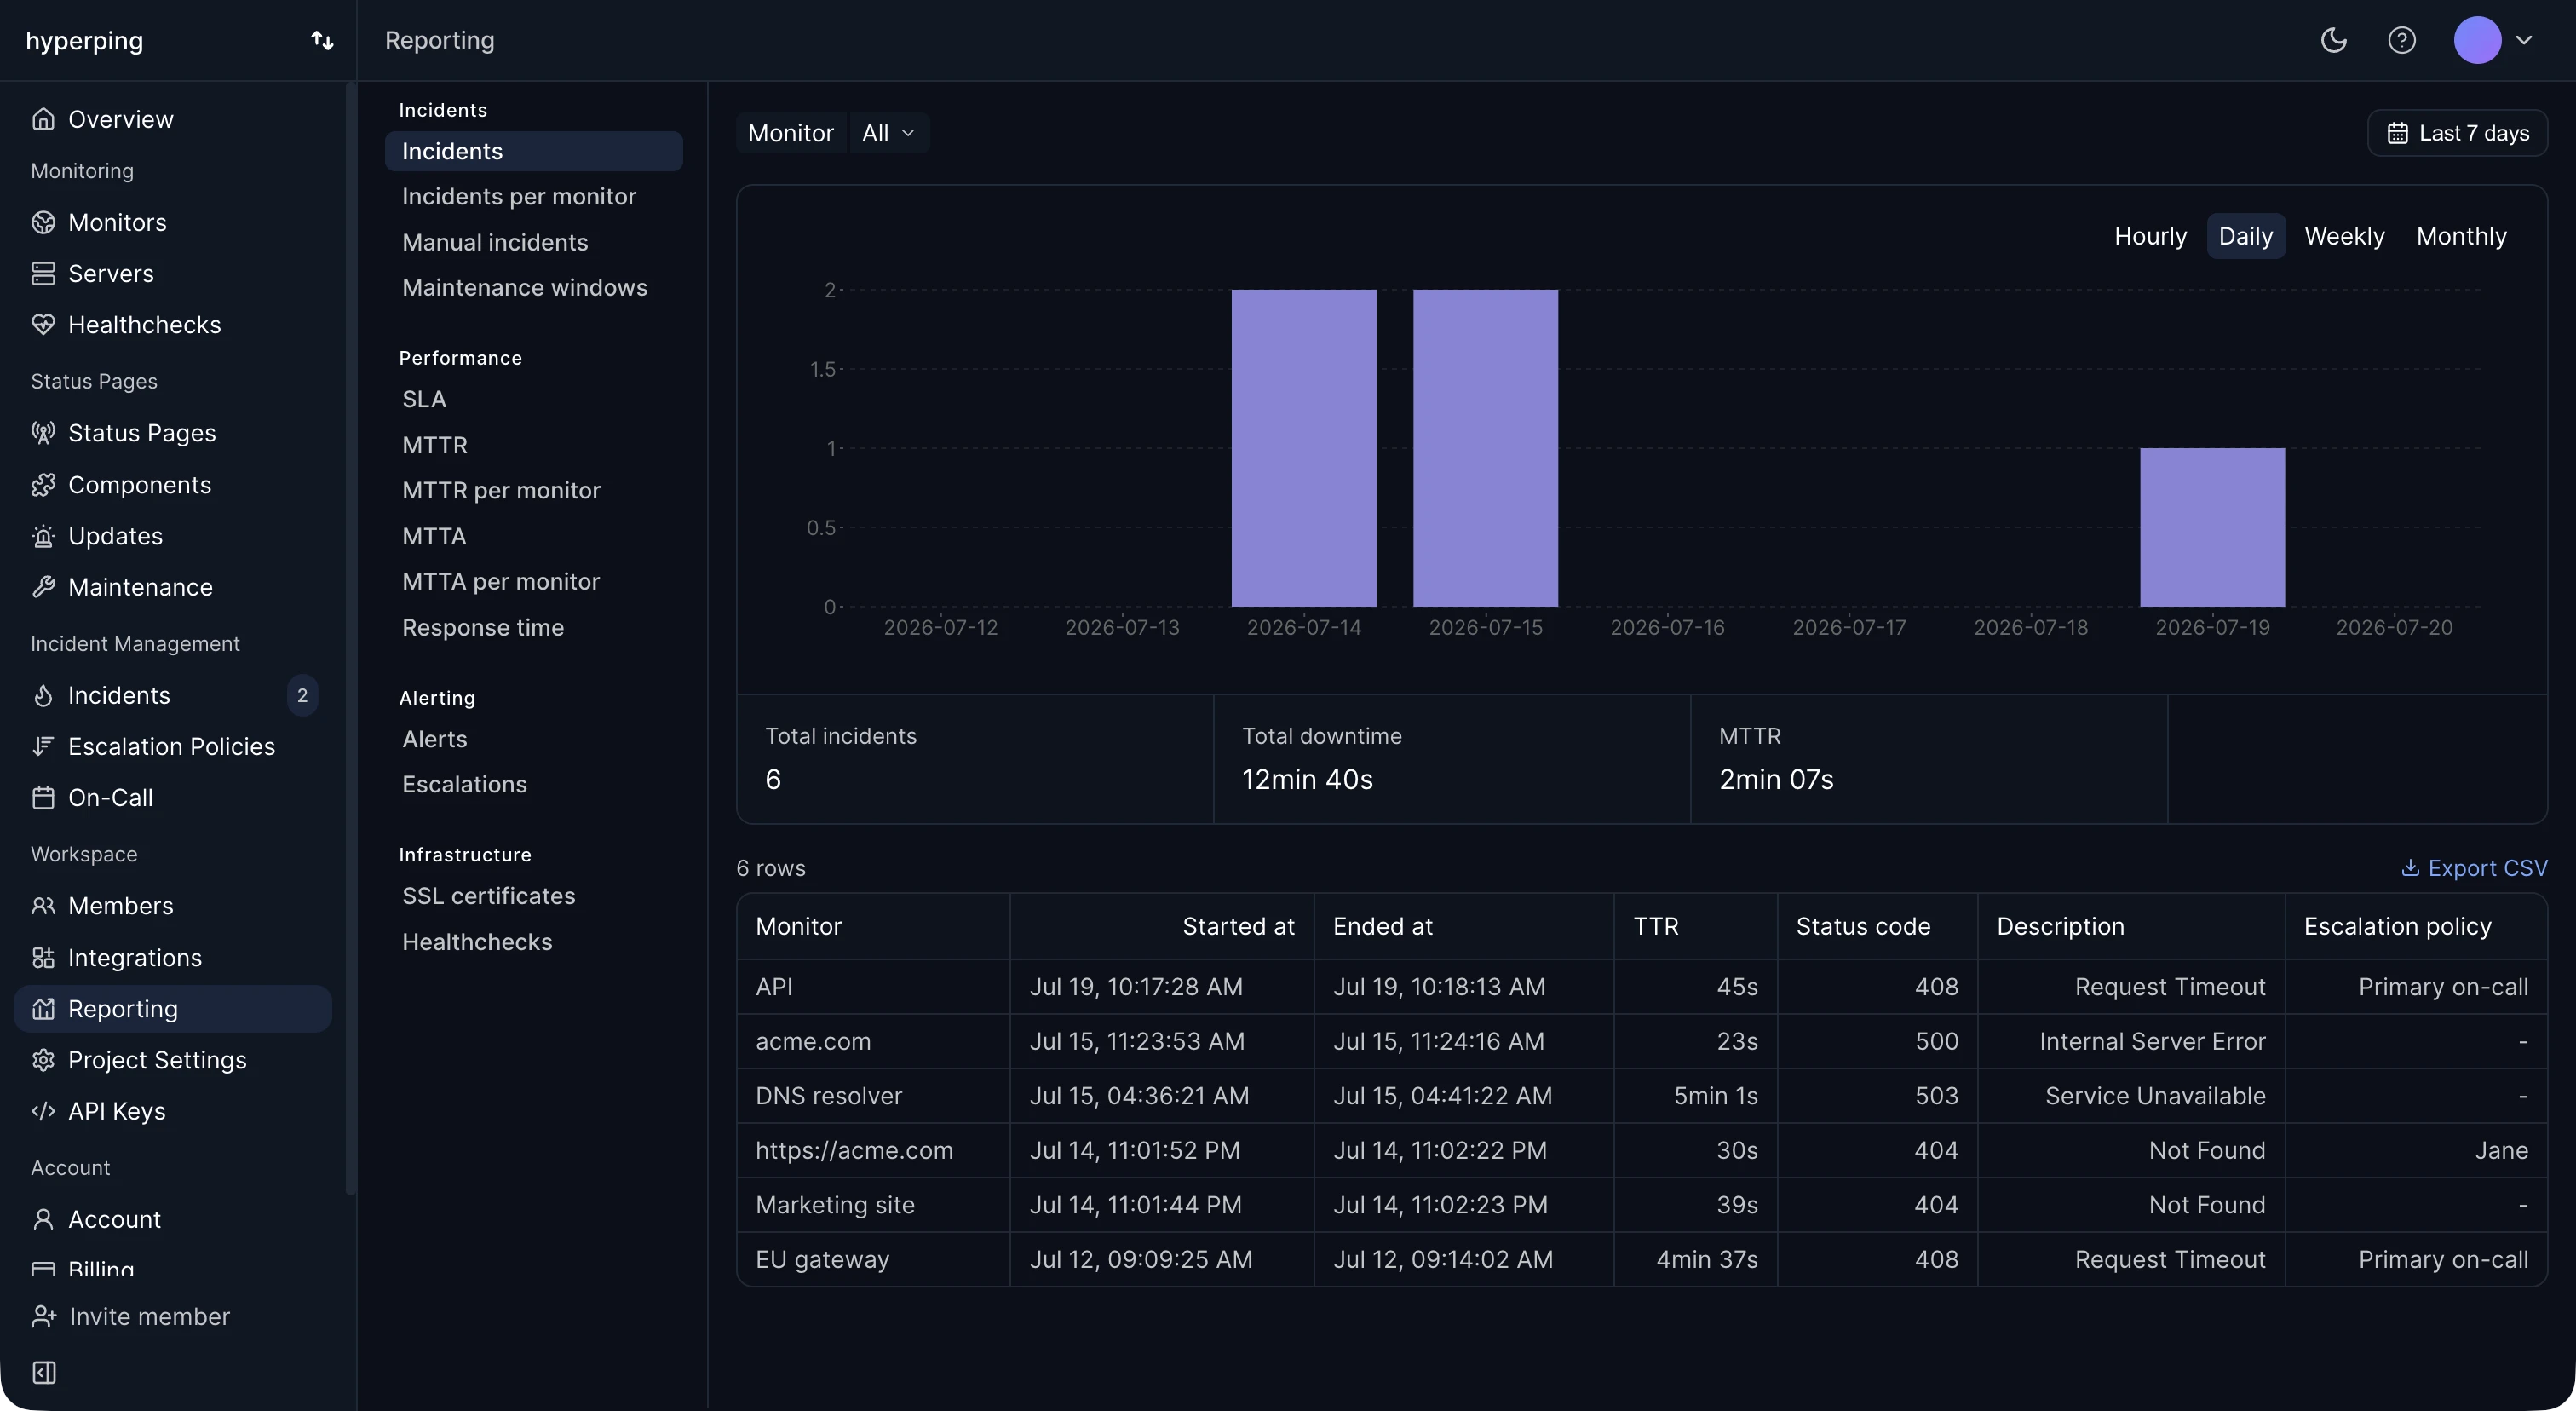
Every monitoring tool measures MTTR from its own events, so check where the clock starts and stops before you compare numbers. In Hyperping, the clock starts when an outage is confirmed from more than one region and stops when the monitor answers normally again. The reporting dashboard shows MTTR for every monitor next to MTTA, uptime, and total downtime, and the Reports API returns the same figures.
How to calculate MTTR
The formula is MTTR = total downtime / number of incidents, over one period and one service.
Say your API had three outages in September, lasting 12, 50, and 28 minutes. That's 90 minutes of downtime over 3 incidents, so the MTTR is 30 minutes. The MTTR calculator does the same arithmetic on your own numbers, along with MTBF, MTTA, and availability.
An average hides the shape of your incidents. Three 30-minute outages and the month above produce the same MTTR, but the 50-minute one is the incident your customers remember. Read MTTR next to your longest incident of the period, and keep production and staging in separate reports, or a flaky test environment will drag the number around.
Recovery, repair, or resolve
The R in MTTR stands for different words depending on who wrote the report, and each one stops the clock at a different moment.
- Recovery (or restore) stops when users can use the service again. This is the version most uptime and incident tools report, and the one used here.
- Repair stops when the broken component is fixed. If you rolled back first and fixed the bug two days later, MTTR to repair is two days.
- Resolve stops when the incident is closed, which can include cleanup and follow-up work after service is restored.
- Respond is sometimes used too. It measures how fast someone starts working on the problem, which is closer to MTTA.
Pick one definition for your team and write it next to the metric. Two teams that both report "30 minutes" can be measuring very different things.
MTTR, MTTD, MTTA, MTBF, and MTTF
MTTR is one of five mean-time metrics. Each covers a different stretch of the same incident, so they're most useful read together.
- MTTD (mean time to detect) runs from the moment something breaks to the moment monitoring or a person notices. A high MTTD means your checks don't cover what actually fails, or don't run often enough.
- MTTA (mean time to acknowledge) runs from the alert to a responder taking ownership. A high MTTA usually points at alert fatigue, a gap in the on-call schedule, or notifications going to a channel nobody watches.
- MTTR (mean time to recovery) runs from detection to restored service, so it includes MTTA.
- MTBF (mean time between failures) is the average uptime between two incidents on a system you repair. It measures how often things break, where MTTR measures how fast you fix them.
- MTTF (mean time to failure) is the average lifetime of a part you replace rather than repair, like a disk. The server the disk sits in has an MTBF.
MTBF and MTTR together give you availability: availability = MTBF / (MTBF + MTTR). A service that fails every 30 days and takes 30 minutes to recover is available 99.93% of the time.
How to reduce MTTR
Look at where the minutes go before changing anything. If MTTA is a large share of MTTR, the time is spent waiting for someone to pick up the alert, and faster debugging won't help.
- Detect sooner. A check every 5 minutes can let an outage run for 5 minutes before anyone knows. Hyperping checks every 30 seconds on paid plans.
- Get the alert acknowledged. Send critical alerts by phone call or SMS, and use an escalation policy so an unacknowledged alert reaches a second person after a few minutes.
- Make the first action obvious. A runbook link in the alert and a rollback that takes one command save more time than anything else during the incident.
- Stop repeat incidents. A post-mortem with owned action items lowers MTTR over time because the same failure doesn't need recovering twice.
For benchmarks and a longer list of tactics, read the MTTR guide.
FAQ
What is a good MTTR?
Aim for under one hour on customer-facing services. That's the threshold DORA uses for its top-performing teams. If most of your incidents run longer, detection and acknowledgement are usually the cheapest places to cut.
Does MTTR include detection time?
Usually not. Most tools start the clock when the problem is detected, so slow detection doesn't show up in MTTR at all. Track MTTD separately, or your MTTR will look good while customers wait.
Is MTTR a DORA metric?
Yes. It was one of the original four DORA metrics as "time to restore service". Since 2023 DORA calls it failed deployment recovery time and counts only failures caused by a deployment, not outages from other causes.
What is the difference between MTTR and MTBF?
MTTR measures how long a failure lasts. MTBF measures how long the system runs between failures. Rising MTBF with flat MTTR means the system is getting more stable. Falling MTTR with flat MTBF means you're getting faster at recovery without fixing root causes.