Getting started with monitoring
Everything you need to detect downtime before your customers do: one monitor, the right alert channels, and a place to watch it all. Three steps. If you are still evaluating, the uptime monitoring overview covers what Hyperping checks and how alerting works.
- Create your first monitor
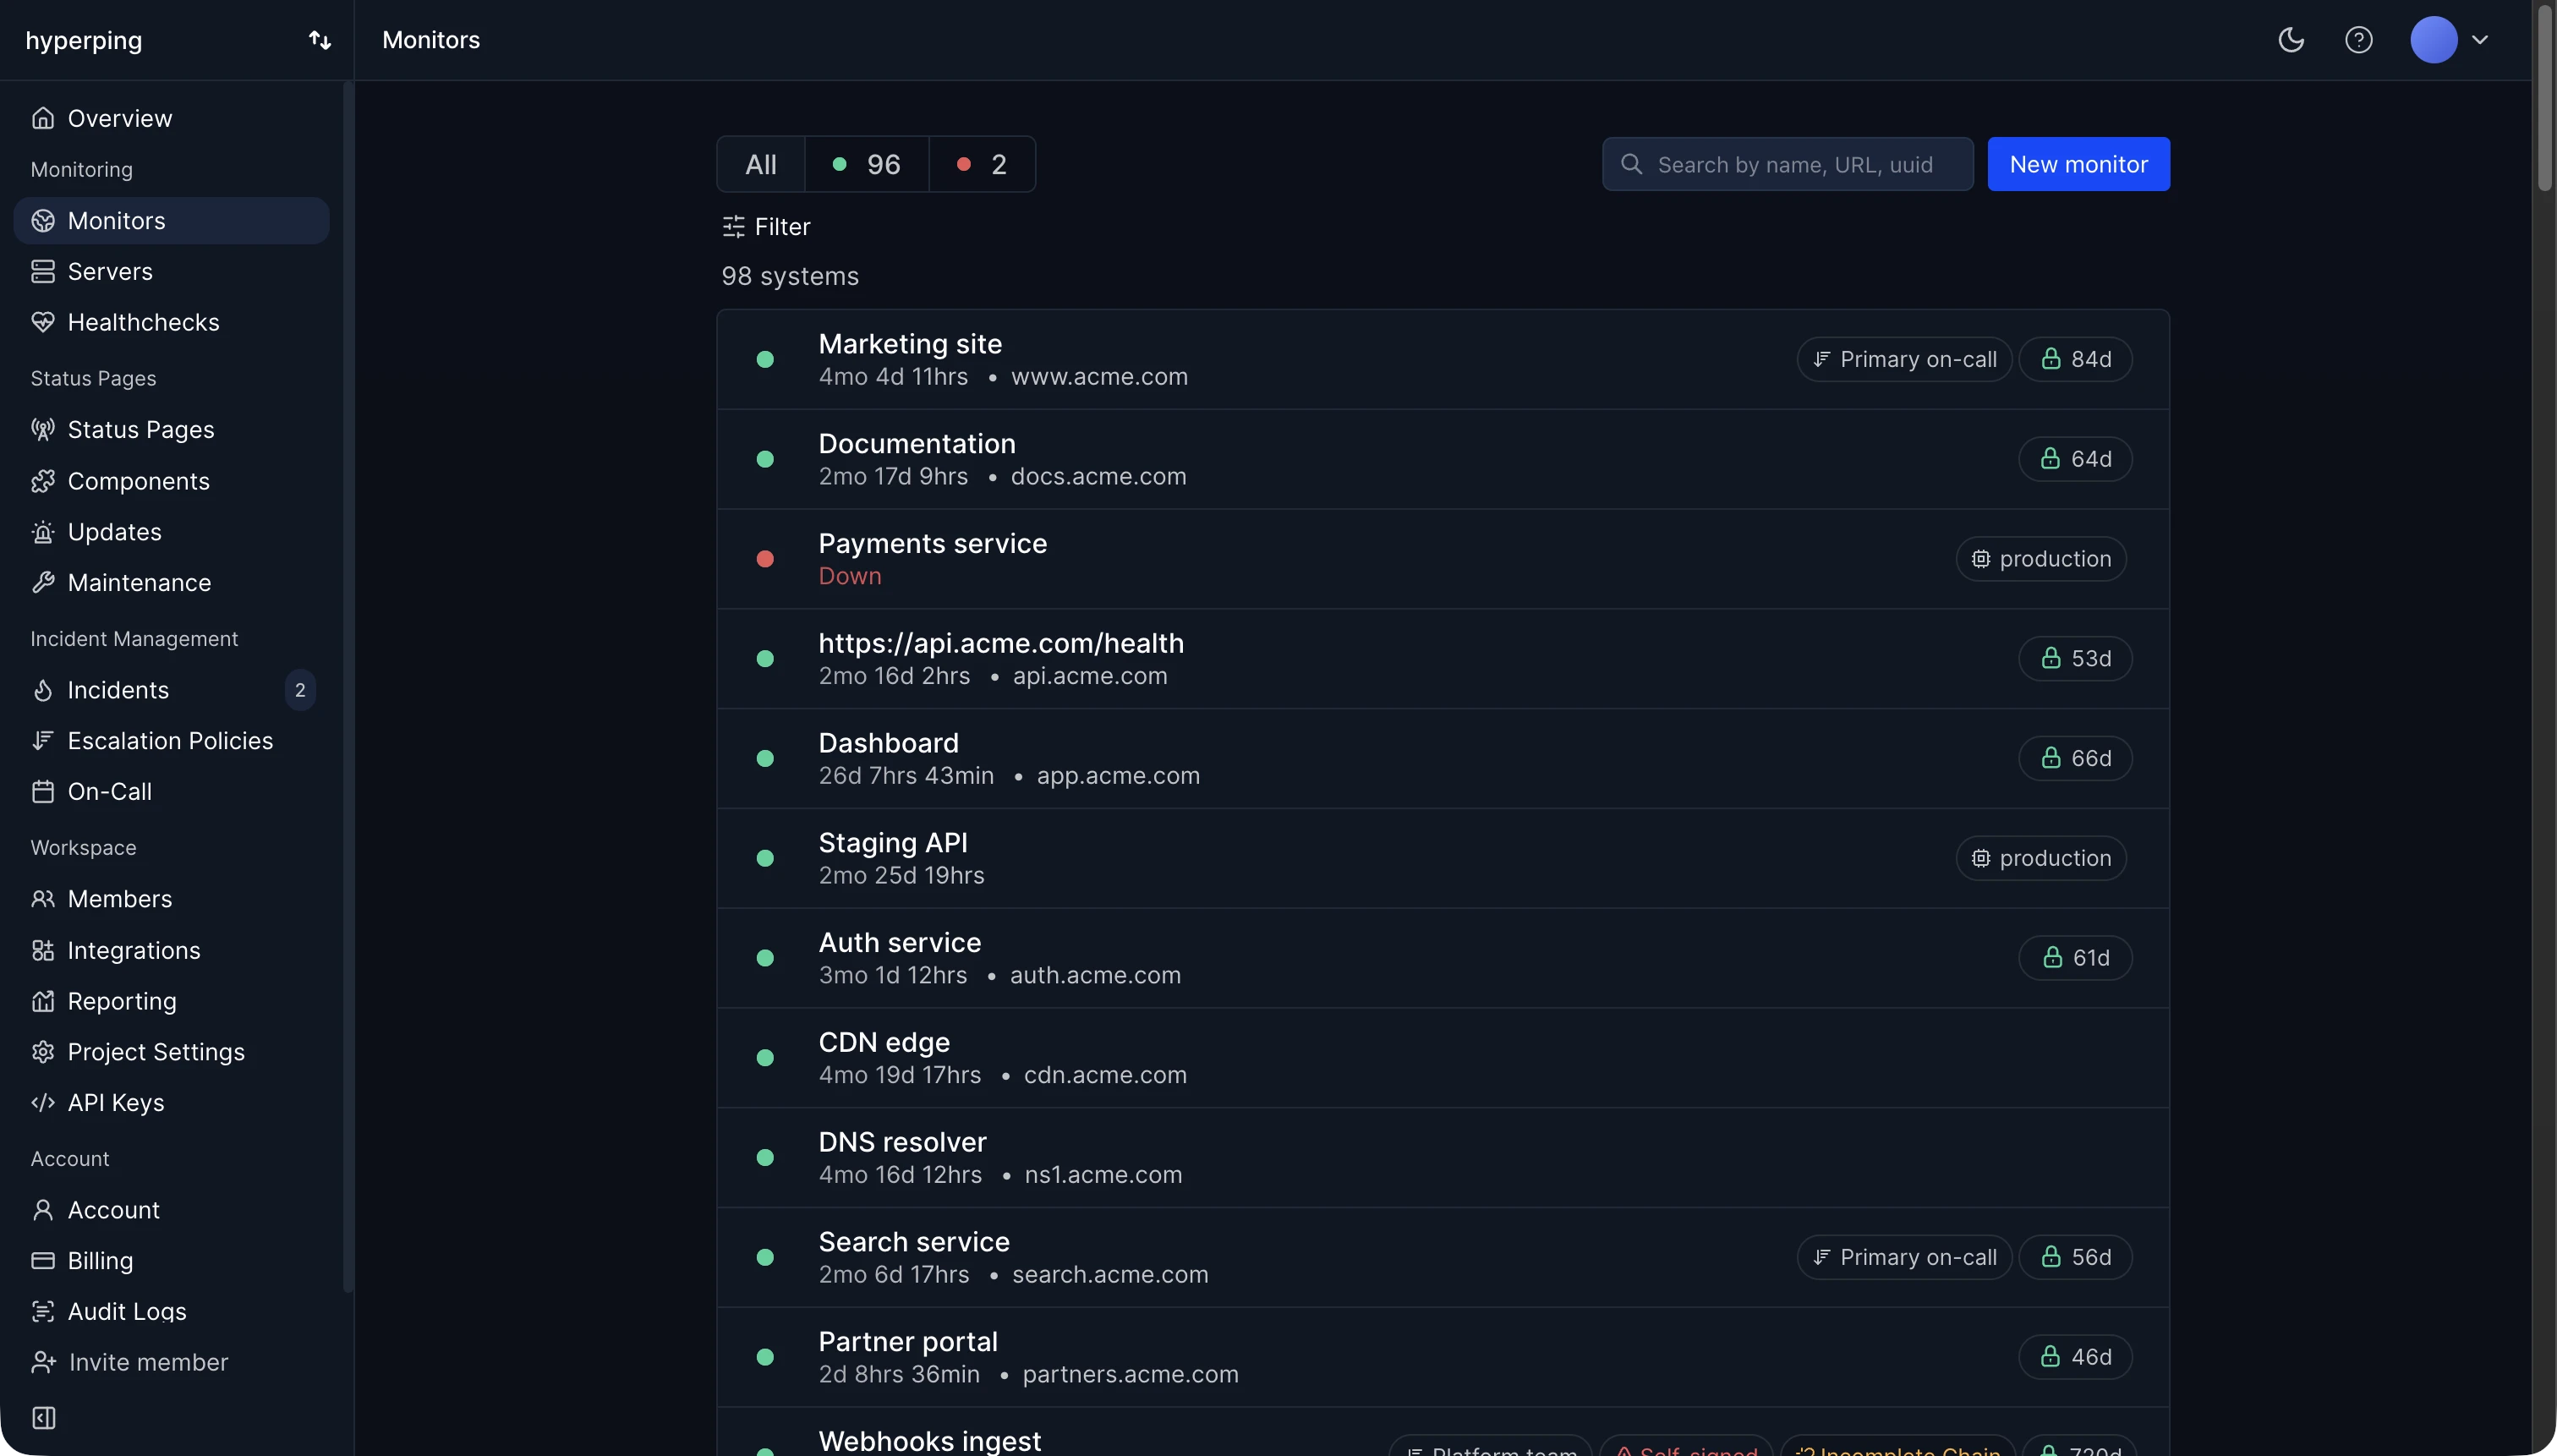
Head to your dashboard and click the New monitor card. Give it a name, enter its URL, and save.
That's enough: your monitor is checked every 30 seconds from multiple regions, and its uptime and response times start filling the graphs immediately. For protocols, regions, intervals and advanced HTTP options, see Create a monitor.
- Choose where alerts go
Down and up alerts go to your signup email by default. Add the channels your team actually watches:
- SMS and phone calls: set your number in your account settings.
- Slack, Teams, Discord: connect a channel at the project level.
- Teammates: invite them so they receive alerts too, with their own preferences.
- Webhooks, PagerDuty, OpsGenie: see all notification channels.
- Watch it live
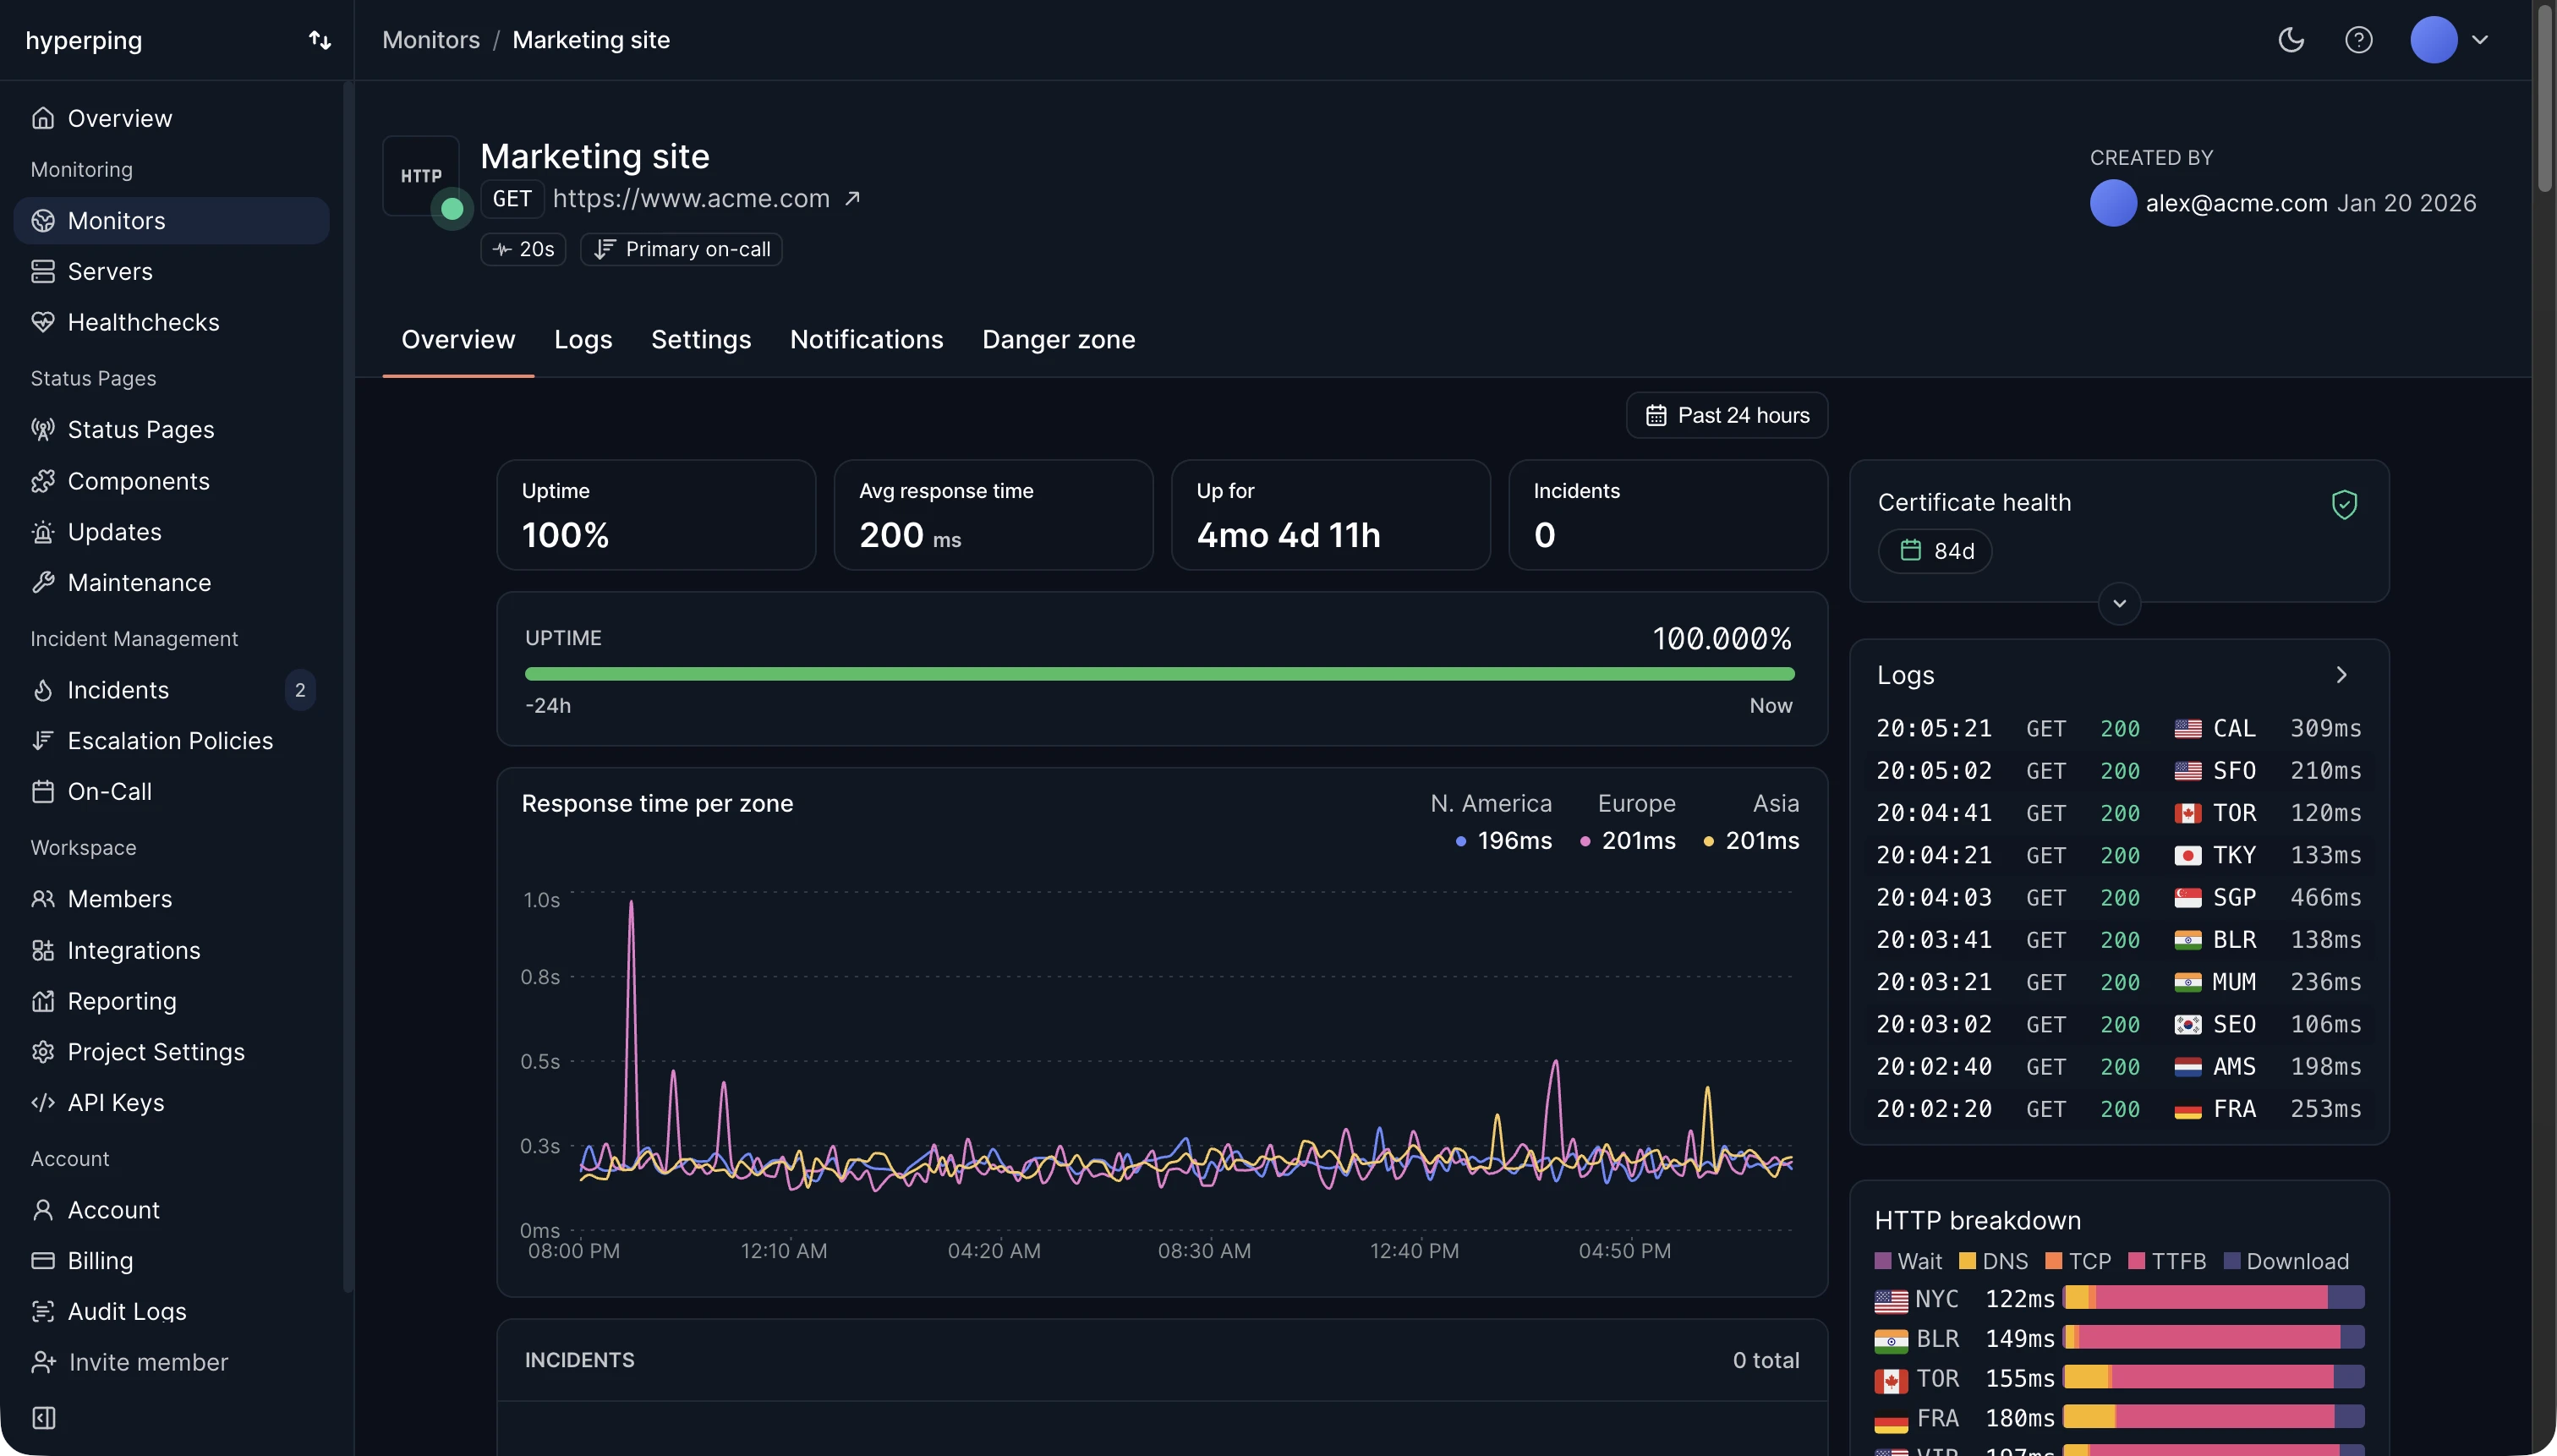
Open your monitor to see uptime, response times per region, and the logs of every check. Your dashboard becomes the single view of everything you run.
Troubleshooting
I didn't receive an alert during a real outage
Check that the monitor is assigned the right escalation policy, and test your notification channels. An easy end-to-end test: create a monitor pointing at a 404 page, which triggers the alerts.
I'm getting alerts for blips that resolve themselves
Select several regions on the monitor so failures are double-checked before alerting, and consider grouped alerts to reduce noise during widespread issues.