Ping (ICMP) and TCP port monitoring
Monitor any host or network service that doesn't speak HTTP, and get alerted the moment it stops responding.
HTTP monitors cover websites and APIs, but plenty of infrastructure never answers an HTTP request: bare servers, databases, mail servers, game servers, VPN endpoints. Ping and port monitors cover these cases. (ICMP itself has no port number; if you are configuring a firewall for it, see why ping has no port and what to open.) A ping (ICMP) monitor tells you whether a host is reachable at all. A port monitor tells you whether a specific service on that host is accepting connections.
Use them when you want to know that:
- A server or network appliance is up and reachable, independently of any web service it runs.
- A database, cache, or mail server is accepting connections on its port.
- A game server or any custom TCP service is listening where clients expect it.
Create a ping (ICMP) monitor
- Open the new monitor form
Go to your dashboard and click the New monitor card.
- Name the monitor
Give it a readable name, for example "DB server" or "Office gateway".
- Select the ICMP protocol
Choose ICMP in the protocol list.
- Enter a hostname or IP address
For example
db.example.comor203.0.113.10. Don't includehttp://orhttps://, those prefixes are for HTTP monitors. - Save
The first check runs immediately and you're redirected to the monitor's detailed view.
ICMP performs a simple echo request, commonly called a ping. The host either returns an echo response, in which case it's considered up, or it doesn't, in which case the check fails. There's nothing else to configure: no status codes, no request bodies.
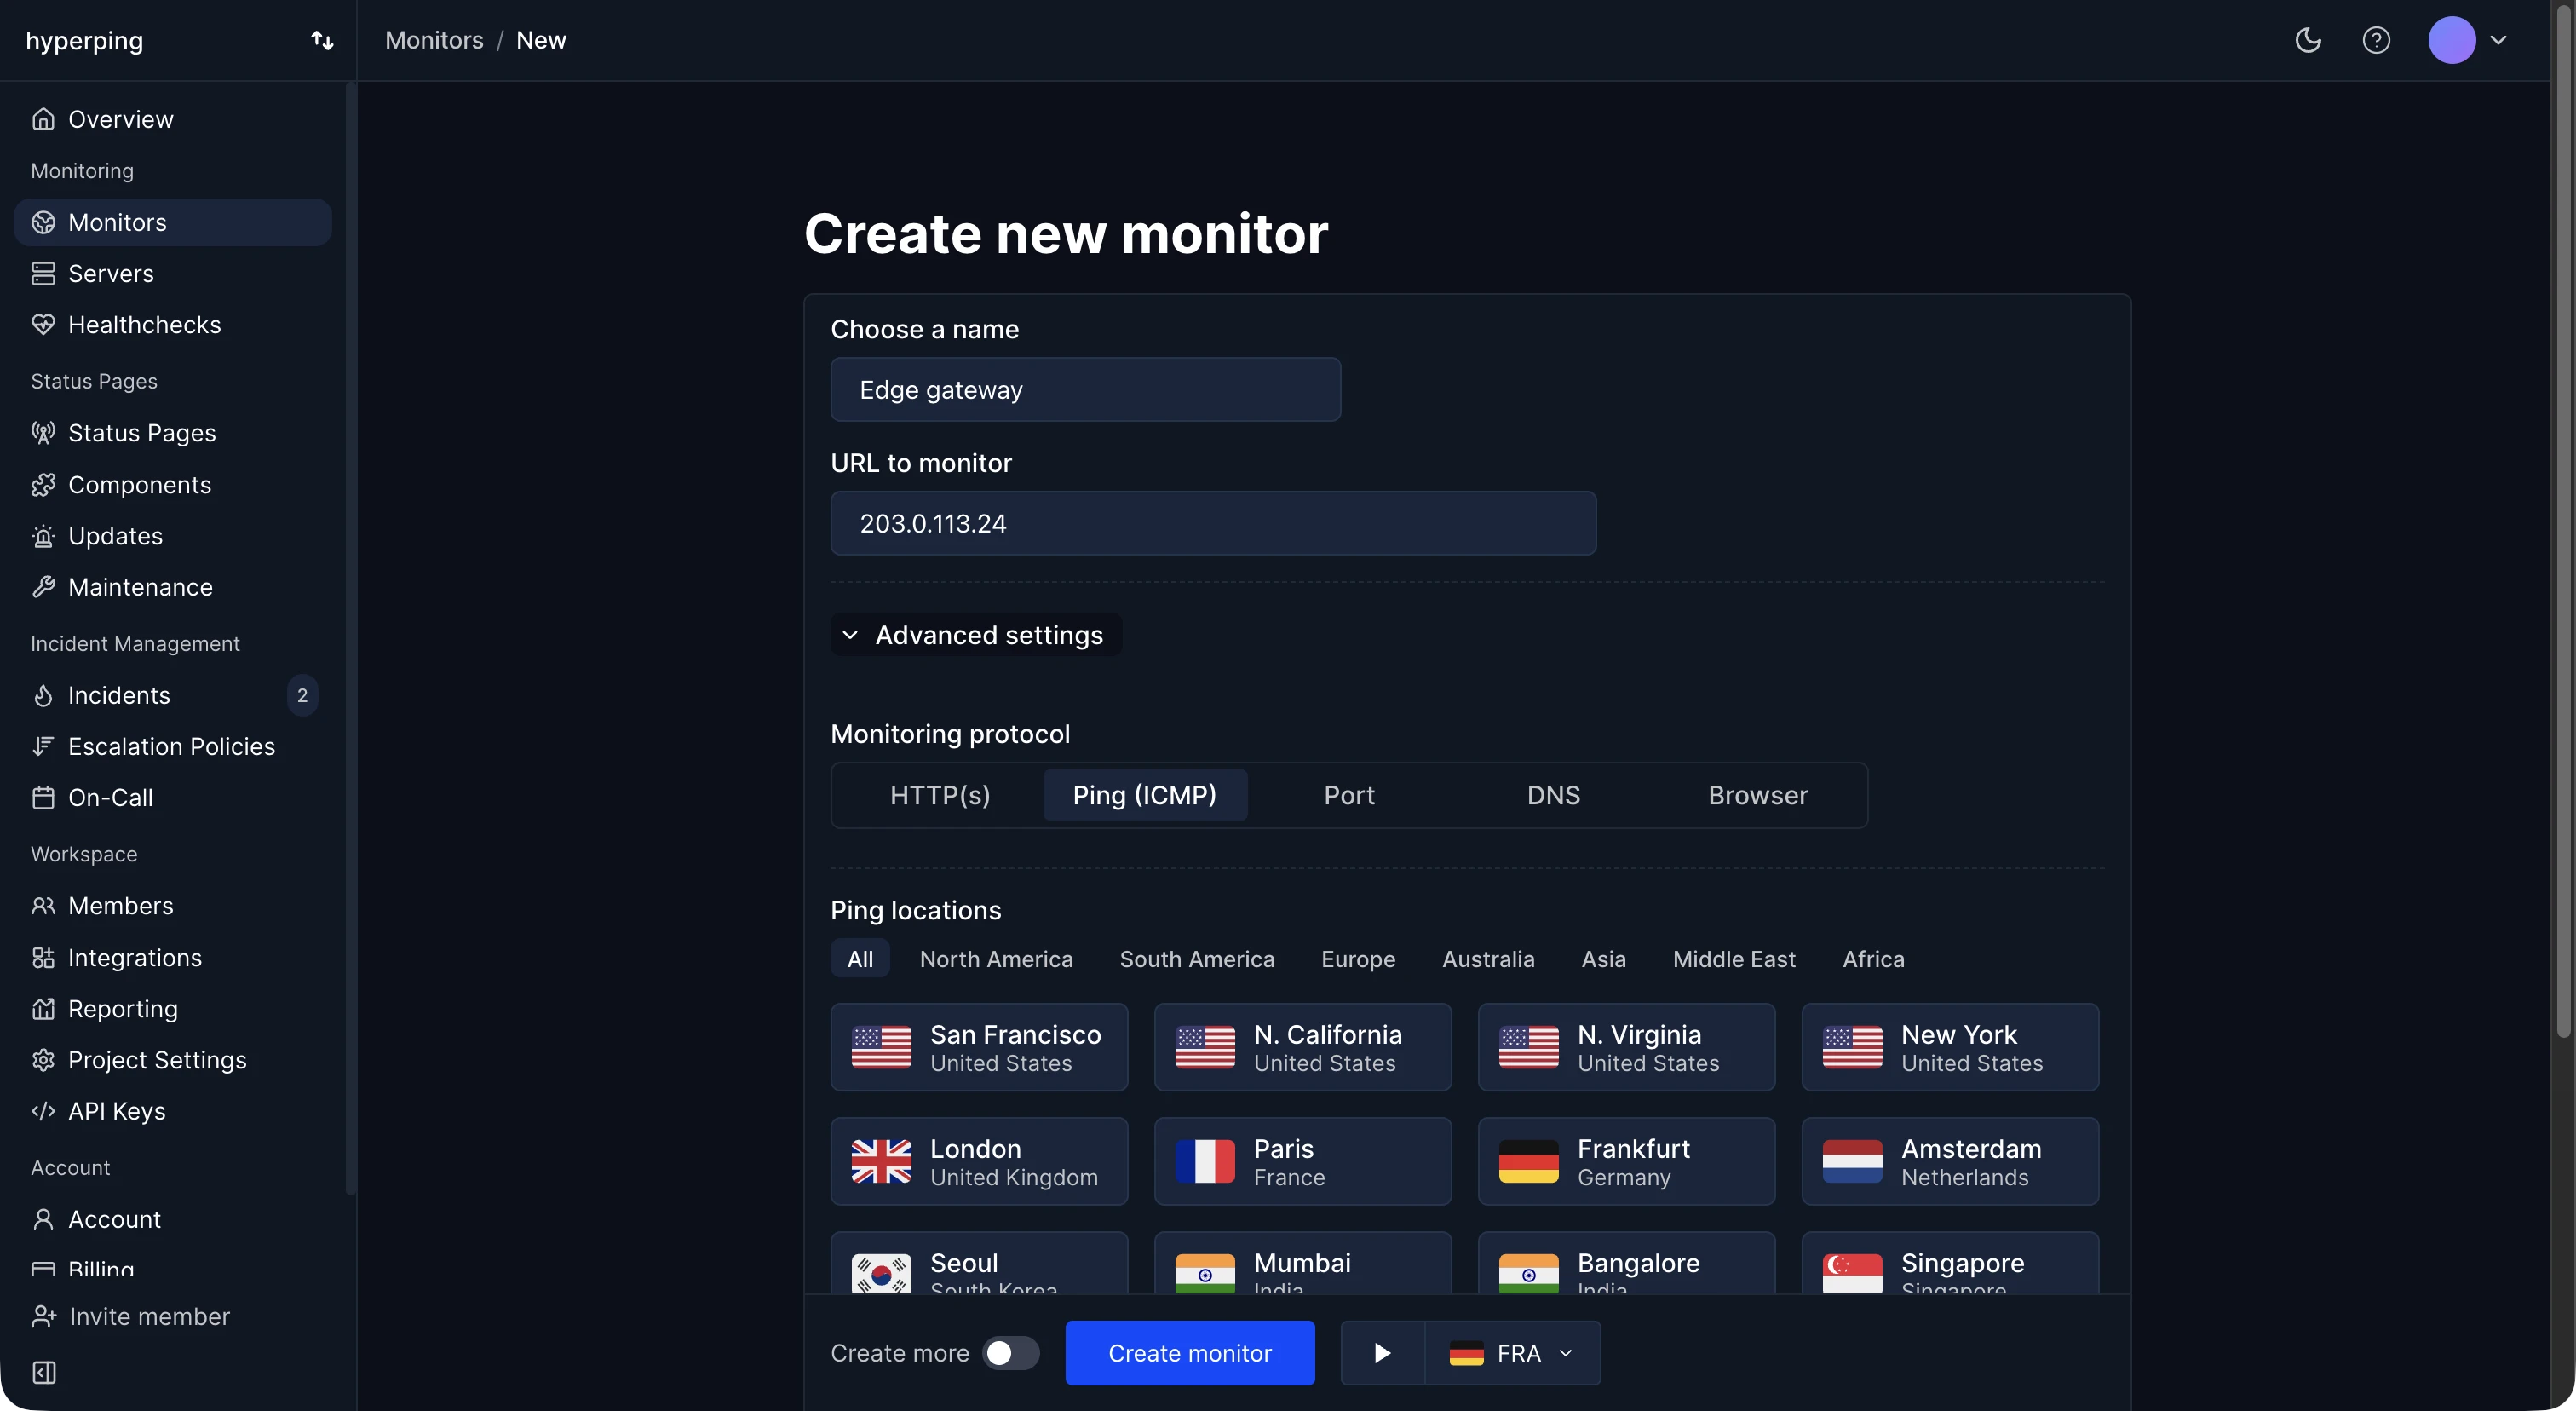
Create a port monitor
- Open the new monitor form
Go to your dashboard and click the New monitor card.
- Select the Port protocol
Choose Port in the protocol list.
- Enter a hostname or IP address
The same way as for ICMP.
- Enter the port number
For example
5432for PostgreSQL. The port is required for this protocol. - Save
Checks start right away.
A port monitor attempts a TCP connection to the given host and port. If the connection is accepted, the service is considered up. If it's refused or times out, the check fails and, once confirmed, alerts go out.
Regions and check intervals
Ping and port monitors use the same regions and scheduling as every other monitor. Checks are performed from one selected region at a time, rotating between them:
- Minute 1: check from Paris: OK
- Minute 2: check from Frankfurt: OK
- Minute 3: check from London: not OK. Hyperping immediately double-checks from the other selected regions. If they all fail too, the downtime is confirmed and alerts are sent.
This double-checking matters for network-level monitors: a single region can lose a route to your host while the rest of the internet reaches it fine. Requiring confirmation from other regions filters out these localized blips.
The default check interval is 30 seconds. Selecting regions close to your infrastructure keeps latency measurements meaningful, since checks from far away include the round trip in their timings.
Ping and port monitors can also run over IPv6: switch IP version to IPv6 in the monitor's advanced settings, or pass "ip_version": 6 through the API. See IP version.
Common examples
| Service | Protocol | Port |
|---|---|---|
| SMTP (mail server) | Port | 25 or 587 |
| PostgreSQL | Port | 5432 |
| Redis | Port | 6379 |
| SSH | Port | 22 |
| Server or gateway reachability | ICMP | n/a |
Only expose and monitor ports that are meant to be reachable from the internet. If your database only listens on a private network, Hyperping's pingers won't be able to reach it, and it's usually better kept that way.
Limitations compared to HTTP monitors
Ping and port monitors check reachability, not correctness. The HTTP advanced settings don't apply here: there's no expected status code and no text body assertion. A port monitor will happily report your database as up as long as something accepts the TCP connection, even if the service behind it is misbehaving.
Two ways to close that gap:
- If the service has any HTTP surface, such as an admin endpoint or a health endpoint, prefer an HTTP monitor with an expected status code or body assertion.
- For correctness checks that only your own code can perform, run a periodic script that queries the service and pings a healthcheck on success. You get alerted when the script stops reporting in.
API and Terraform
Both monitor types are available through the create monitor API. Set protocol to icmp or port, pass the hostname in url, and include the port number when the protocol is port:
curl -X POST https://api.hyperping.io/v1/monitors \
  -H "Authorization: Bearer ${API_TOKEN}" \
  -H "Content-Type: application/json" \
  -d '{
    "name": "PostgreSQL primary",
    "url": "db.example.com",
    "protocol": "port",
    "port": 5432,
    "regions": ["paris", "frankfurt", "london"],
    "check_frequency": 30
  }'
If you manage your monitoring as code, the Terraform provider exposes the same fields on the hyperping_monitor resource.