Service Level Agreements (SLAs), Service Level Objectives (SLOs), and Service Level Indicators (SLIs) form the backbone of reliable service delivery. Understanding how these three elements work together helps you build trust with users, maintain service quality, and create accountability across your organization.
TL;DR
- SLAs, SLOs, and SLIs work together as a three-layer system: SLIs measure actual performance, SLOs set internal targets, and SLAs define customer commitments with penalties.
- 99.9% uptime allows for 8.76 hours of downtime per year, making error budgets crucial for balancing reliability with innovation.
- Teams using well-defined SLOs report 40% faster incident resolution because everyone knows exactly what "good" looks like.
Key differences between SLA, SLO, and SLI
Understanding the distinctions between SLAs, SLOs, and SLIs is crucial because they form a three-layer hierarchy:
- SLIs measure what's actually happening
- SLOs set internal targets to stay safely above customer commitments
- and SLAs define the external promises with consequences.
This nested relationship, SLI → SLO → SLA, creates error budgets that allow teams to balance reliability with innovation.
| Aspect | SLA (Service Level Agreement) | SLO (Service Level Objective) | SLI (Service Level Indicator) |
|---|---|---|---|
| What it is | Legal contract with customers defining guaranteed service levels and penalties for failures | Internal reliability targets set to meet or exceed SLA commitments | Quantitative measurements that track actual service performance |
| Primary audience | Customers, sales teams, legal departments | Engineering teams, SREs, product managers | Monitoring engineers, DevOps teams, support staff |
| Typical example | "99.9% uptime guaranteed monthly or 10% service credit" | "99.95% availability target with 21.6 minutes monthly error budget" | "99.97% actual uptime measured over last 30 days" |
| When it's breached | Financial penalties, legal consequences, customer churn, reputation damage | Triggers error budget policies: freeze deployments, focus on reliability work | Indicates performance issues requiring investigation and potential corrective action |
| How often it changes | Rarely (quarterly or yearly contract reviews) | Regularly (monthly or quarterly based on system evolution) | Continuously (real-time measurements and historical trends) |
| Key benefit | Builds customer trust through transparent commitments and accountability | Guides engineering priorities and balances feature velocity with reliability | Provides objective data for decision-making and incident response |
How they work together in practice
The relationship flows from measurement to target to promise. Your SLIs show current performance (like 99.97% uptime), your SLOs set internal goals (99.95% target), and your SLAs make external commitments (99.9% guarantee). This creates a 0.05% error budget that teams can "spend" on deployments, experiments, and maintenance without risking customer penalties.
Consider an e-commerce platform during Black Friday:
- SLI: 99.2% actual availability during peak traffic
- SLO: 99.5% availability target (breached, error budget exceeded)
- SLA: 99.0% availability guarantee (still met, no customer penalties)
This hierarchy allowed the engineering team to handle unprecedented traffic while maintaining customer commitments, even though internal targets were missed.
Tools like Hyperping make this relationship actionable by providing real-time uptime monitoring, alerts, reports, and status pages.
Service Level Agreements (SLAs)
What is a Service Level Agreement?
A Service Level Agreement (SLA) is a formal, legally binding contract between a service provider and customer that defines the expected level of service quality. It outlines specific performance metrics like uptime guarantees, response times, and the consequences (often financial penalties or service credits) when these standards aren't met.
SLAs serve as the external promise to customers, establishing clear expectations and accountability. They typically include:
- Service scope and availability commitments
- Performance metrics and thresholds
- Remedies and penalties for non-compliance
- Measurement and reporting procedures
Who are SLAs for?
| Primary audience | Role | Focus |
|---|---|---|
| Customers | End users of the service | Understanding guaranteed service levels |
| Sales teams | Revenue and contracts | Competitive differentiation and deals |
| Legal teams | Risk management | Contract terms and liability protection |
| Executive leadership | Business strategy | Customer retention and market positioning |
What are the main challenges with SLAs?
Setting unrealistic targets remains the biggest pitfall. Many organizations promise 99.99% uptime without understanding that this allows only 52 minutes of downtime per year. Common challenges include:
- Misaligned expectations: SLAs that don't reflect actual system capabilities
- Measurement complexity: Difficulty tracking and reporting on promised metrics
- Penalty structures: Balancing meaningful consequences with business sustainability
- Regular updates: Keeping agreements current with evolving infrastructure
Over-promising leads to customer dissatisfaction and potential financial losses when penalties are triggered.
SLA examples across industries
| Industry | Typical SLA commitment | Penalty structure |
|---|---|---|
| Cloud hosting | 99.9% monthly uptime | 10% service credit for each 1% below target |
| SaaS platforms | 99.95% availability + <2s response time | Pro-rated refunds for downtime |
| E-commerce | 99.8% uptime + 24/7 support | Service credits + escalation priority |
| Financial services | 99.99% uptime + <100ms latency | Regulatory compliance + penalties |
How can you create effective SLAs?
Start with your actual performance data, not aspirational targets. Review at least 12 months of historical metrics before committing to any SLA. Key tips:
- Use tiered service levels: Offer different SLA tiers (Basic, Professional, Enterprise) with varying commitments
- Include exclusions: Clearly define what doesn't count (maintenance windows, force majeure, customer-caused issues)
- Make penalties meaningful but fair: Credits should motivate performance without threatening business viability
- Plan for measurement: Ensure you can accurately track and report on every promised metric
Tools like Hyperping's SLA calculator can help you understand the real-world implications of different uptime commitments, showing exactly how much downtime each "nine" allows.
Service Level Objectives (SLOs)
TL;DR
- SLOs are your internal reliability targets that keep you safely above SLA thresholds. They're typically set 0.1-0.5% higher than SLA commitments to create an error budget for innovation and maintenance.
- Teams with clear SLOs deploy 2x more frequently because they know exactly how much risk they can accept without breaking customer promises.
What is a Service Level Objective?
A Service Level Objective (SLO) is a specific, measurable target for service performance that teams use internally to ensure they meet or exceed SLA commitments. SLOs define the reliability goals your engineering teams work toward, creating a buffer between actual performance and external promises.
Unlike SLAs, SLOs are:
- Internal targets, not customer-facing contracts
- More stringent than SLA commitments (e.g., 99.95% SLO for a 99.9% SLA)
- Actionable for engineering teams to prioritize work
- Flexible and can be adjusted based on system capabilities
Who should set and monitor SLOs?
| Team | Responsibility | Focus area |
|---|---|---|
| Site Reliability Engineers (SREs) | Define and monitor SLOs | System reliability and error budgets |
| Product managers | Balance features vs. reliability | User experience and business impact |
| Engineering teams | Implement changes to meet SLOs | Code quality and system architecture |
| Operations teams | Day-to-day monitoring and alerting | Incident response and maintenance |
What challenges do teams face with SLOs?
Choosing the wrong metrics causes the most problems. Teams often focus on easy-to-measure technical metrics instead of user-facing performance indicators. Common pitfalls include:
- Vanity metrics: Tracking server CPU usage instead of user-visible latency
- Too many SLOs: Overwhelming teams with dozens of targets instead of focusing on 3-5 critical ones
- Inconsistent measurement: Using different tools or time windows across teams
- Lack of error budget discipline: Continuing to ship features when SLOs are already being violated
Google's SRE teams typically manage no more than 5 SLOs per service to maintain focus and clarity.
SLO examples for different service types
| Service type | Key SLO | Measurement window | Error budget |
|---|---|---|---|
| Web API | 99.95% availability + 95th percentile latency <200ms | 30-day rolling | 0.05% (21.6 minutes/month) |
| Database | 99.9% successful queries + <50ms read latency | 7-day rolling | 0.1% (10 minutes/week) |
| Status page | 99.99% uptime + <2s page load time | 30-day rolling | 0.01% (4.3 minutes/month) |
| Background jobs | 99.5% successful processing + <1 hour completion | 24-hour rolling | 0.5% (7.2 minutes/day) |
Google has good case studies if you want to read more about it.
How do you implement SLOs effectively?
Start with user journeys, not system metrics. Map out what users actually do with your service, then identify the performance indicators that matter most to their experience:
- Choose 3-5 user-facing metrics: Focus on availability, latency, and error rates that users can feel
- Set realistic targets: Use historical data to establish achievable goals with built-in error budgets
- Implement error budget policies: Define what happens when budgets are consumed (freeze deployments, focus on reliability)
- Monitor burn rate: Alert on how quickly you're consuming error budget, not just when SLOs are breached
- Review regularly: Adjust SLOs quarterly based on system evolution and user feedback
Service Level Indicators (SLIs)
TL;DR
- SLIs are the actual measurements that tell you whether you're meeting your SLOs and SLAs.
- They must be quantifiable, user-focused, and collected consistently to be useful.
- Engineering teams using well-defined SLIs detect service degradation 60% faster than those relying on basic monitoring because they measure what users actually experience.
What is a Service Level Indicator?
A Service Level Indicator (SLI) is a carefully defined quantitative measure of some aspect of service performance. SLIs are the raw data that feed into SLO evaluation. They're the "what" that gets measured against the "how much" defined in your SLOs.
Good SLIs share these characteristics:
- Quantifiable: Expressed as percentages, ratios, or specific values
- User-centric: Reflect what users actually experience
- Consistently measurable: Can be tracked reliably over time
- Actionable: Changes in the SLI indicate specific problems to fix
Who needs to understand SLIs?
| Role | SLI usage | Key concerns |
|---|---|---|
| Monitoring engineers | Define and instrument SLIs | Data accuracy and collection reliability |
| SRE teams | Analyze SLI trends and alerts | Performance degradation and capacity planning |
| DevOps engineers | Use SLIs for deployment decisions | Release safety and rollback triggers |
| Support teams | Reference SLIs during incidents | Customer impact assessment and communication |
What problems do teams encounter with SLIs?
Measuring the wrong things creates false confidence and missed incidents. Teams often choose SLIs that are easy to collect rather than meaningful to users. Critical issues include:
- Server-side bias: Monitoring backend metrics instead of client-side experience
- Synthetic vs. real user data: Relying only on artificial tests that don't reflect actual usage
- Aggregation problems: Using averages that hide outliers and performance issues
- Inconsistent collection: Different measurement methods across services making comparison impossible
SLI examples across common use cases
| Use case | SLI definition | Why it matters |
|---|---|---|
| API availability | (successful requests / total requests) * 100 |
Directly impacts user ability to access service |
| Response latency | 95th percentile of request duration over 5 minutes |
Reflects user-perceived performance |
| Error rate | (5xx responses / total responses) * 100 |
Measures service reliability from user perspective |
| Throughput | successful requests per second |
Indicates system capacity and performance |
| Data freshness | age of most recent data update |
Critical for real-time services and dashboards |
How do you choose and implement good SLIs?
Focus on the Golden Signals: Google's SRE methodology identifies four key areas that cover most service monitoring needs:
- Latency: How long requests take to complete
- Traffic: How much demand is hitting your service
- Errors: What percentage of requests are failing
- Saturation: How "full" your service is (CPU, memory, network)
Implementation best practices:
- Measure from the user's perspective: Collect data where users interact with your service
- Use percentiles over averages: 95th percentile latency is more meaningful than mean latency
- Implement client-side monitoring: Server metrics don't show network issues or client problems
- Set up proper aggregation: Use appropriate time windows for different SLI types
- Validate your measurements: Compare SLI data with actual user reports and support tickets
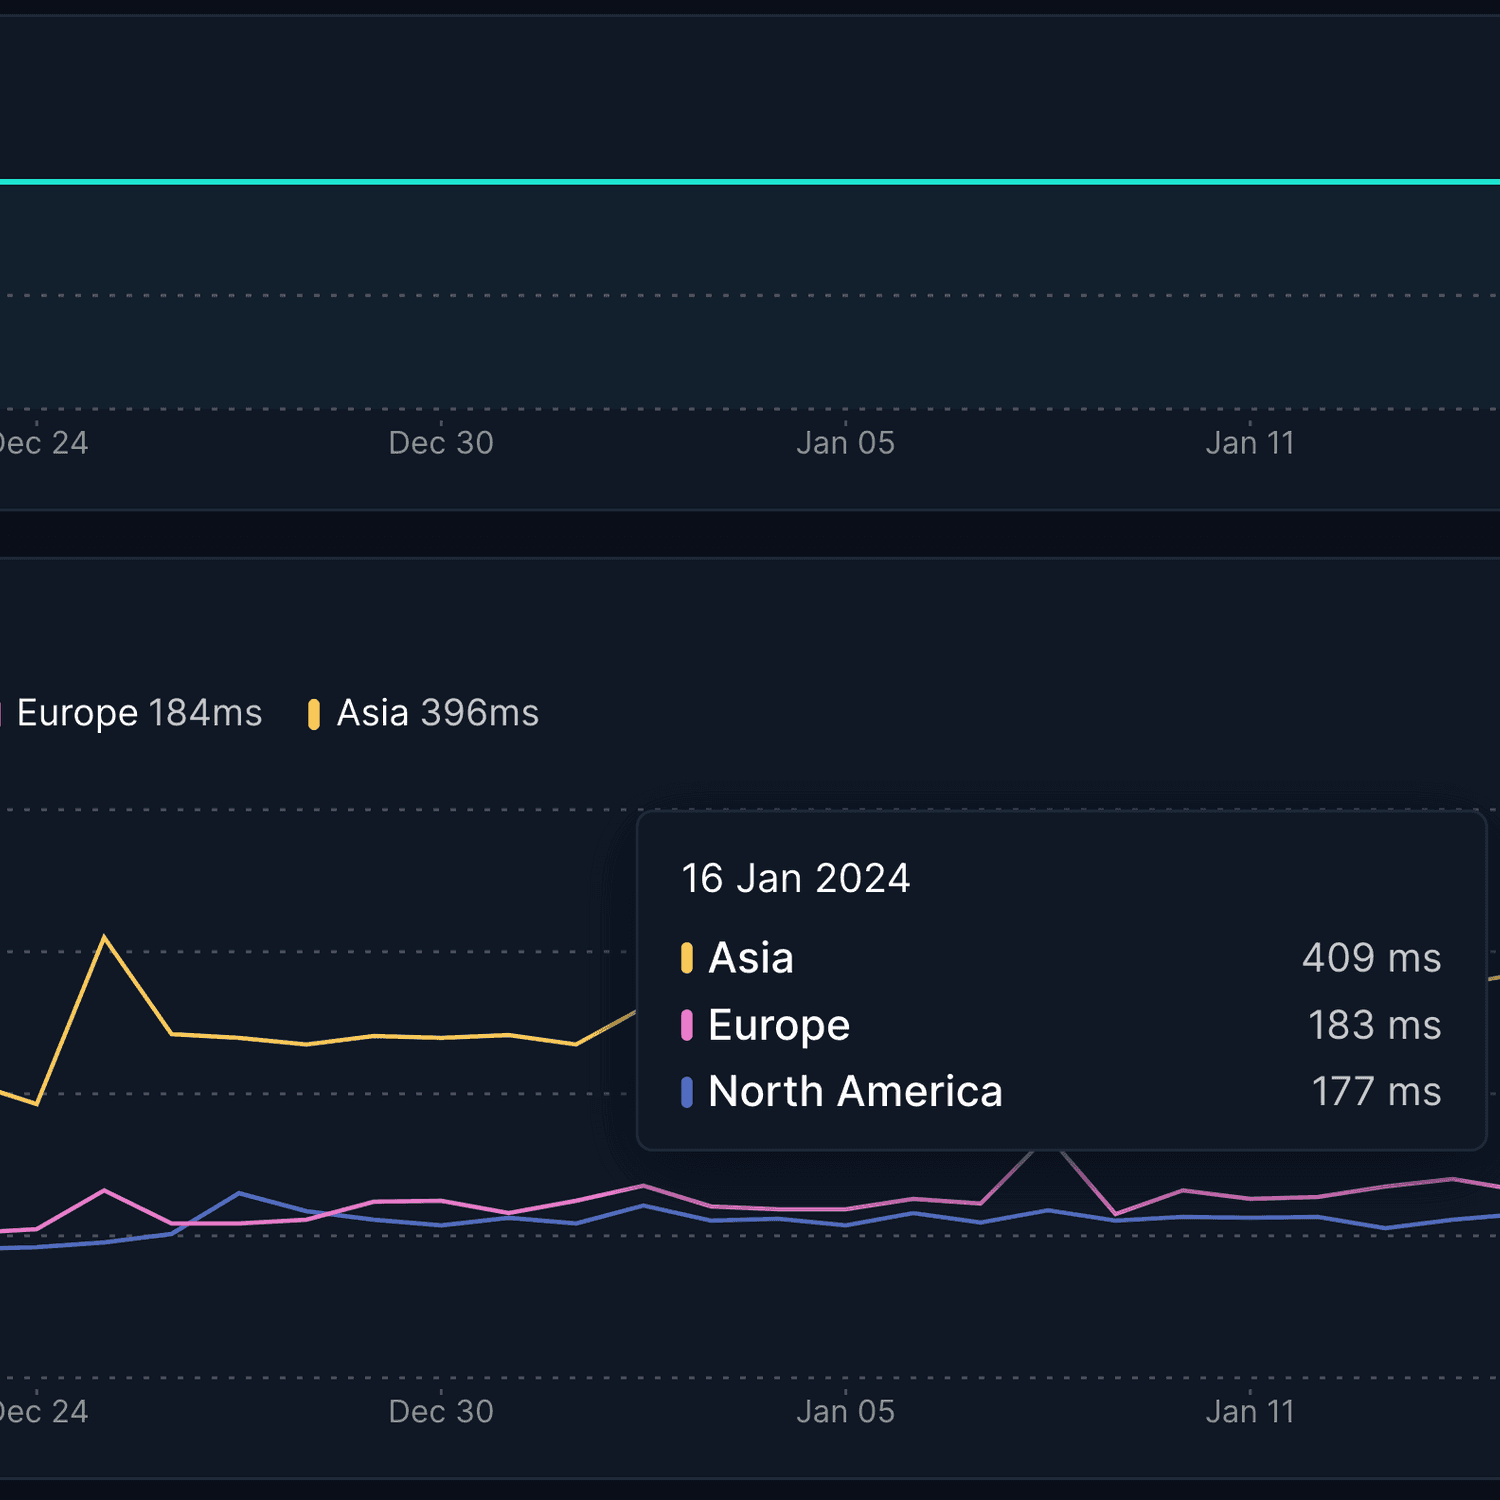
Hyperping excels at providing clear, user-focused SLIs by monitoring your services from external locations worldwide, giving you the same perspective your users have when accessing your applications.
Key terms related to SLA, SLO, and SLI
- Alerting fatigue: When teams receive too many alerts and start ignoring them, often caused by poorly configured SLI thresholds.
- Burn rate: The speed at which an error budget is being consumed, typically measured as a multiplier of the acceptable rate.
- Error budget: The amount of unreliability a service can tolerate before violating its SLO, calculated as
(100% - SLO target). - Error budget policy: A documented plan for what actions teams take when error budgets are exhausted or burning too quickly.
- Golden signals: The four key metrics (latency, traffic, errors, saturation) that Google recommends monitoring for most services.
- Mean Time To Recovery (MTTR): The average time it takes to restore a service after a failure is detected.
- Percentile: A statistical measure showing the value below which a certain percentage of observations fall (e.g., 95th percentile latency).
- Synthetic monitoring: Using artificial transactions to test service performance, as opposed to measuring real user interactions.
- Time to detection: How long it takes to identify that a service is failing or degraded.
- Uptime: The percentage of time a service is available and functioning correctly, typically measured monthly or annually.
Conclusion
Now that you understand how SLAs, SLOs, and SLIs work together, it's time to put this knowledge into action. The most successful teams start small and iterate. Don't try to implement everything at once.
Your next steps:
- Audit your current promises: Review any existing SLAs or uptime commitments you've made to customers. Are they realistic based on your actual performance data?
- Start measuring what matters: Implement 2-3 key SLIs that reflect real user experience, not just server metrics. Focus on availability, latency, and error rates first.
- Set your first SLO: Choose one critical user journey and define a measurable target with a clear error budget. Make it slightly stricter than any customer-facing commitments.
- Establish error budget policies: Decide what happens when your error budget is consumed. Will you freeze deployments, focus on reliability work, or trigger incident reviews?
- Get the right tools: Invest in monitoring that gives you the user perspective. Platforms like Hyperping make it easy to track uptime SLIs and generate SLA reports without complex setup.
Start with one service, prove the value, then expand the approach across your organization. Your future self (and your customers) will thank you for building this foundation now.
Related reading
- SLA calculator — calculate exactly how much downtime your SLA allows
- MTTR guide — measure and reduce your mean time to resolution
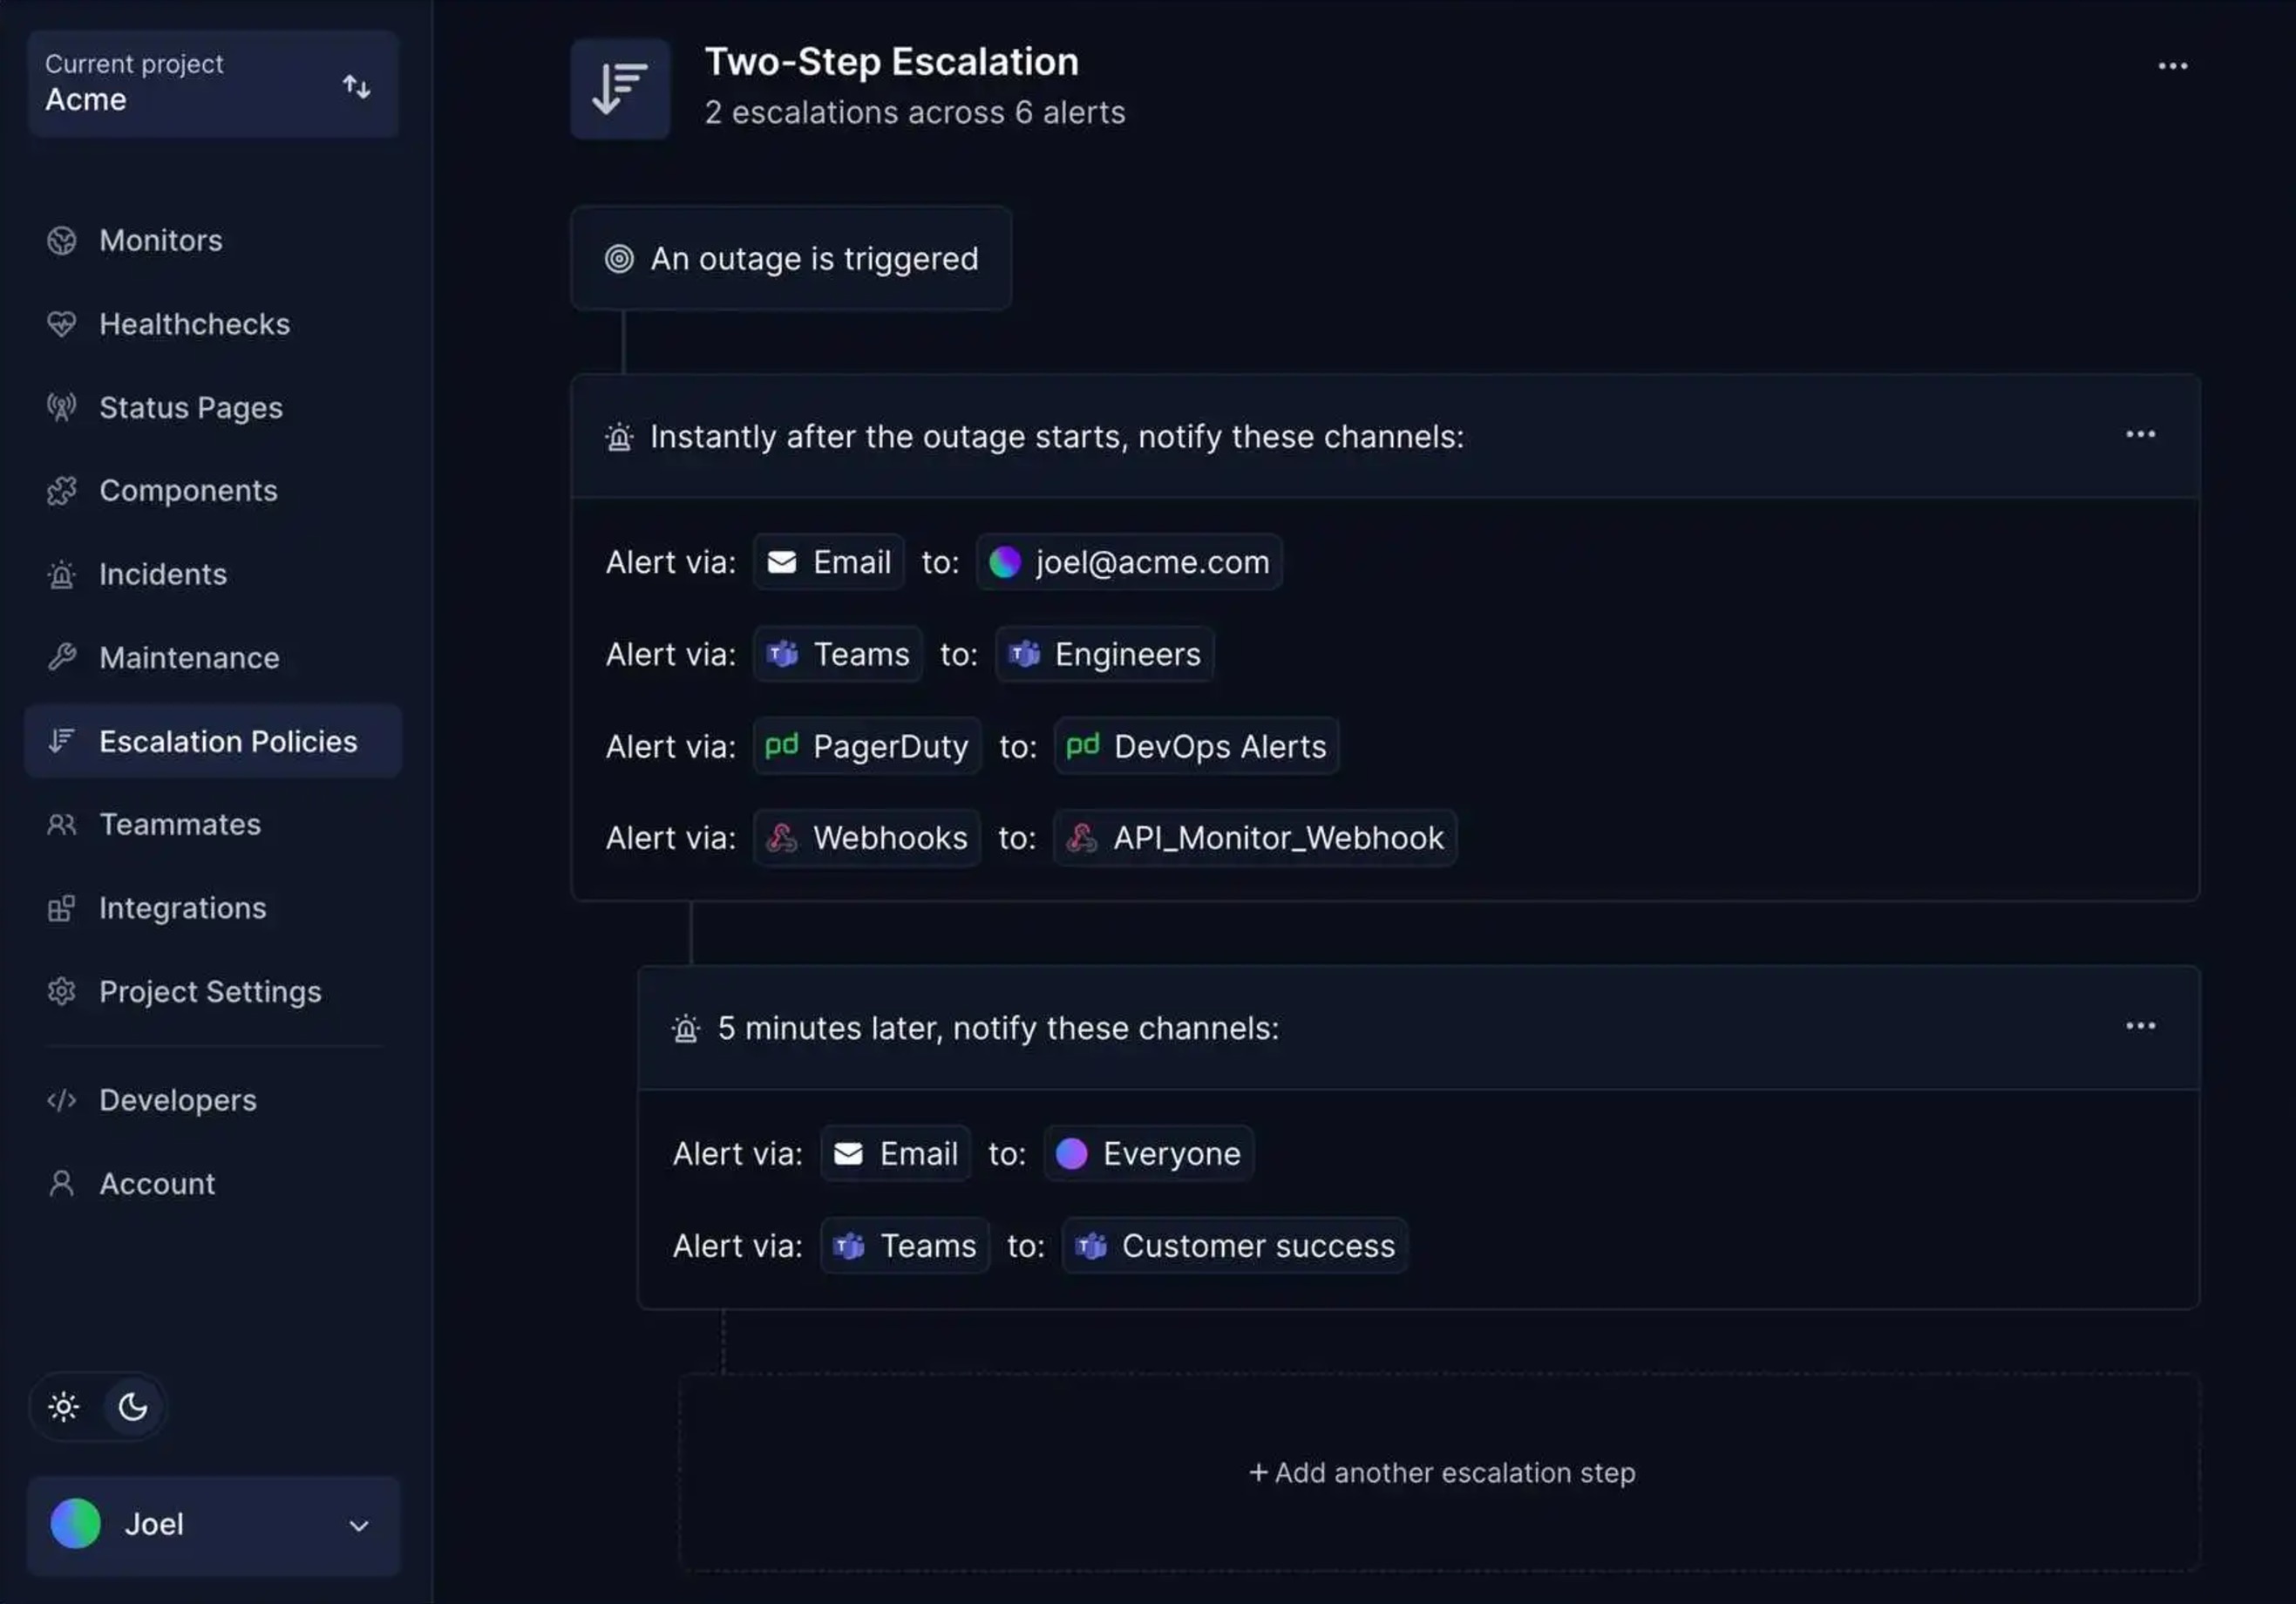
- Escalation policies guide — build a framework for incident routing
- Incident post-mortem guide — learn from incidents to improve SLOs
- Best uptime monitoring software — tools to track your SLIs
- Downtime cost calculator — quantify the business impact of SLA breaches
FAQ
What is the difference between SLA, SLO, and SLI? ▼
SLAs are customer-facing contracts that define guaranteed service levels with penalties for failures. SLOs are internal reliability targets that teams use to stay safely above SLA commitments. SLIs are the actual measurements that track whether you're meeting your SLOs and SLAs. They work together in a hierarchy: SLI → SLO → SLA, where each level builds on the previous one.
What are the main challenges with creating SLAs? ▼
The biggest challenge is setting unrealistic targets. Many organizations promise 99.99% uptime without understanding this allows only 52 minutes of downtime per year. Common issues include misaligned expectations, measurement complexity, balancing meaningful penalties with business sustainability, and keeping agreements current with evolving infrastructure.
How do teams implement SLOs effectively? ▼
Start with user journeys, not system metrics. Choose 3-5 user-facing metrics focused on availability, latency, and error rates. Set realistic targets using historical data with built-in error budgets. Implement error budget policies that define what happens when budgets are consumed, monitor burn rate rather than just SLO breaches, and review SLOs quarterly based on system evolution.
What problems do teams encounter with SLIs? ▼
Measuring the wrong things creates false confidence and missed incidents. Teams often choose SLIs that are easy to collect rather than meaningful to users. Critical issues include server-side bias (monitoring backend metrics instead of client-side experience), relying only on synthetic tests, using averages that hide outliers, and inconsistent measurement methods across services.
How do SLAs, SLOs, and SLIs work together? ▼
The relationship flows from measurement to target to promise. Your SLIs show current performance, your SLOs set internal goals that are typically 0.1-0.5% higher than SLA commitments, and your SLAs make external commitments to customers. This creates an error budget that teams can spend on deployments, experiments, and maintenance without risking customer penalties.
What is an error budget and why does it matter? ▼
Error budget is the amount of unreliability a service can tolerate before violating its SLO, calculated as (100% - SLO target). For example, a 99.9% SLO gives you a 0.1% error budget (43 minutes monthly). Error budgets balance innovation with reliability—when you have budget remaining, you can take risks with new features. When it's exhausted, focus shifts to stability work.
How often should SLAs, SLOs, and SLIs be reviewed? ▼
SLAs change rarely due to legal complexity (quarterly or yearly contract reviews). SLOs should be reviewed quarterly and adjusted based on system evolution, user feedback, and historical performance. SLIs are measured continuously with real-time data and historical trends, providing ongoing feedback for decision-making and incident response.
What are the Golden Signals for monitoring services? ▼
Google's SRE methodology identifies four key Golden Signals that cover most service monitoring needs: Latency (how long requests take to complete), Traffic (how much demand is hitting your service), Errors (what percentage of requests are failing), and Saturation (how 'full' your service is in terms of CPU, memory, network resources).