Log alerts
Open an incident when a search matches too many lines, or when lines stop arriving. Rules are evaluated every minute and reuse the explorer's search syntax.
Overview
Monitors tell you when an endpoint stops answering. Some failures never reach an endpoint: a payment provider rejecting every card, a queue worker throwing on each job, a cron that silently stopped. Your logs see those first. A log alert watches a search over a short window and opens an incident in your project when the count crosses your threshold.
- More than 10 errors from the checkout service in 5 minutes.
- Any
fatalline, anywhere. - No line from the nightly import source for 2 hours.
- A spike of
429responses on your API, counted per service.
Prerequisites
- At least one log source sending lines.
- An owner, admin or member role to create, edit or delete alerts.
Create an alert
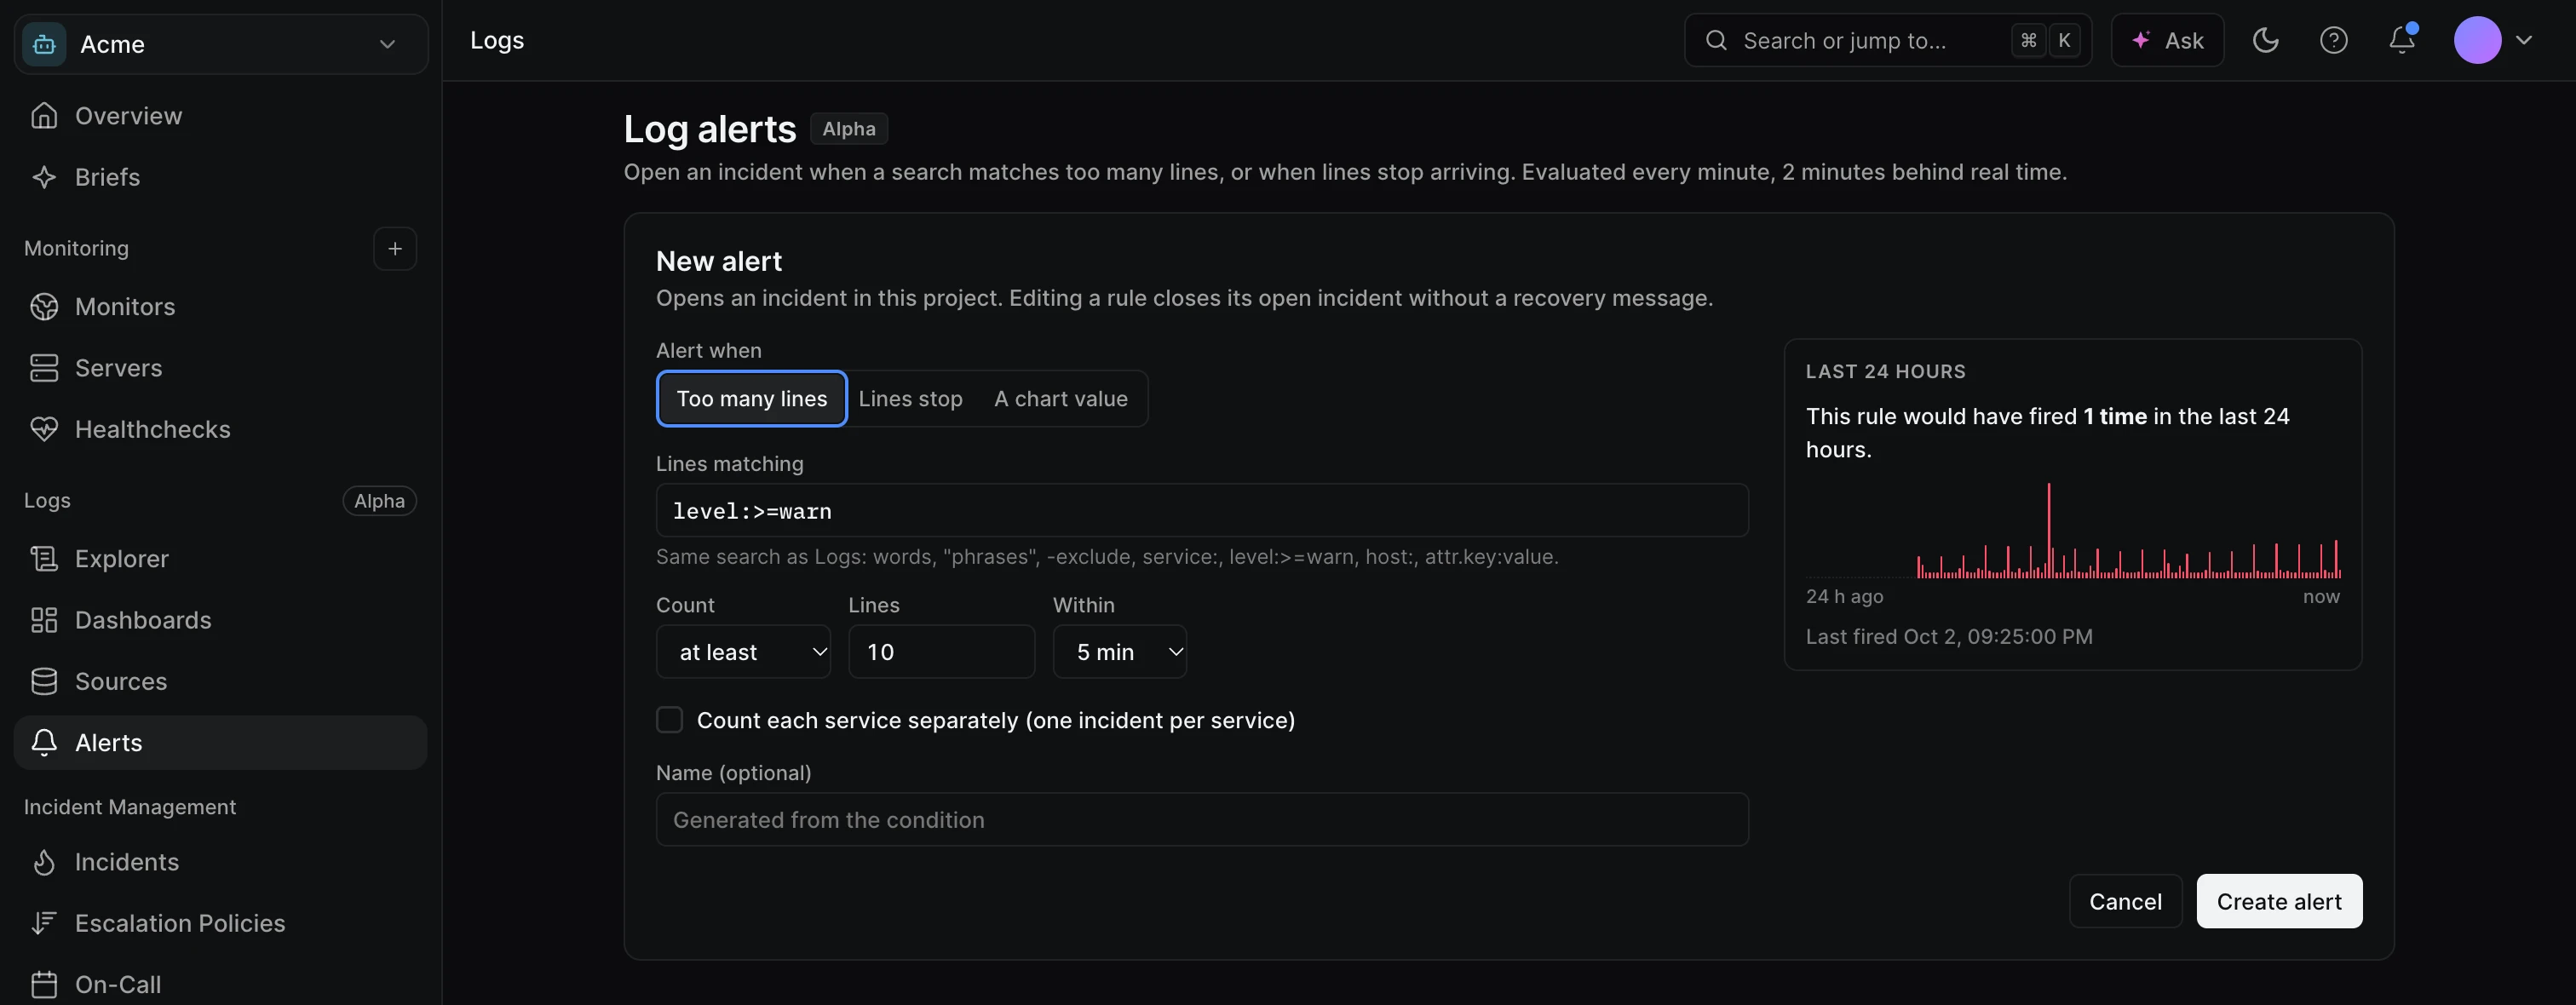
The fastest way is to start from a search: in the explorer, type the search you want to watch and click Alert. The form opens with that search filled in. You can also start from scratch:
Go to LogsAlertsNew alert
- Choose the condition
Under Alert when, pick Too many lines to alert on a volume of matching lines, or Lines stop to alert on silence.
- Write the search
In Lines matching, use the same syntax as the explorer, such as
level:>=error service:checkoutor"payment declined". - Set the threshold and window
For Too many lines, set Count (at least, more than, at most or fewer than), the number of Lines, and the window in Within. For Lines stop, choose a source in From source and how long silence lasts in For.
- Check the preview
The Last 24 hours panel replays the rule over yesterday's lines and tells you how many times it would have fired. If it would have fired more than 24 times, raise the threshold or widen the window.
- Name it and save
Give it a Name, or leave it empty to generate one from the condition. Click Create alert.
Options
| Option | Description | Default |
|---|---|---|
| Lines matching | The search to count. Optional for Lines stop if a source is set. Up to 1,000 characters. | None |
| Count | at least, more than, at most or fewer than the number of lines. | at least |
| Lines | The threshold. | 10 |
| Within / For | The window: 1, 2, 5, 10, 15 or 30 minutes, or 1, 2 or 6 hours. | 5 min |
| From source | For Lines stop: Any source or one source. | Any source |
| Count each service separately | Evaluates the rule per service and opens one incident per service. | Off |
How rules are evaluated
- Every rule runs once a minute, over a window that ends 2 minutes before now. The delay leaves time for late lines to arrive, so counts are complete.
- Lines are counted by the time Hyperping received them.
- When the threshold is crossed, an incident opens right away, titled after the rule and the count, for example Logs: Checkout errors: 14 lines in 5 min.
- The incident resolves on its own after a minute back under the threshold.
- If you resolve the incident by hand, it won't reopen until a new window crosses the threshold again.
- If the log pipeline is late or unreachable, the rule shows Unknown for that minute and nothing opens or resolves. Lines stop rules also wait a few minutes after such a gap, so an outage on Hyperping's side doesn't look like silence on yours.
Alert states
| State | Meaning |
|---|---|
| OK | The last evaluation was under the threshold. |
| Alerting | An incident is open for this rule. |
| Pending | Not evaluated yet. Rules run every minute. |
| Unknown | Not evaluated because the log store was late or unreachable. |
| Paused | Not evaluated until you resume it. |
What the incident contains
Each incident lists the 5 most recent matching lines and a link to the full search. Lines are redacted before they are attached: tokens, Bearer and Basic credentials, JWTs, common API keys (AWS, Stripe, Slack, GitHub), password-like values, emails, card numbers and the last part of IP addresses are masked. The incident's Logs tab shows everything around it.
Manage alerts
The Log alerts page lists every rule with its State, its Last count and when it was Evaluated. Each row has Logs (open the rule's search in the explorer), Edit, Pause or Resume, and delete.
Editing a rule (other than its name), pausing it or deleting it closes its open incident without a recovery message.
Use cases
Error spike on one service. level:>=error service:checkout, at least 10 lines within 5 minutes. Raise the threshold until the preview shows a few firings a day at most.
A job that went quiet. Lines stop on the workers-production source with "job completed", for 1 hour. You hear about a stuck worker before the backlog does.
Errors per service. level:>=error with Count each service separately. One noisy service opens its own incident without hiding the others.
Limits
- 50 alerts per project.
- Windows from 1 minute to 6 hours.
- A threshold of 0 with at least or fewer than is refused: the first is always true, the second never. To alert on any matching line, use at least 1.