Logs
Send your application and platform logs to Hyperping, search them in the same place as your monitors, and open an incident when errors pile up or lines stop arriving.
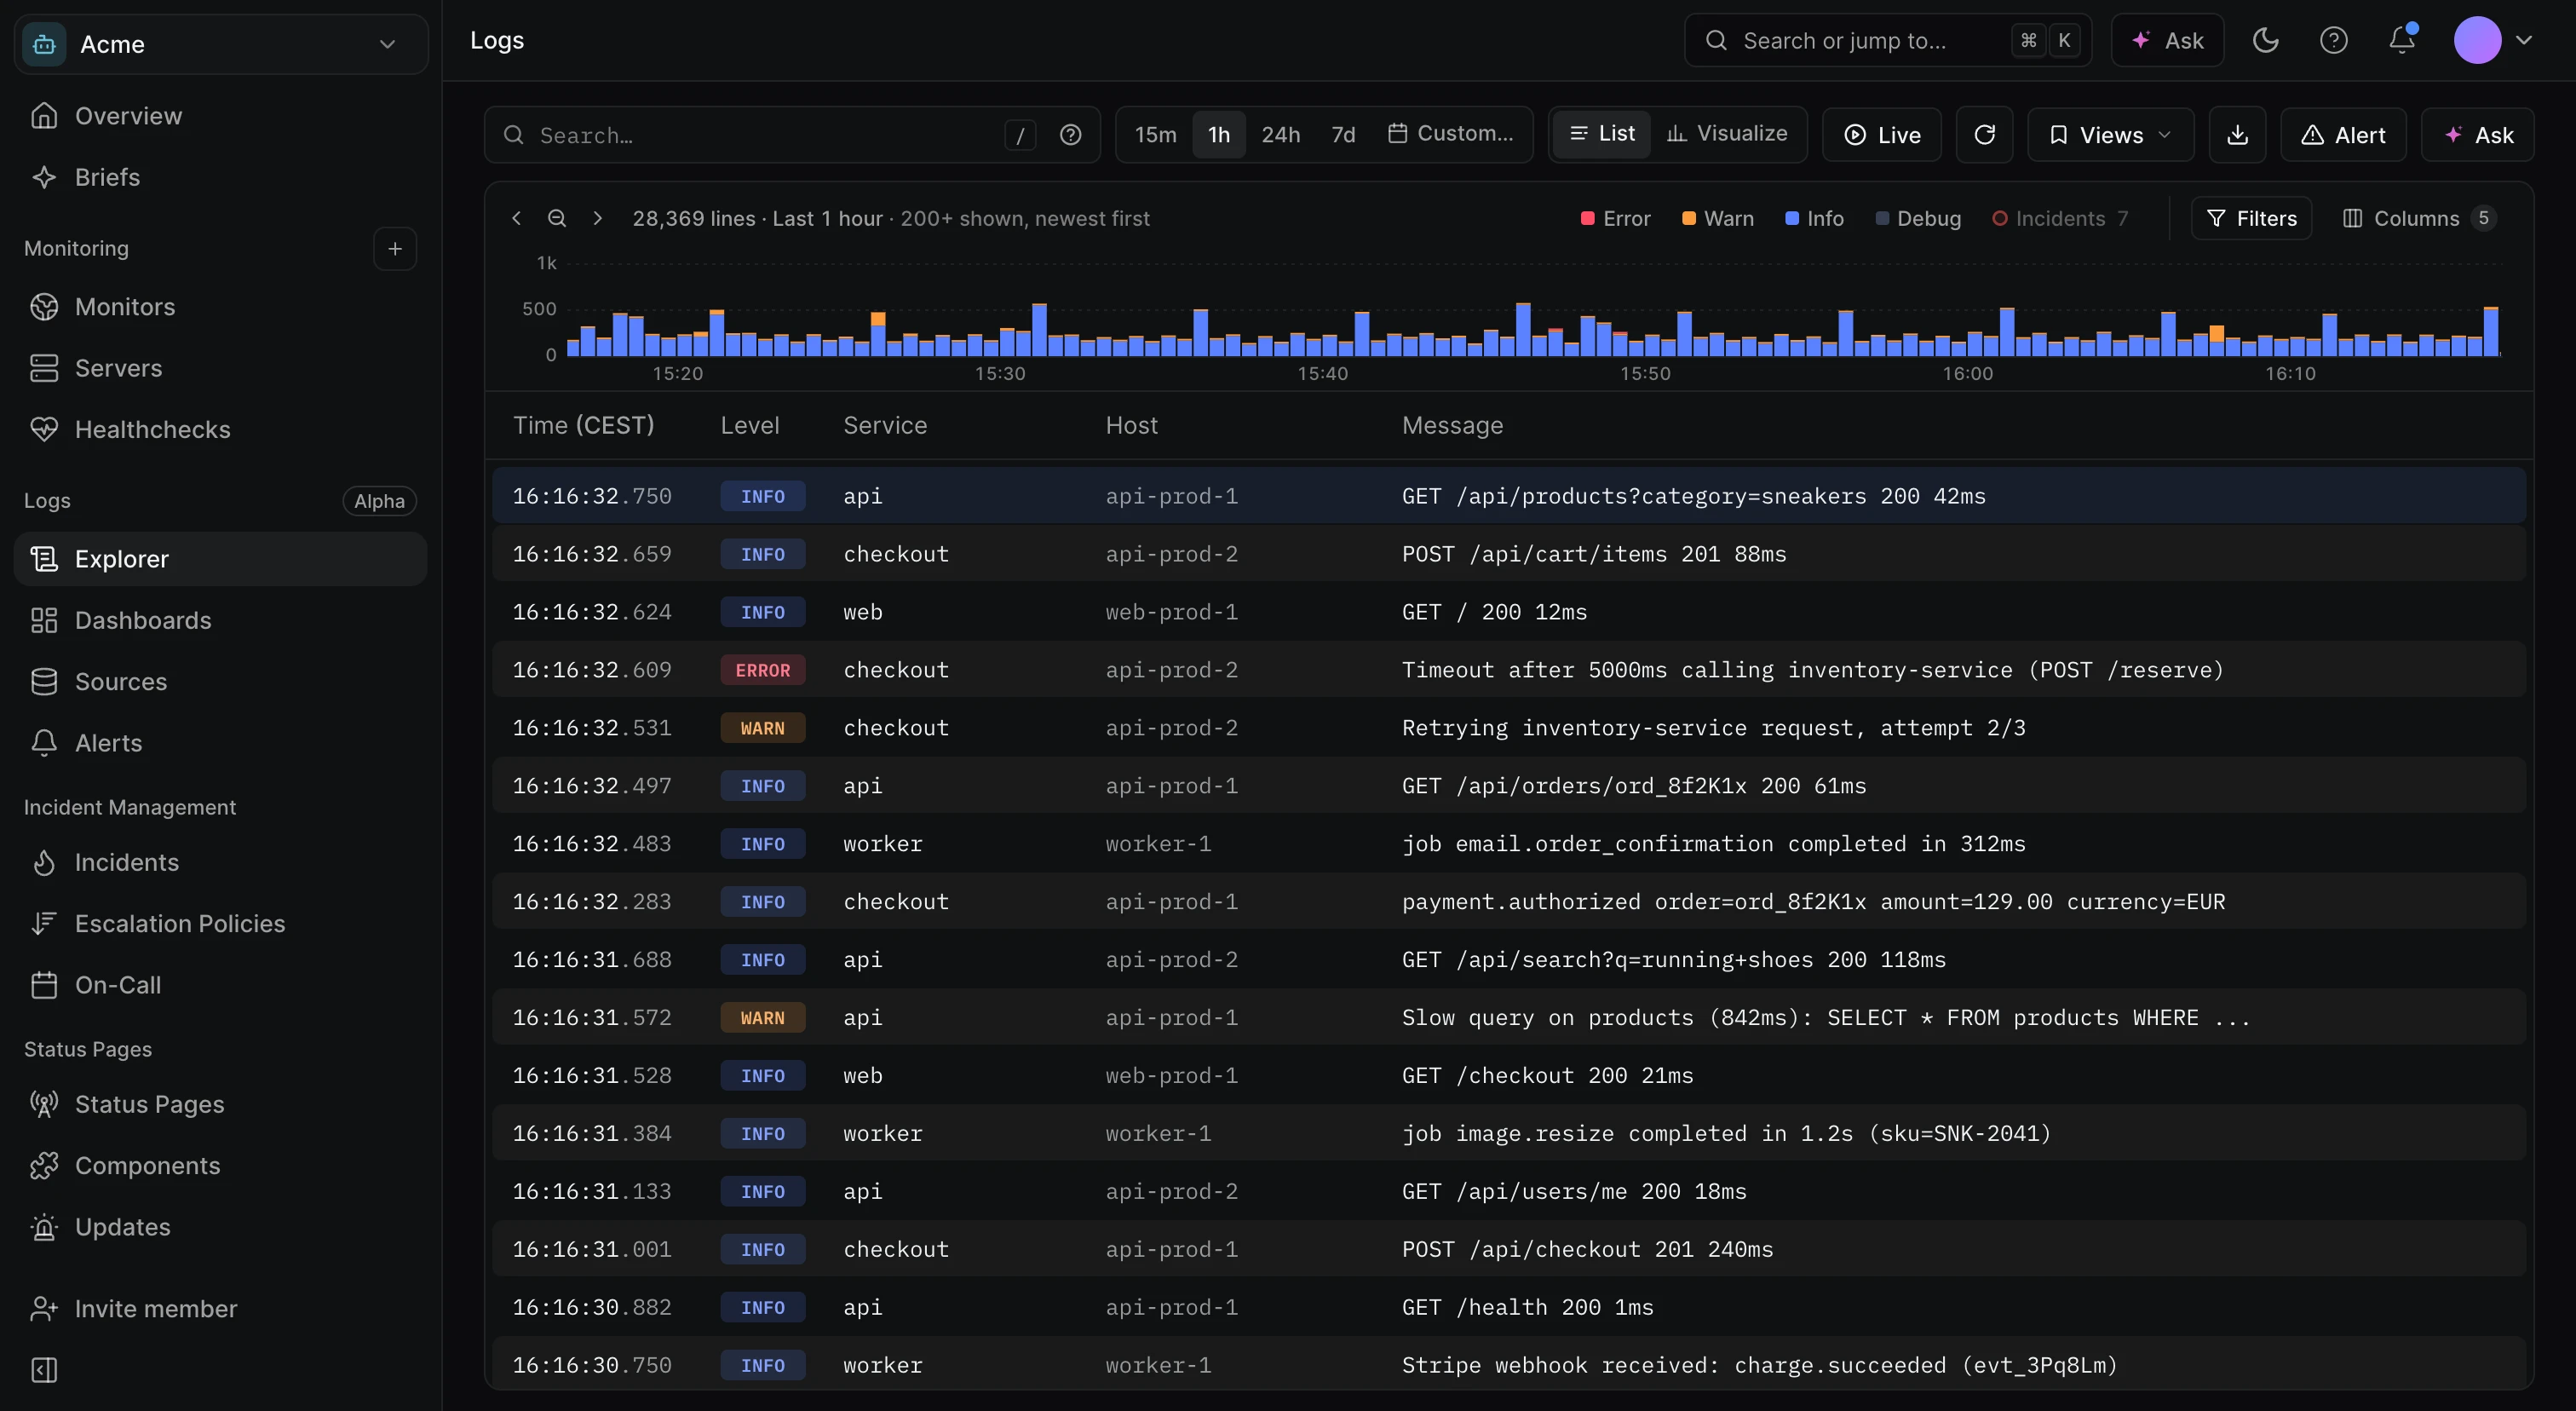
Overview
When a monitor goes down, the next question is what your application was doing at that moment. With Logs, the answer sits next to the incident: every incident page has a Logs tab showing the lines from 15 minutes before it started to 5 minutes after, so you don't have to switch to another tool and line up timestamps by hand.
Logs come in through sources. Each source has its own token and retention, and can be an OpenTelemetry SDK or collector, a plain HTTP JSON call, syslog over TLS, or a platform drain such as Vercel, Heroku or AWS CloudWatch.
- A monitor alerted and you want the errors your API logged at the same minute.
- You run on Vercel, Render or Fly.io and want function and request logs without another subscription.
- You want to be told when your workers log more than a handful of errors in five minutes.
- A nightly job should log a line every hour, and silence means it is stuck.
Availability
Logs is in Alpha on paid plans. The Logs section of the sidebar carries an Alpha badge while the product is in this phase, and features may still change.
- Logs is not available yet for accounts restricted to EU data residency.
- Owners, admins and members can create sources and alerts. Viewers and billing members can search.
- Lines are kept 3, 7, 14 or 30 days, chosen per source.
The Usage page shows the volume each source ingested this month.
Key terms used in this article
- Source: a named entry point for logs with its own token, retention and ingestion stats.
- Source token: the secret that authenticates the lines a source sends. It starts with
hpl_and is shown only once. - Live tail: a mode of the explorer that shows new lines as they arrive.
- Log alert: a rule evaluated every minute that opens an incident when a search matches too many lines, or when lines stop.
Send your first logs
Go to LogsSources to start.
- Create a source
Click New source, pick HTTP JSON under Other (or the platform you run on), give it a name such as
api-production, then click Create source. - Copy the token
Click Copy token. The token is shown only once, right after creation: Hyperping only stores its fingerprint.
- Send a line
Run the command shown under Send your first lines, or this one with your token:
curl -X POST https://logs.hyperping.com/ \
  -H "Authorization: Bearer $HYPERPING_LOGS_TOKEN" \
  -H "Content-Type: application/json" \
  -d '{"message":"Hello from curl","level":"info","service":"my-app"}'
The endpoint answers
202once the line is stored. The panel switches to First line received within a few seconds. - Search it
Click Open live tail or Search this source, then wire your application with one of the source types.
Where logs show up
- Explorer (
/logs): search, filter, live tail, saved views and export. See Search and explore logs. - Incidents: the Logs tab of an incident, scoped to Matched by the alert, Warnings and errors or Every line.
- Alerts (
/logs/rules): rules that open incidents from your logs. See Log alerts. - Ask Hyperping and the MCP server: AI assistants can search your logs and group recent errors by pattern with the
search_logs,summarize_log_errorsandget_outage_logstools.