Log sources
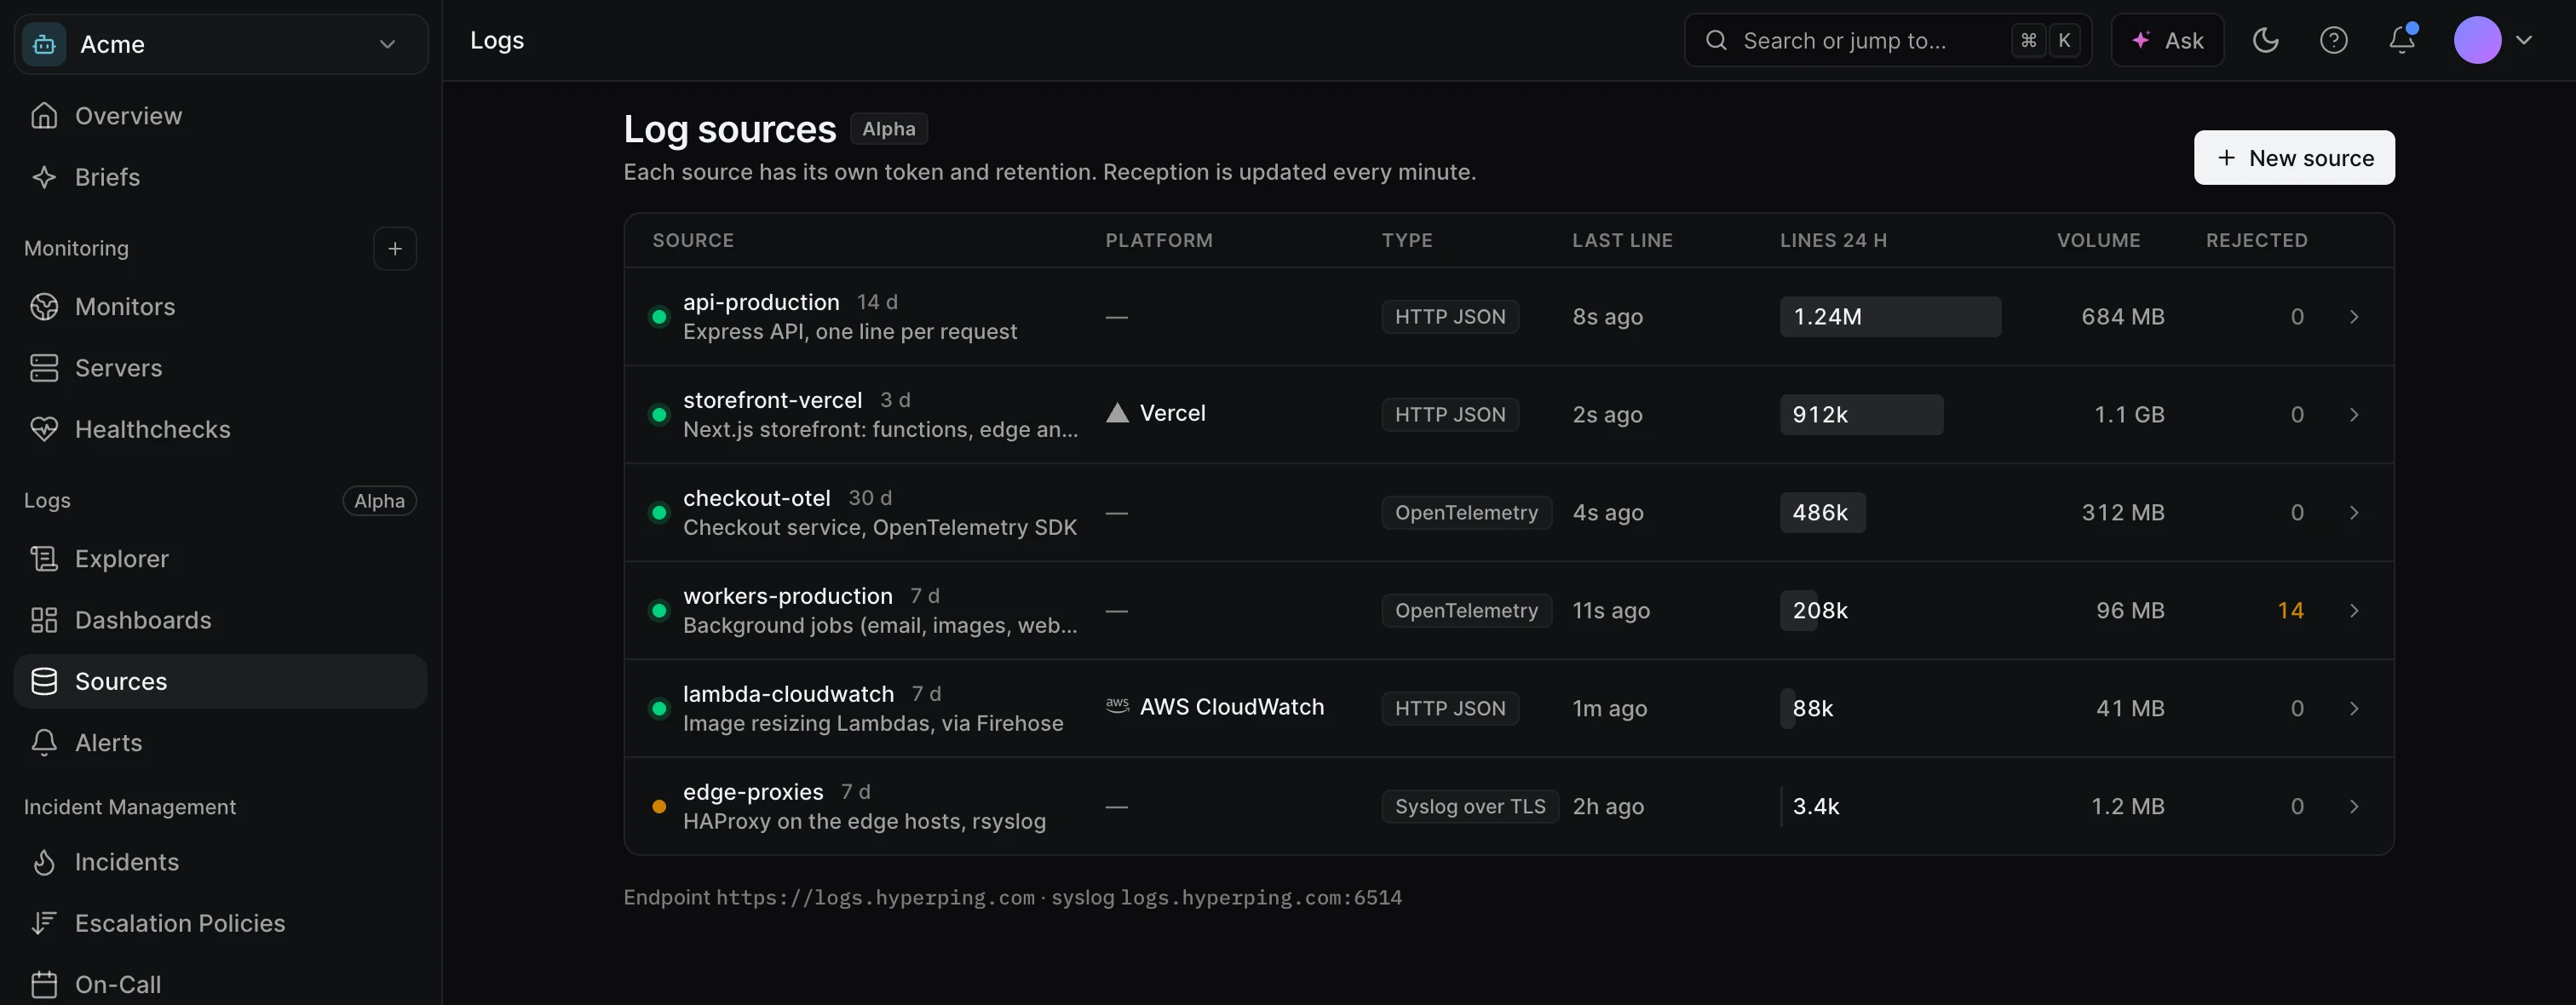
Connect the places your logs come from. Each source has its own token, its own retention and its own reception stats, so you can tell at a glance which service stopped sending.
Overview
A source is a token plus a retention. Anything that holds the token can send lines to Hyperping: an OpenTelemetry SDK or collector, an HTTP client, rsyslog, or a hosting platform's log drain. Create one source per service and environment, such as api-production and api-staging, so you can revoke, filter and size them separately.
- Your app already uses OpenTelemetry and you want its logs next to your monitors.
- You deploy on Vercel, Heroku, Render, Fly.io, Railway, Cloudflare Workers, Supabase or Netlify and want the platform to push its logs.
- Your Lambdas and ECS tasks log to CloudWatch.
- Your servers already run rsyslog or Vector.
Prerequisites
- A paid plan. Logs is in Alpha on paid plans and not yet available for EU-only accounts. See Logs.
- An owner, admin or member role to create or revoke sources.
Create a source
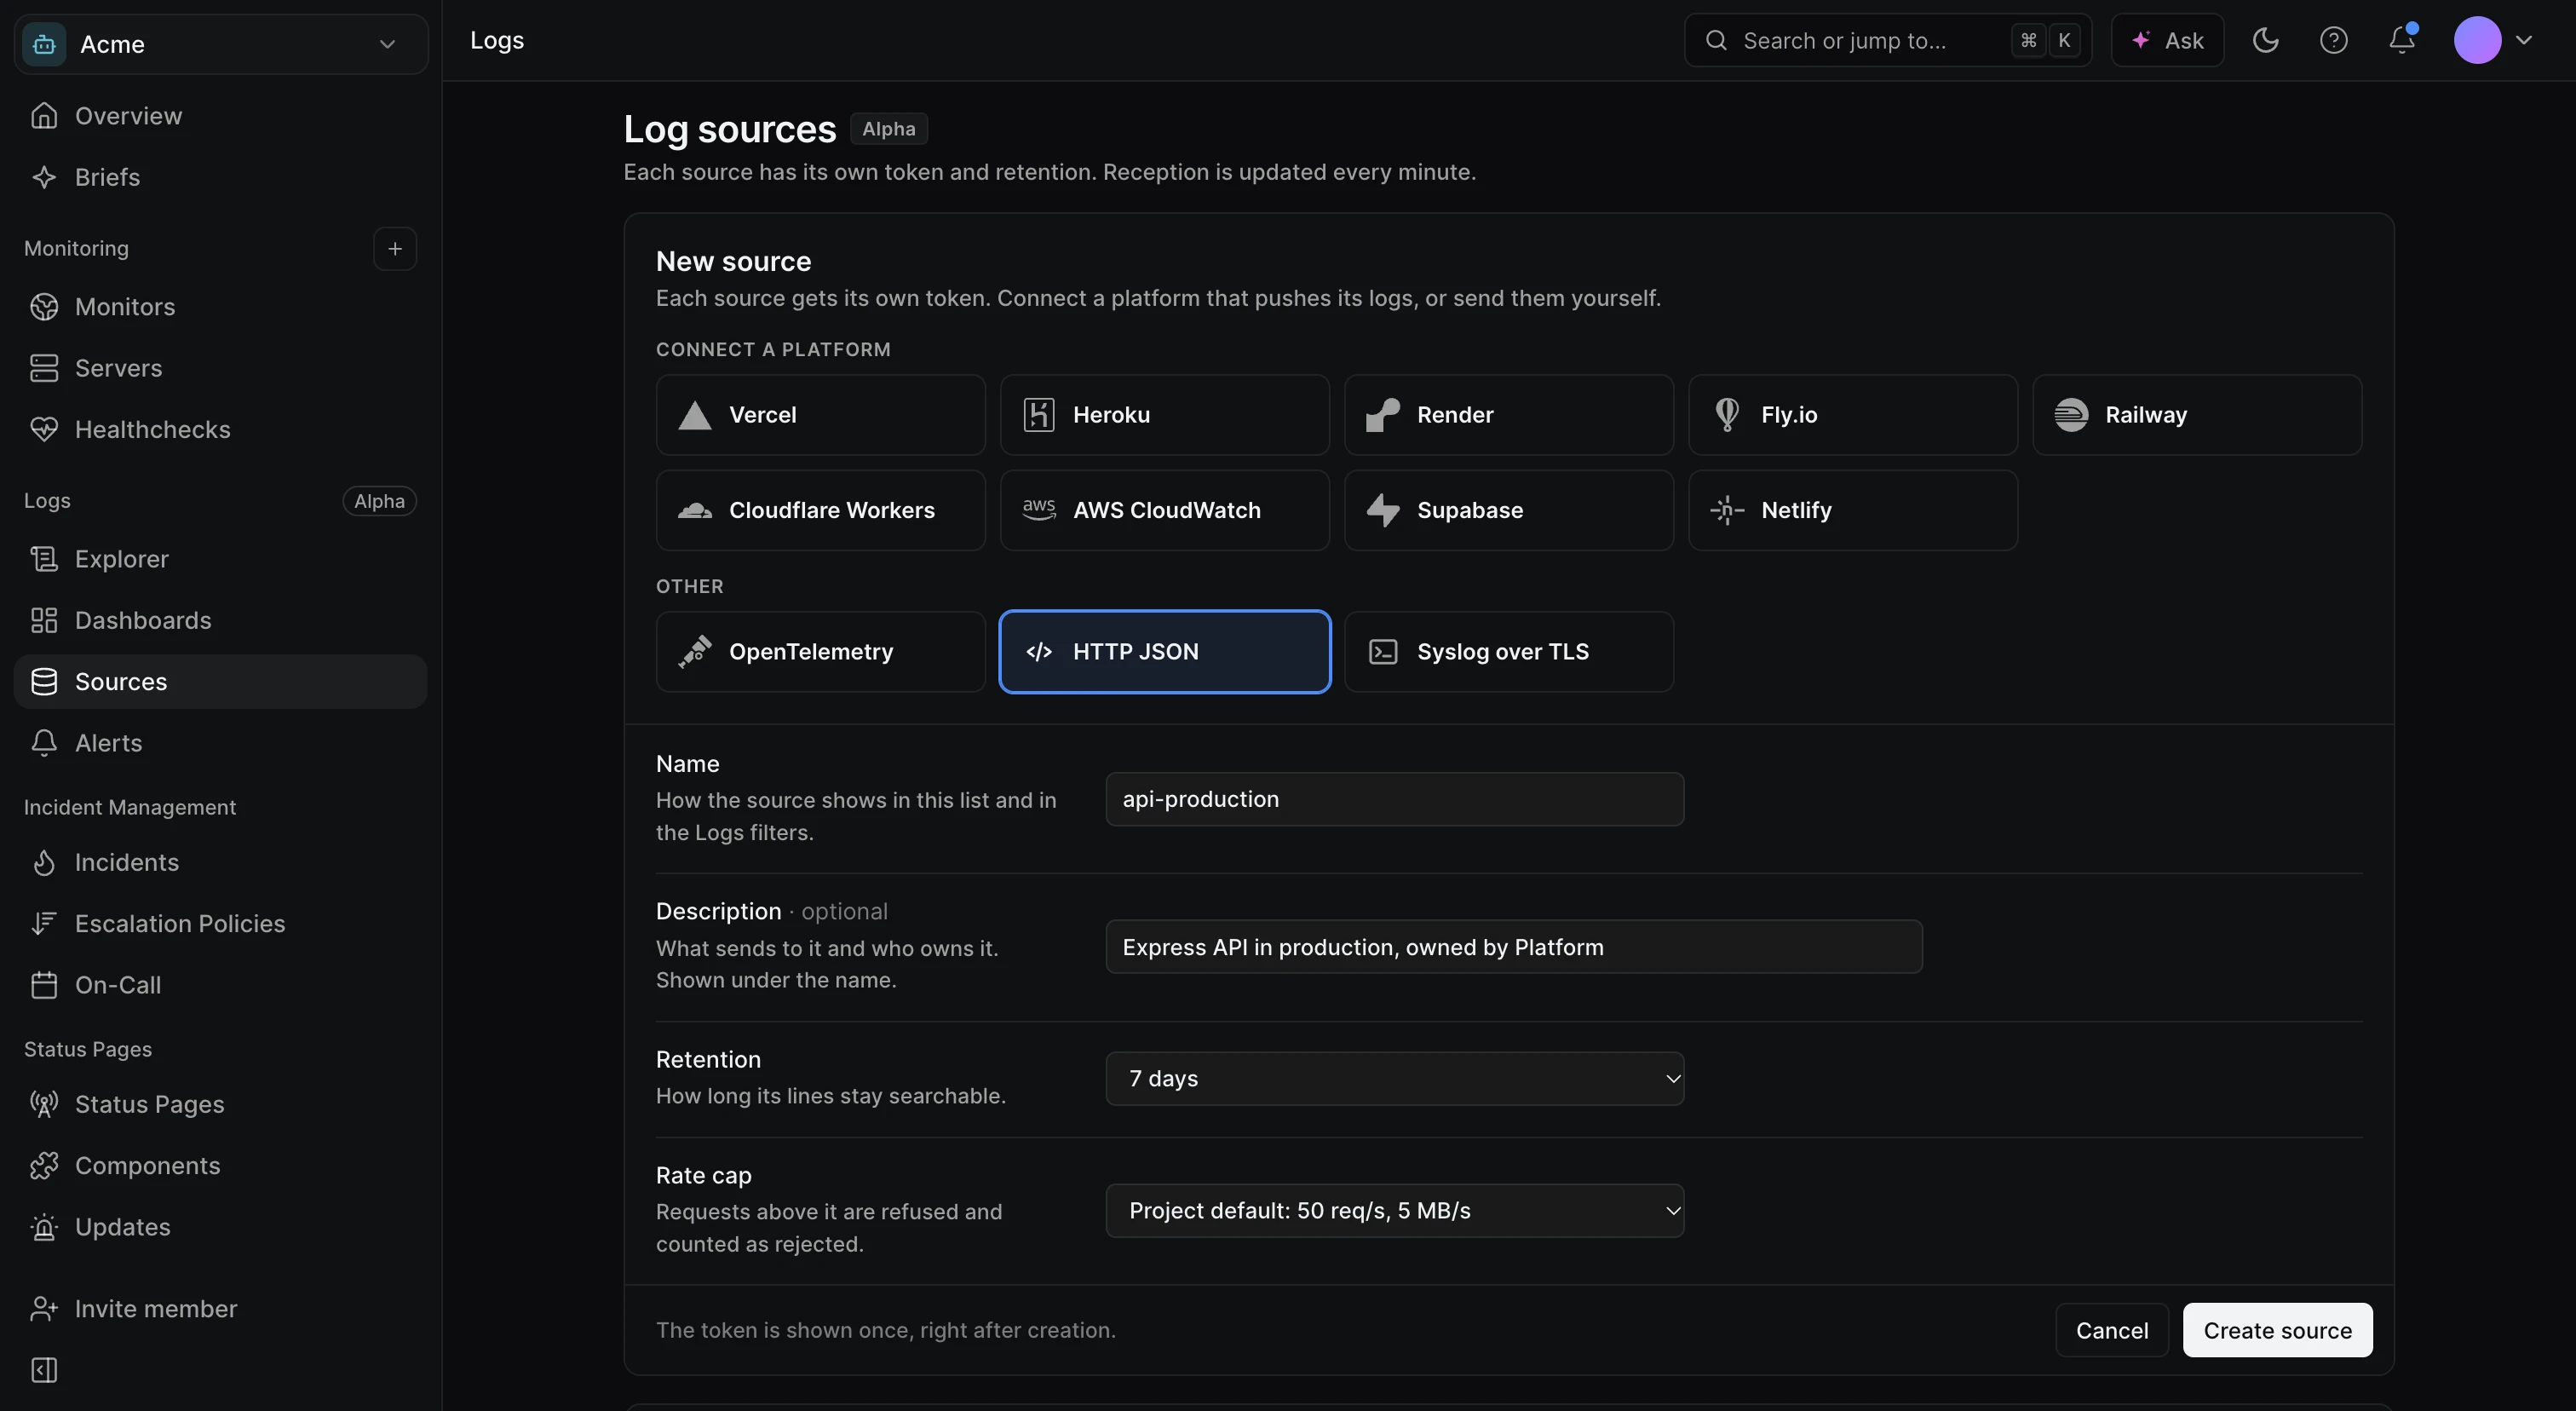
Go to LogsSourcesNew source
- Pick where the logs come from
Under Connect a platform, choose your hosting platform. Under Other, choose OpenTelemetry, HTTP JSON or Syslog over TLS to send them yourself.
- Name it
Fill in Name (it shows in the list and in the explorer's filters) and, optionally, a Description of what sends to it and who owns it.
- Choose a retention
Pick 3, 7, 14 or 30 days in Retention. The default is 7 days; Vercel suggests 3.
- Create it and copy the token
Click Create source (or Create and connect for a platform). Copy the token right away with Copy token: it is shown only once, and Hyperping only keeps its fingerprint.
- Send your first lines
The panel shows the setup for the type you picked, with your token already filled in, and waits for the first line. Use Send a test log to check the pipeline end to end, then Open live tail or Search this source.
Endpoints and authentication
| Protocol | Endpoint |
|---|---|
| HTTP JSON | POST https://logs.hyperping.com/ |
| OpenTelemetry (OTLP/HTTP) | POST https://logs.hyperping.com/v1/logs |
| Syslog over TLS | logs.hyperping.com:6514 |
HTTP requests authenticate with the source token in an Authorization: Bearer <token> header. Tokens start with hpl_. Syslog carries the token in the structured data of each message, as in the rsyslog example below.
The endpoint answers 202 Accepted once the lines are durably stored, so a client that retries on any other answer won't lose lines.
Send logs yourself
Pick the tab that matches your stack. Replace the token placeholder with your source token, ideally from an environment variable.
curl -X POST https://logs.hyperping.com/ \
  -H "Authorization: Bearer $HYPERPING_LOGS_TOKEN" \
  -H "Content-Type: application/json" \
-d '{"message":"Hello from curl","level":"info","service":"my-app"}'- OpenTelemetry: OTLP over HTTP, protobuf or JSON, gzip accepted. gRPC is not supported. Traces and metrics sent to the same endpoint are accepted but not stored. The environment variables work with any OpenTelemetry SDK (Node.js, Python, Go, Java, .NET, Ruby).
- Vector: the
httpsink batches lines as a JSON array and retries on failure. - rsyslog: RFC 5424 over TLS. The token travels in the structured data and is not stored with the line. The disk queue covers network cuts.
HTTP JSON format
Send one JSON object, an array of objects, or NDJSON (one object per line). Gzip and deflate request bodies are accepted. Hyperping reads the standard fields under their usual names and keeps everything else as attributes, searchable with attr.<key>. Nested objects are flattened with dots: in the example below, status_code is searchable as attr.http.status_code:504.
[
  {
    "timestamp": "2026-10-03T14:16:32.609Z",
    "level": "error",
    "message": "Timeout after 5000ms calling inventory-service",
    "service": "checkout",
    "environment": "production",
    "host": "api-prod-2",
    "trace_id": "4bf92f3577b34da6a3ce929d0e0e4736",
    "order_id": "ord_8f2K1x",
    "http": { "method": "POST", "path": "/api/checkout", "status_code": 504 }
  }
]| Field | Keys recognized |
|---|---|
| Time | timestamp, time, @timestamp, ts, dt, datetime, date |
| Message | message, msg, @message, log, text |
| Level | level, severity, level_name, lvl, levelname, log.level, loglevel, severity_text |
| Service | service, service.name, app, application |
| Environment | environment, env, deployment.environment |
| Host | host, hostname, host.name |
| Trace and span | trace_id, span_id |
The format is compatible with Logtail (Better Stack) HTTP payloads, so a JSON shipper already pointed at Logtail only needs a new URL and token.
Connect a platform
Platform sources point the platform's own log drain at Hyperping. After you create one, the panel lists the exact values to paste, the steps in the platform's dashboard, and a curl command to check the token first.
| Platform | How it connects |
|---|---|
| Vercel | Log drain (Team Settings → Drains) to https://logs.hyperping.com/vercel, JSON format, with the token in a custom Authorization header. Drains need a Vercel Pro or Enterprise team. |
| Heroku | HTTPS drain added with the Heroku CLI, or a telemetry drain on Fir. |
| Render | Log stream (Integrations → Observability → Log Streams) to logs.hyperping.com:6514 with the token. |
| Fly.io | The fly-log-shipper app with an HTTP sink. |
| Railway | A Locomotive sidecar sending JSON to https://logs.hyperping.com/. |
| Cloudflare Workers | Workers OpenTelemetry export to /v1/logs, or a Workers Logpush job. |
| AWS CloudWatch | A CloudFormation stack that subscribes your log groups to a Firehose stream, launched from the panel or with the AWS CLI. |
| Supabase | Log drain (Project Settings → Log Drains) to https://logs.hyperping.com/. |
| Netlify | Log drain to https://logs.hyperping.com/, NDJSON format. |
heroku drains:add "https://x:<your-source-token>@logs.hyperping.com/heroku" -a <your-app>Lines from a platform carry its name: search them with platform:vercel, or use the Platform drains view. DigitalOcean App Platform can't forward logs to a custom endpoint, so it isn't supported.
Manage a source
Click a source in the list to open it.
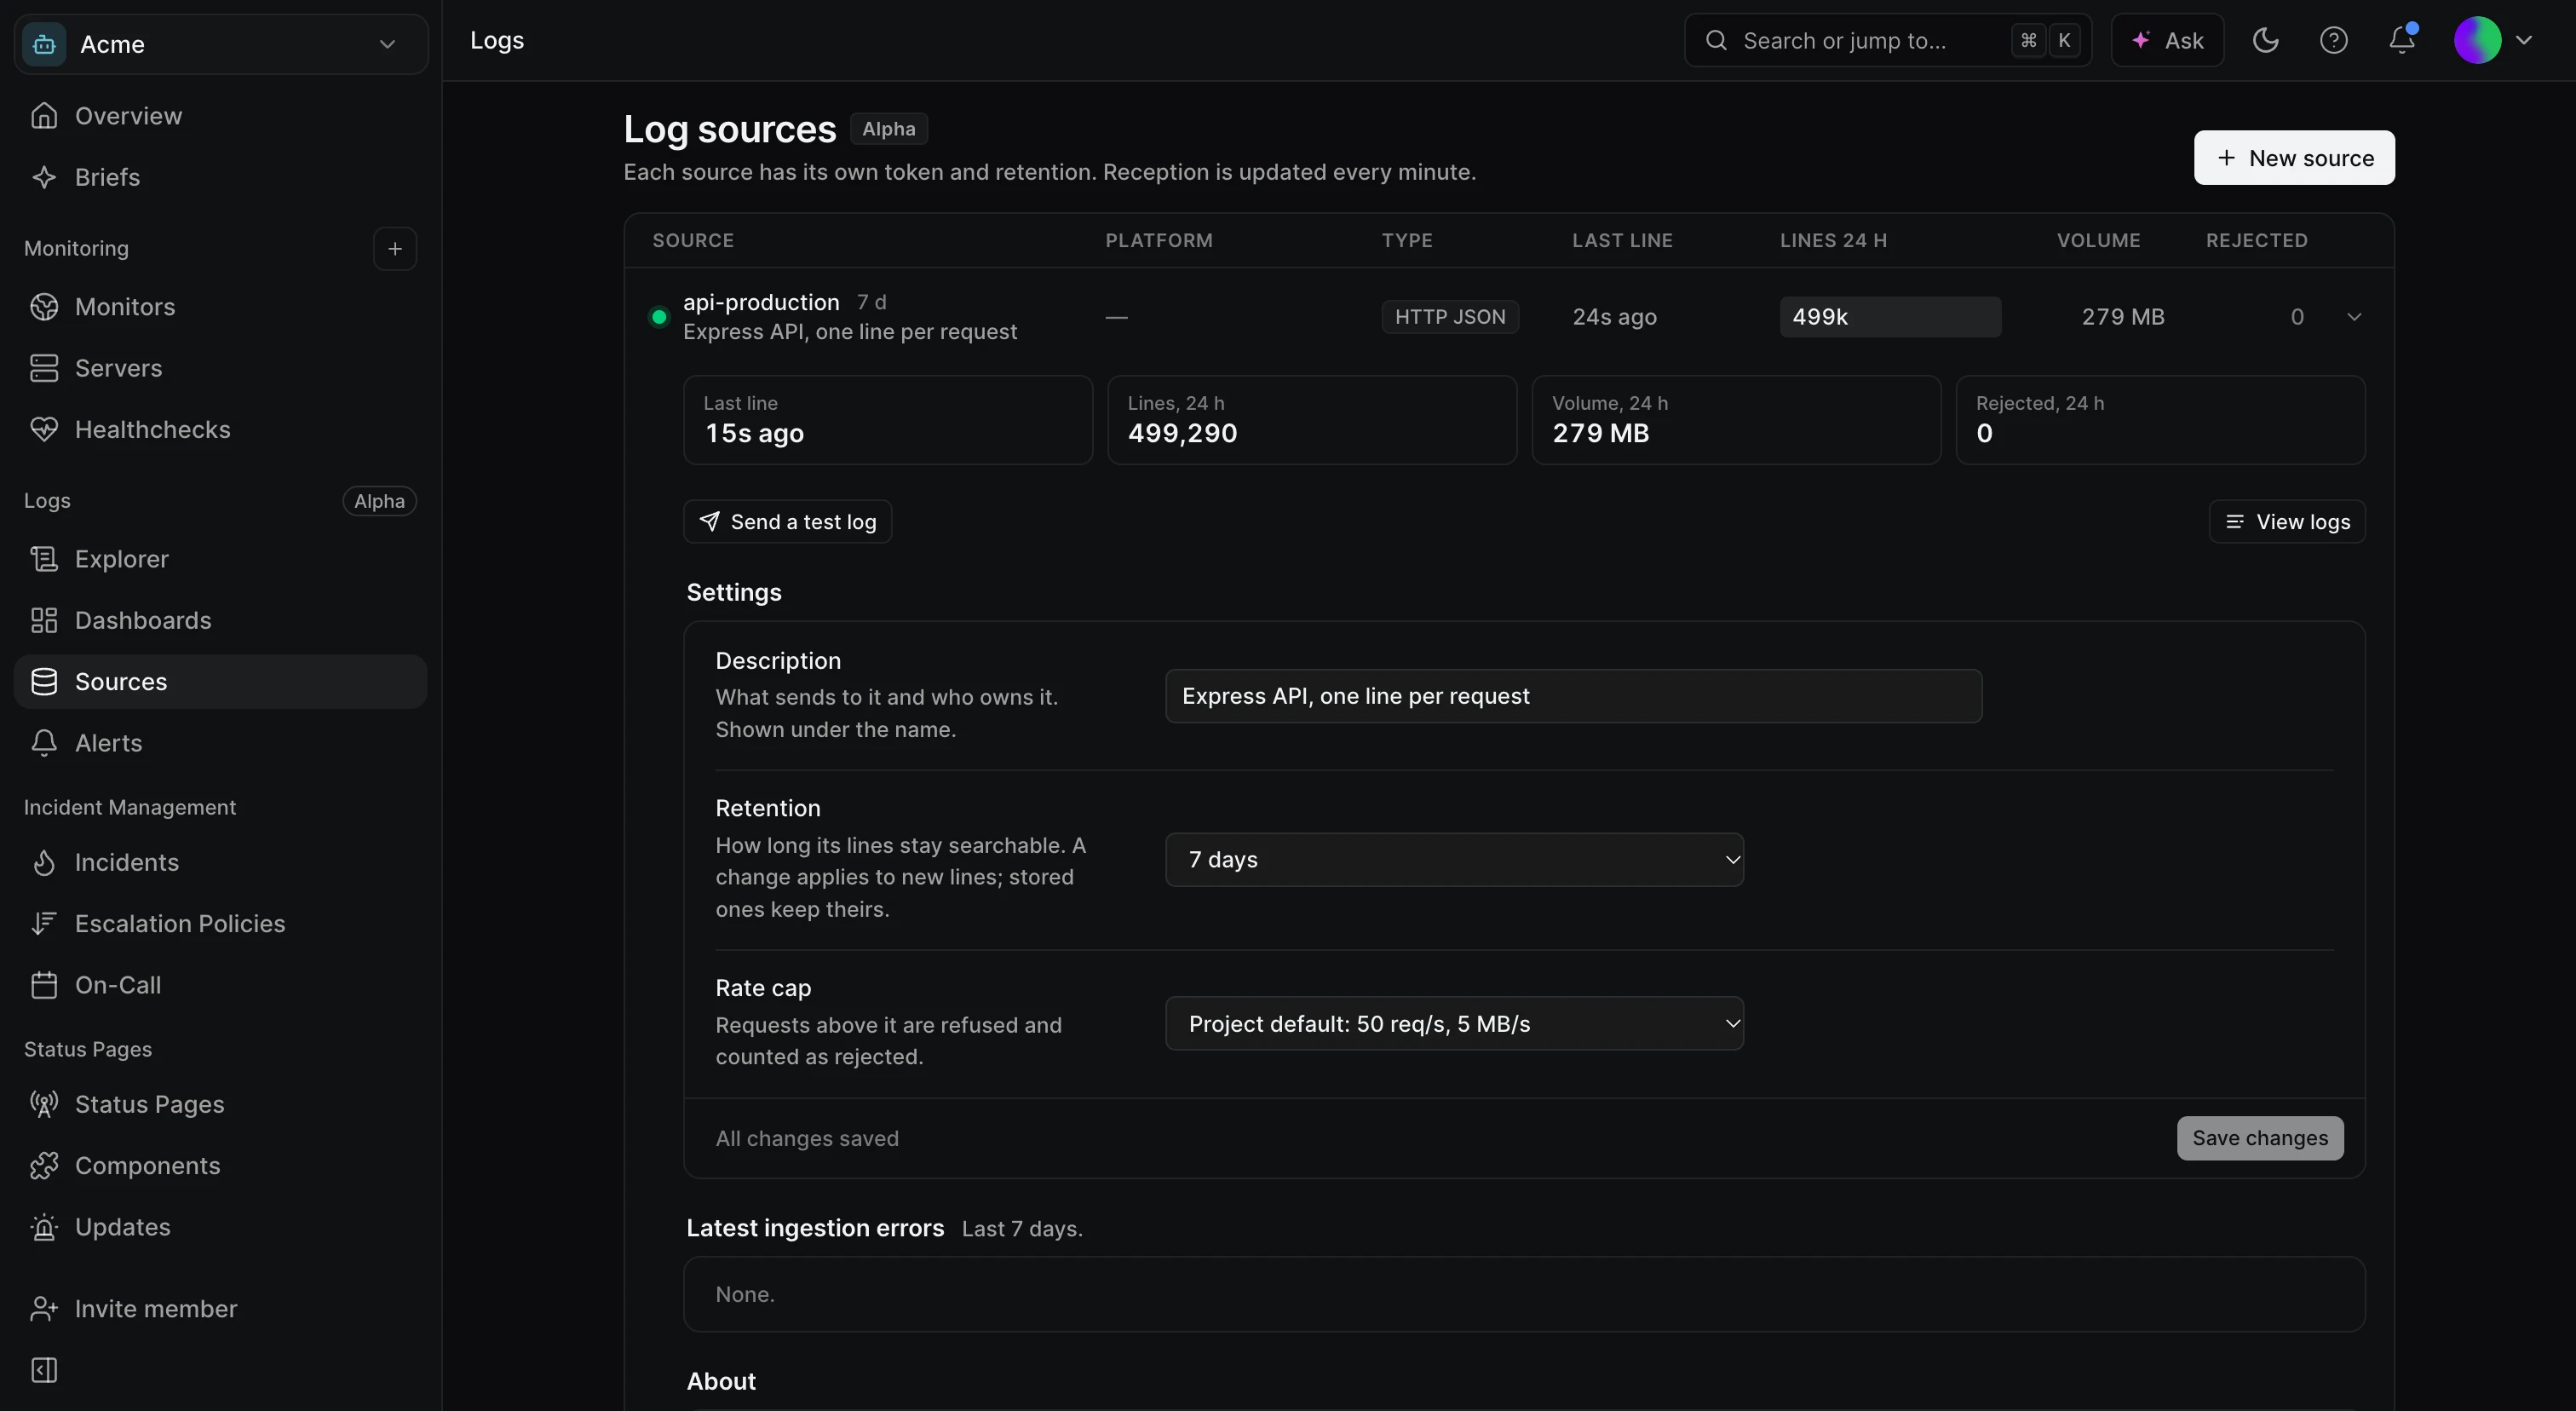
- Last line, Lines, 24 h, Volume, 24 h and Rejected, 24 h show what the source received. The list updates every minute; a green dot means a line arrived in the last 5 minutes.
- Send a test log sends a line through the source; View logs opens the explorer filtered on it.
- Settings edits the Description, the Retention and the Rate cap. A new retention applies to new lines, within about a minute; lines already stored keep theirs.
- Latest ingestion errors lists refused requests over the last 7 days, with the reason.
- About shows the Source ID. Search a source's lines with
source:<ID>.
Revoke a source
Under Danger zone, click Revoke…. Anything sending with its token is refused with a 401 within a minute. Lines already stored stay searchable until their retention ends.
Limits
| Limit | Value |
|---|---|
| Sources per project | 50 active |
| Retention | 3, 7, 14 or 30 days, per source |
| Request body | 10 MiB compressed, 32 MiB decompressed (413 above) |
| Message | Truncated at 64 KiB |
| Attributes | 128 per line, values truncated at 16 KiB, keys at 256 characters |
| Timestamps | From 48 hours in the past to 10 minutes in the future; others are clamped |
| Rate | Per project, by plan, with a daily volume cap. Above it the endpoint answers 429 with a Retry-After header |
Troubleshooting
The source stays on "Waiting for the first log"
Run the curl command from the panel with the same token. A 401 means the token is wrong or revoked. If curl works, the problem is in your app's configuration: check the endpoint path (/v1/logs for OpenTelemetry, / for JSON) and that the exporter is enabled.
Requests answer 415
The content type isn't supported. Send JSON, NDJSON or OTLP (protobuf or JSON), and set Content-Type accordingly.
The Rejected count goes up
Open the source and read Latest ingestion errors. The usual reasons are Rate limited, Daily cap reached, Request too large, Malformed request and Timestamp out of range.
Lines arrive without a level or service
Hyperping didn't find them under a recognized key. Rename the field in your logger, or set OTEL_SERVICE_NAME with OpenTelemetry. The raw value stays available as an attribute meanwhile.