Search and explore logs
Find the lines that explain an incident: search across every source, narrow down with filters, follow new lines live, and share what you found with a link.
Go to LogsExplorer
Overview
The explorer shows the newest lines first, with a histogram of volume per level above them. Every control writes into the search bar and the page URL, so a search, a time range or an open line can be shared with a teammate as a plain link.
- You want every error the checkout service logged in the last hour.
- You need the request that failed for a given user or order ID.
- You are deploying and want to watch new lines arrive.
- You found the culprit and want to hand a teammate the exact view.
Pick a time range
Use 15m, 1h, 24h or 7d next to the search bar, or Custom… to enter a From and To date. A search covers up to 7 days, within the last 30.
On the histogram, drag across a range to zoom into it, or use Earlier, Zoom out and Later. Clicking a bar jumps the list to that moment. The Incidents toggle draws your incidents over the histogram, so you can see whether errors started before or after an outage.
Search syntax
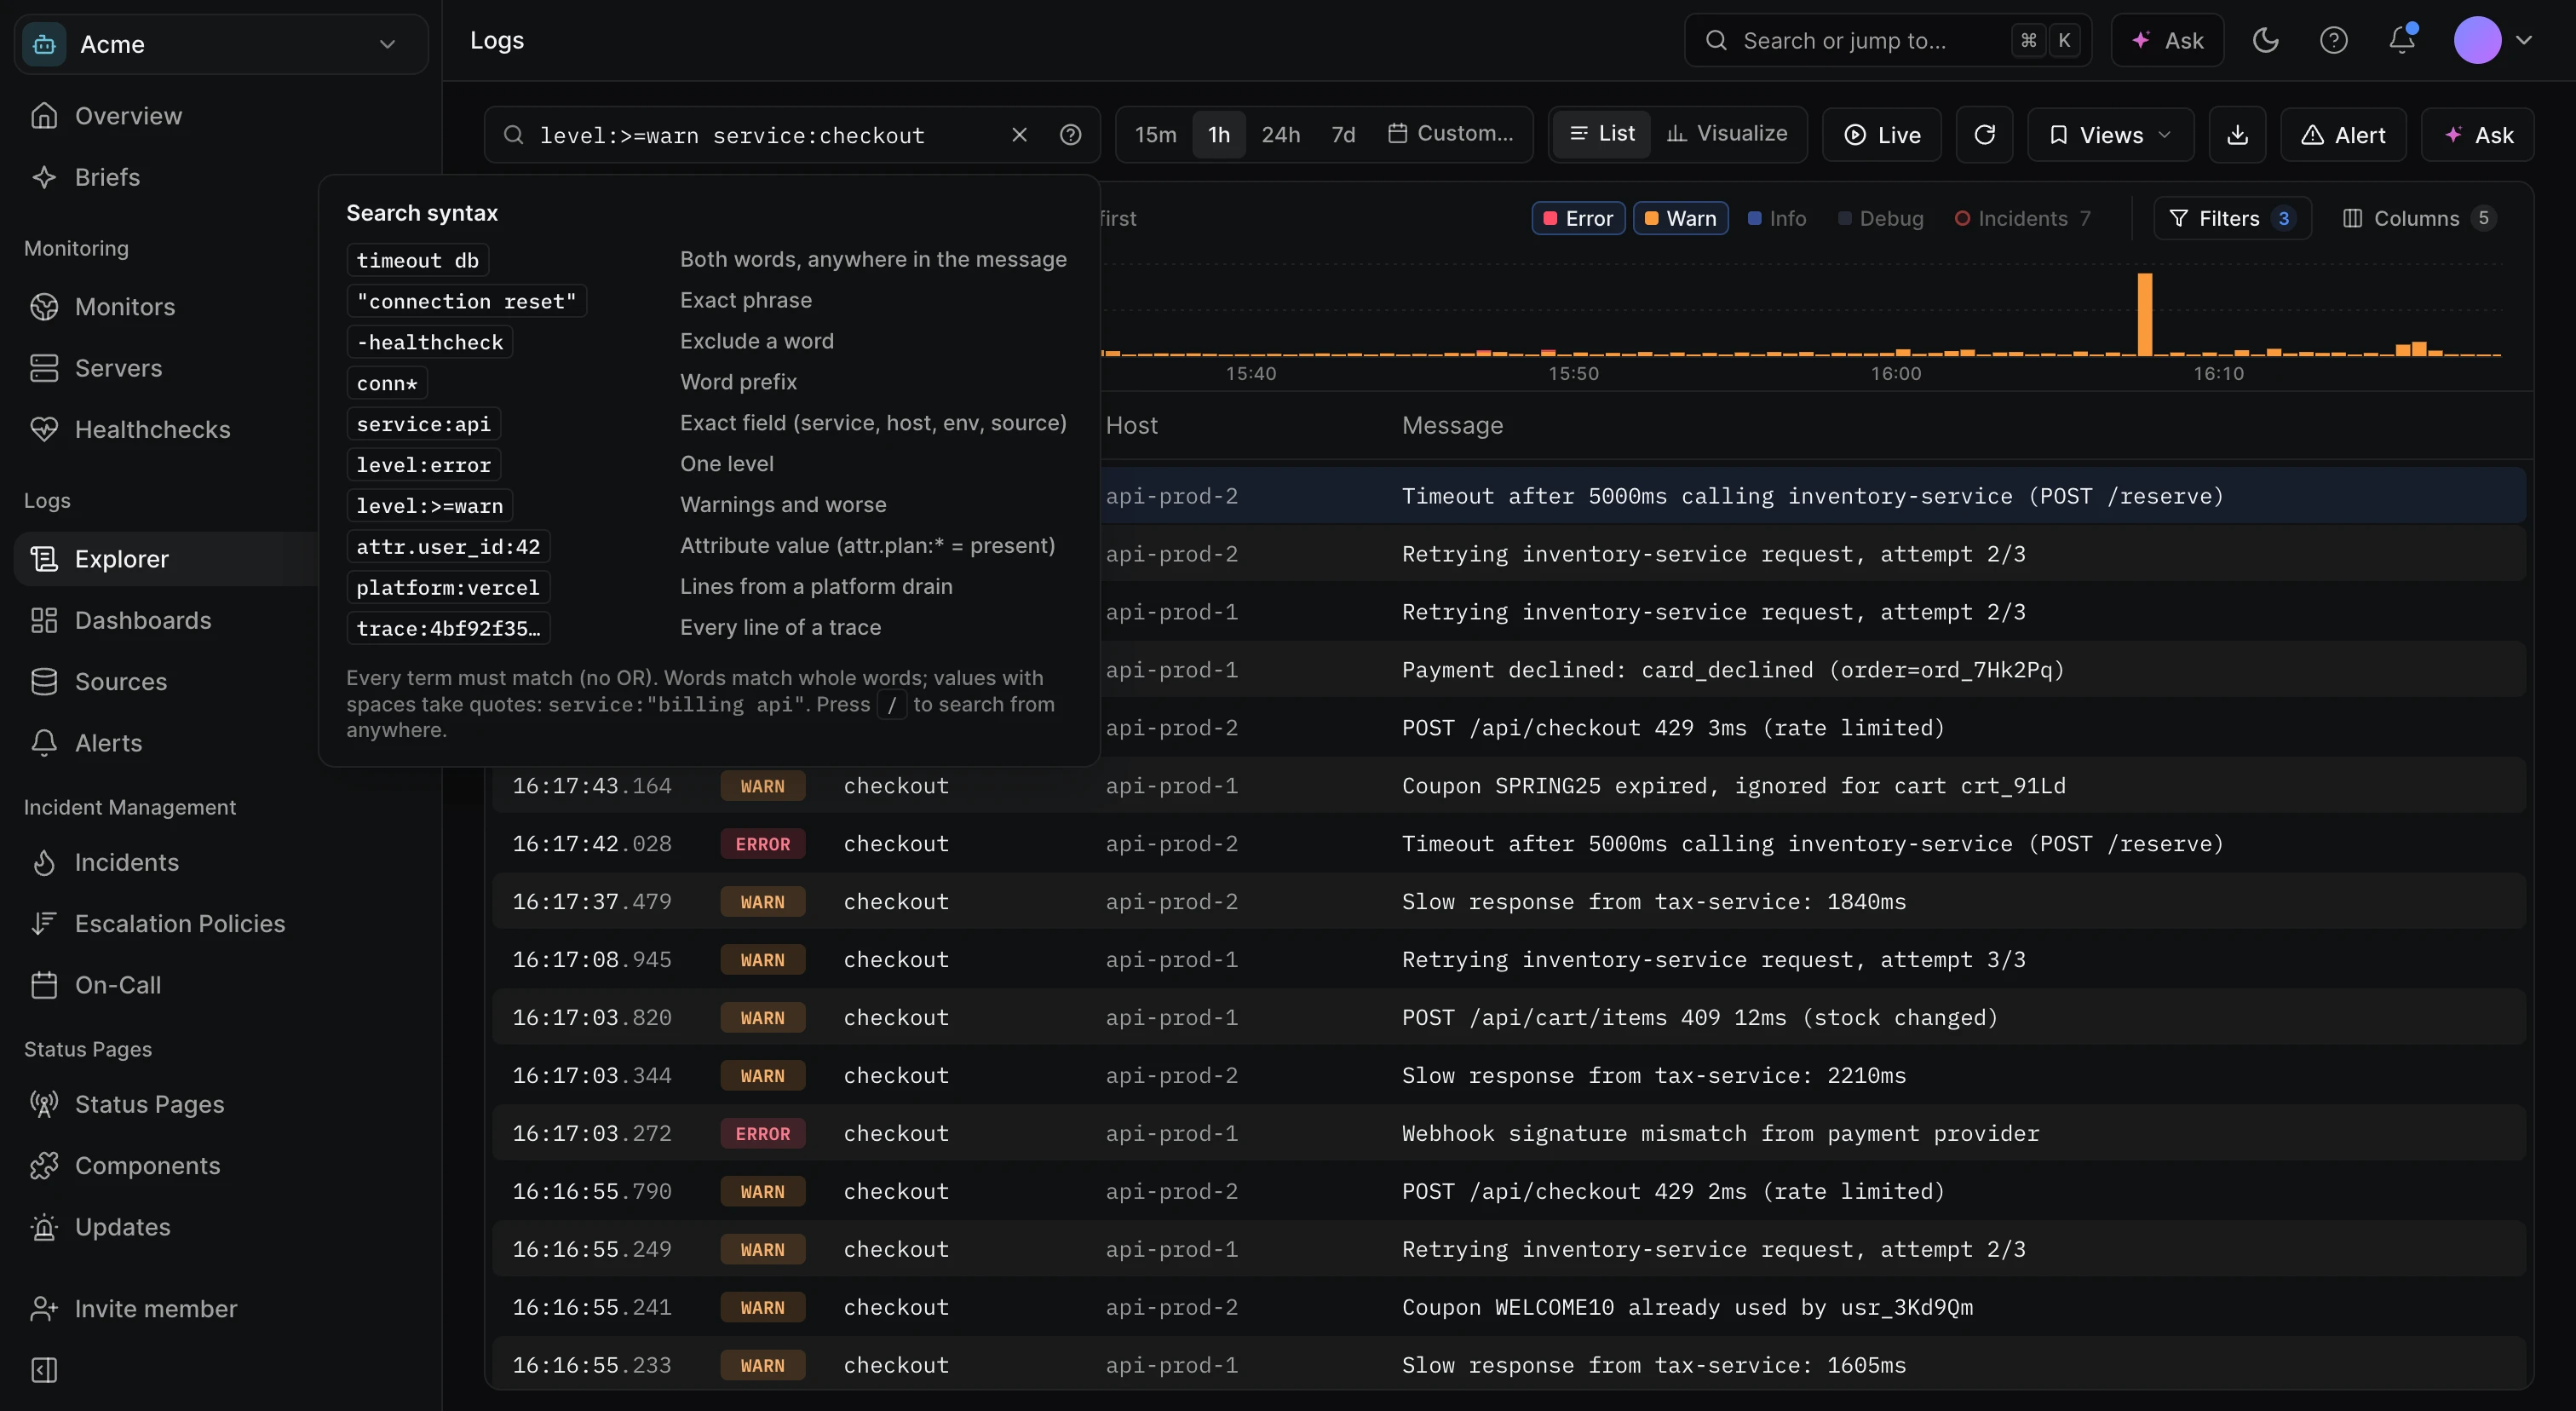
Type in the search bar, or press / from anywhere on the page to focus it. Suggestions list your recent searches, field names and their values. The ? button at the end of the bar opens the syntax reference.
| Search | Matches |
|---|---|
timeout db | Both words, anywhere in the message |
"connection reset" | The exact phrase |
-healthcheck | Lines without that word. Works on phrases and fields too: -"GET /", -service:web |
conn* | Words starting with conn |
service:api | An exact field value. Works with service, host, env and source. service:api* matches a prefix |
service:(api|web) | Any of the listed values, up to 100. -service:(api|web) excludes them |
level:error | One level |
level:>=warn | Warnings and worse. >, <=, < and = also work |
attr.user_id:42 | An attribute value. attr.plan:* matches lines that have the attribute |
resource.k8s.namespace:prod | An OpenTelemetry resource attribute |
platform:vercel | Lines from a platform drain |
trace:4bf92f35… | Every line of a trace. span: works the same way |
A few rules apply to every search:
- Every term must match.
ORis not supported; for levels, use a comparison such aslevel:>=warn. - Words match whole words. Use
*for a prefix. - Values with spaces take quotes:
service:"billing api". - Levels accept common aliases:
warningiswarn,erriserror,criticalandpanicarefatal. - A search is limited to 1,000 characters and 20 terms.
Filter without typing
Click Filters to open the filter rail. It lists the values found in the current search for Level, Service, Host, Environment and Source, plus a few frequent attributes, with a count for each.
- Tick a value to add it to the search, or click only to keep that value alone.
- Click a level in the histogram legend to filter on it. Shift-click keeps that level and worse.
- Counts marked ≈ are estimates on large volumes.
The rail edits the search bar, so the URL always reflects what you see.
Inspect a line
Click a line, or move with ↑/↓ (or j/k) and press Enter, to open its detail panel. It shows the full message, the standard fields, and every attribute and resource attribute the line carries.
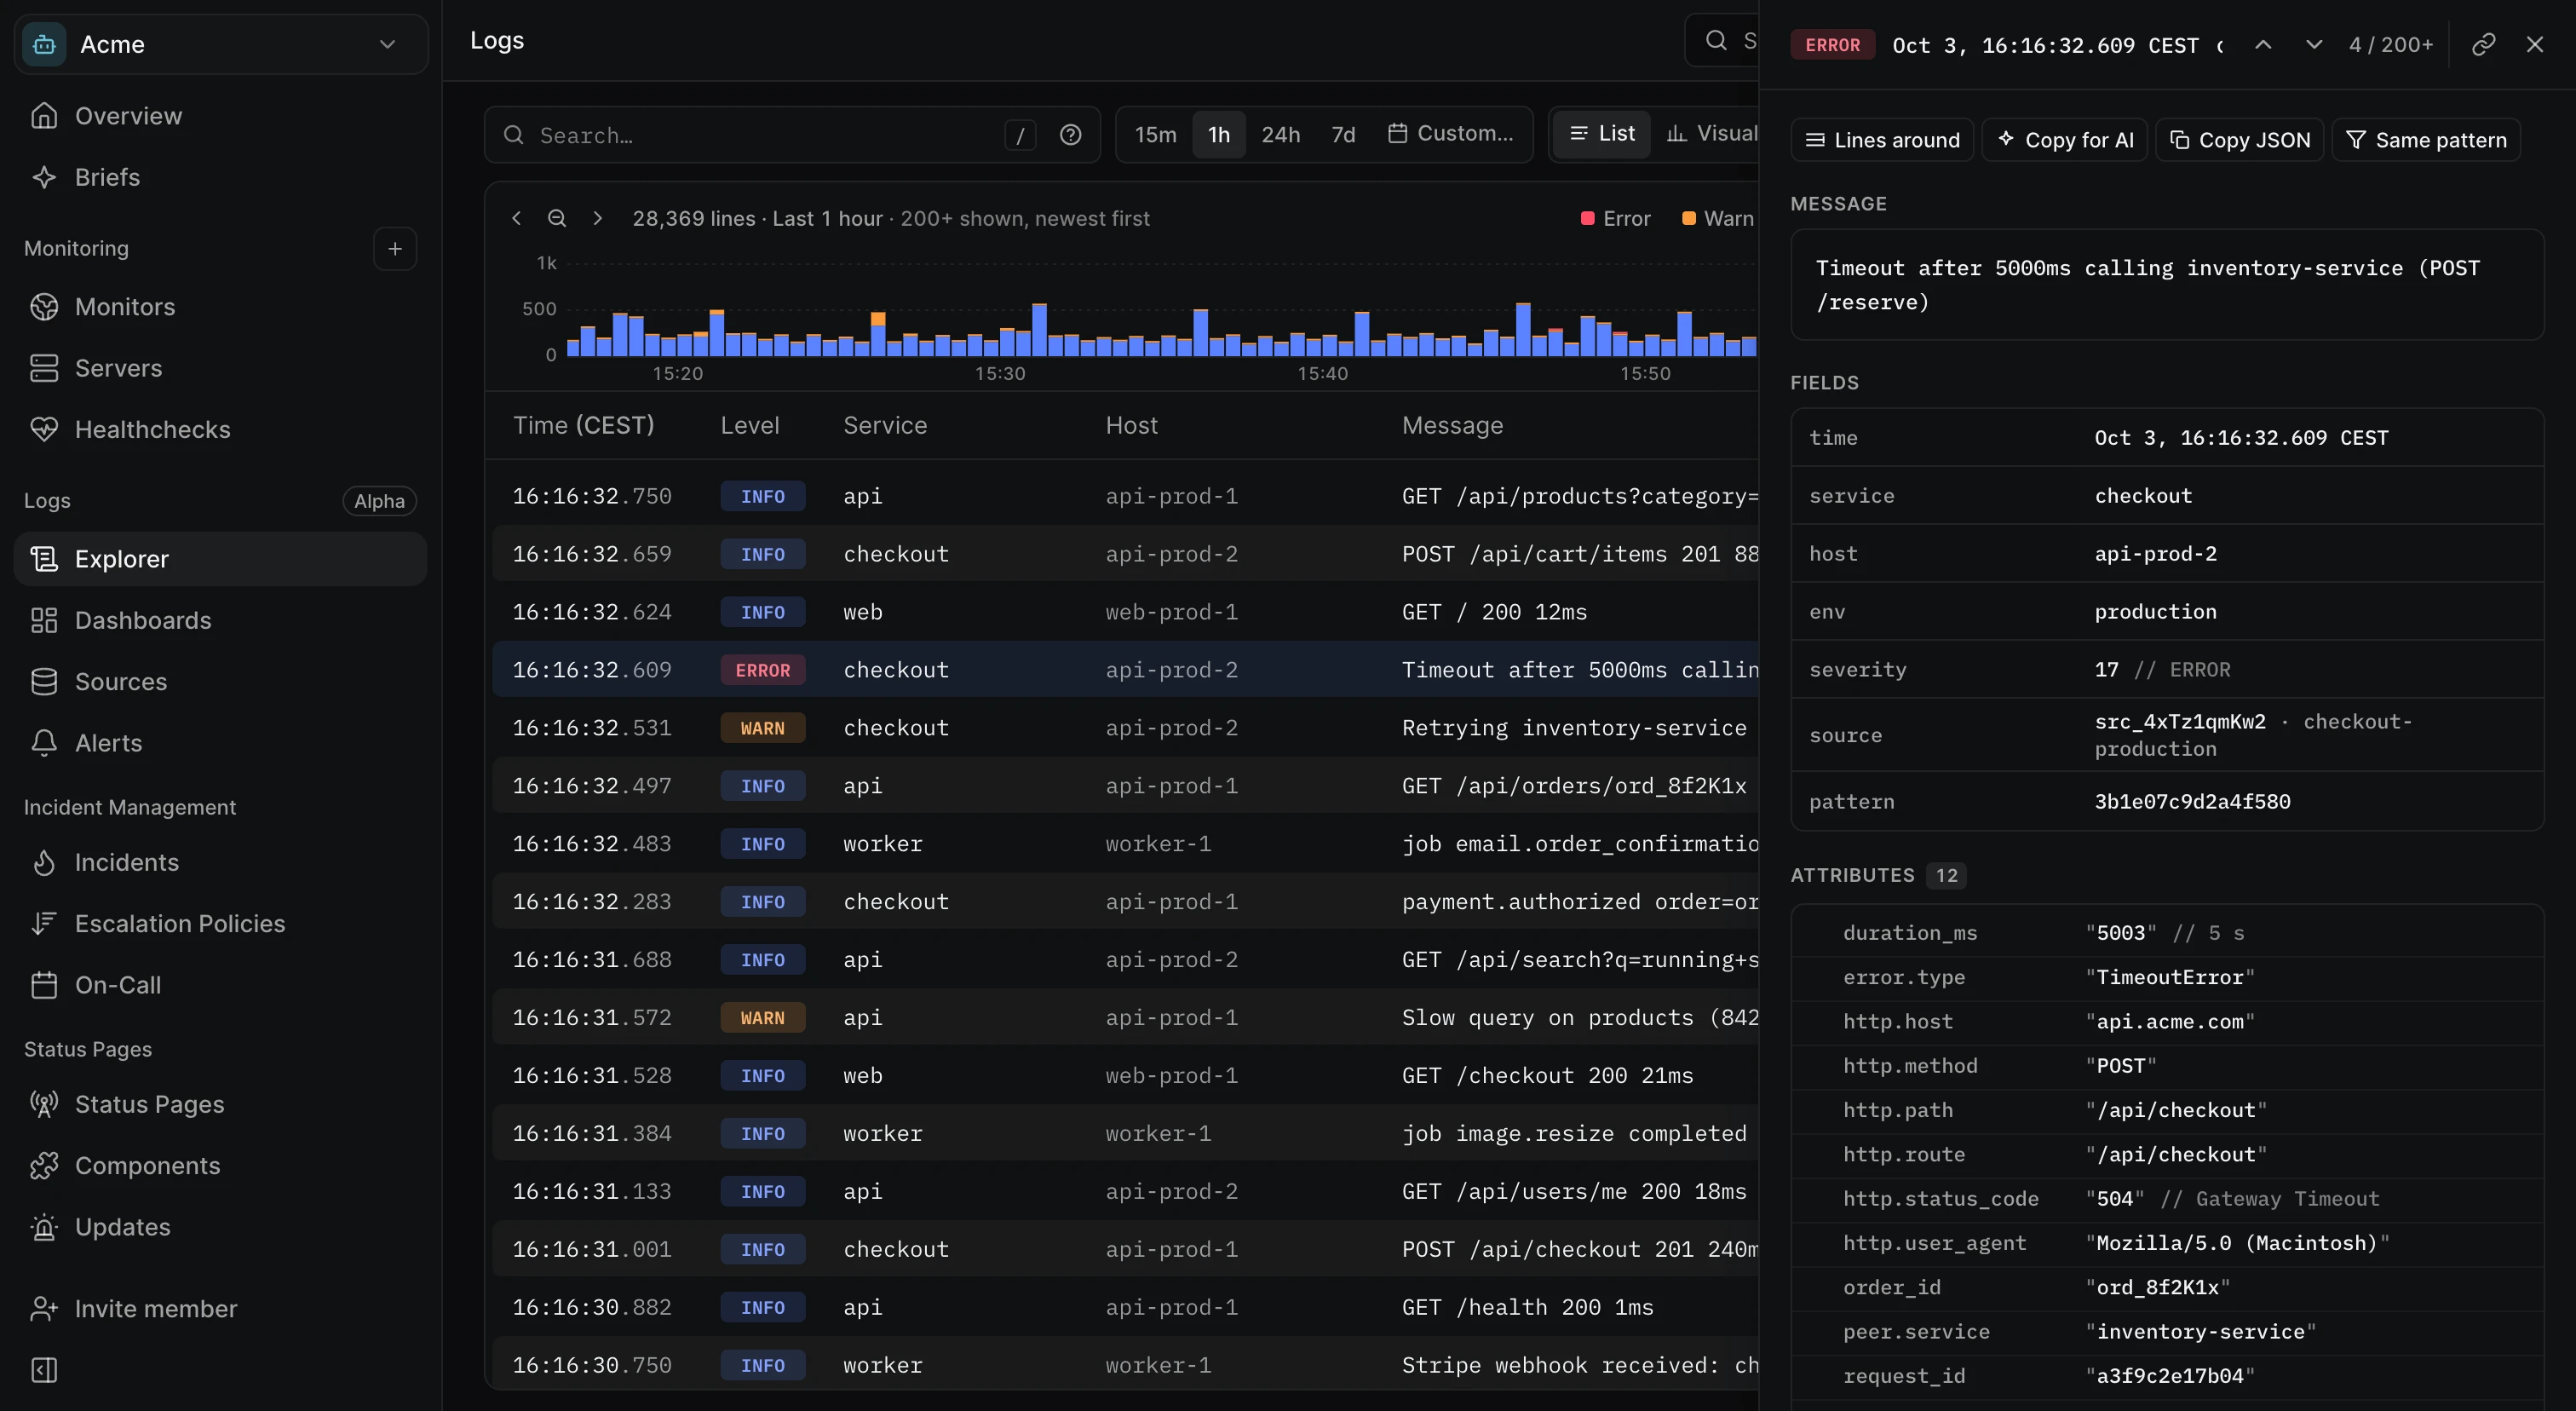
From the panel:
- Lines around shows the 20 lines before and after from the same source and host.
- Same pattern finds every line with the same message shape, with the variable parts (IDs, durations) ignored.
- Lines of this trace and Search this trace appear when the line has a trace ID.
- Copy for AI copies the line and its context as Markdown, ready to paste into an assistant. Copy JSON copies the raw line.
- Hover any field or attribute to filter on it, exclude it, show it as a column, or copy its value.
- The link button copies a URL that opens this exact line.
Messages longer than 32 KB are truncated in the panel. Press Esc to close it.
Follow new lines live
Click Live to show new lines as they arrive, over the last 15 minutes. The list keeps up to 5,000 lines and shows the arrival rate when traffic is high.
New lines are held back while you scroll, hover the list or have a line open, so the line you are reading doesn't move. A band shows how many lines are waiting; click Resume or press Home to catch up. Stop live mode to go back to a normal search over the window on screen. A link ending in ?live=1 opens straight into live mode.
Choose columns
Click Columns to show or hide Time, Level, Service, Host, Source and Trace. The message is always shown. You can add up to 4 field columns, such as attr.user_id or attr.http.status_code, switch between Comfortable and Compact, and turn on Wrap long messages. Drag a column header to resize it.
Column choices are saved for this project, in this browser.
Save and share views
A view stores the search, the time range, the columns and the filter rail. Open Views to use one:
- Built in views: Errors, Warnings and worse, plus HTTP 5xx when your lines carry a status code and Platform drains when a drain source exists.
- Save current view keeps up to 50 views of your own.
- Each saved view has a copy-link button. Someone opening the link sees a banner with Save to my views.
Saved views live in your browser, per project. Share them by link to give them to a teammate.
Export lines
The download button offers Copy visible lines, Download CSV and Download JSON (NDJSON). Exports contain up to 10,000 lines of the current search, newest first, with times in UTC.
Logs on incident pages
Every incident has a Logs tab covering 15 minutes before it started to 5 minutes after. Switch between Matched by the alert, Warnings and errors and Every line to widen the view.
Limits
| Limit | Value |
|---|---|
| Time range of one search | 7 days, within the last 30 |
| Lines per page | 200, more load as you scroll |
| Search length | 1,000 characters, 20 terms |
| Searches per project | 120 per minute, shared by the team |
| Live tail buffer | 5,000 lines |
| Export | 10,000 lines |
Troubleshooting
No logs match
Check the time range first: the default is the last hour. The empty state offers to widen the range or clear the search, and shows each term as a chip you can remove one at a time.
A word I can see in the message doesn't match
Words match whole words. time doesn't match timeout; use time*.
Too many searches
The project ran more than 120 searches in a minute, often from several people in live mode or from an export. Wait a few seconds and retry.