What is Server monitoring?
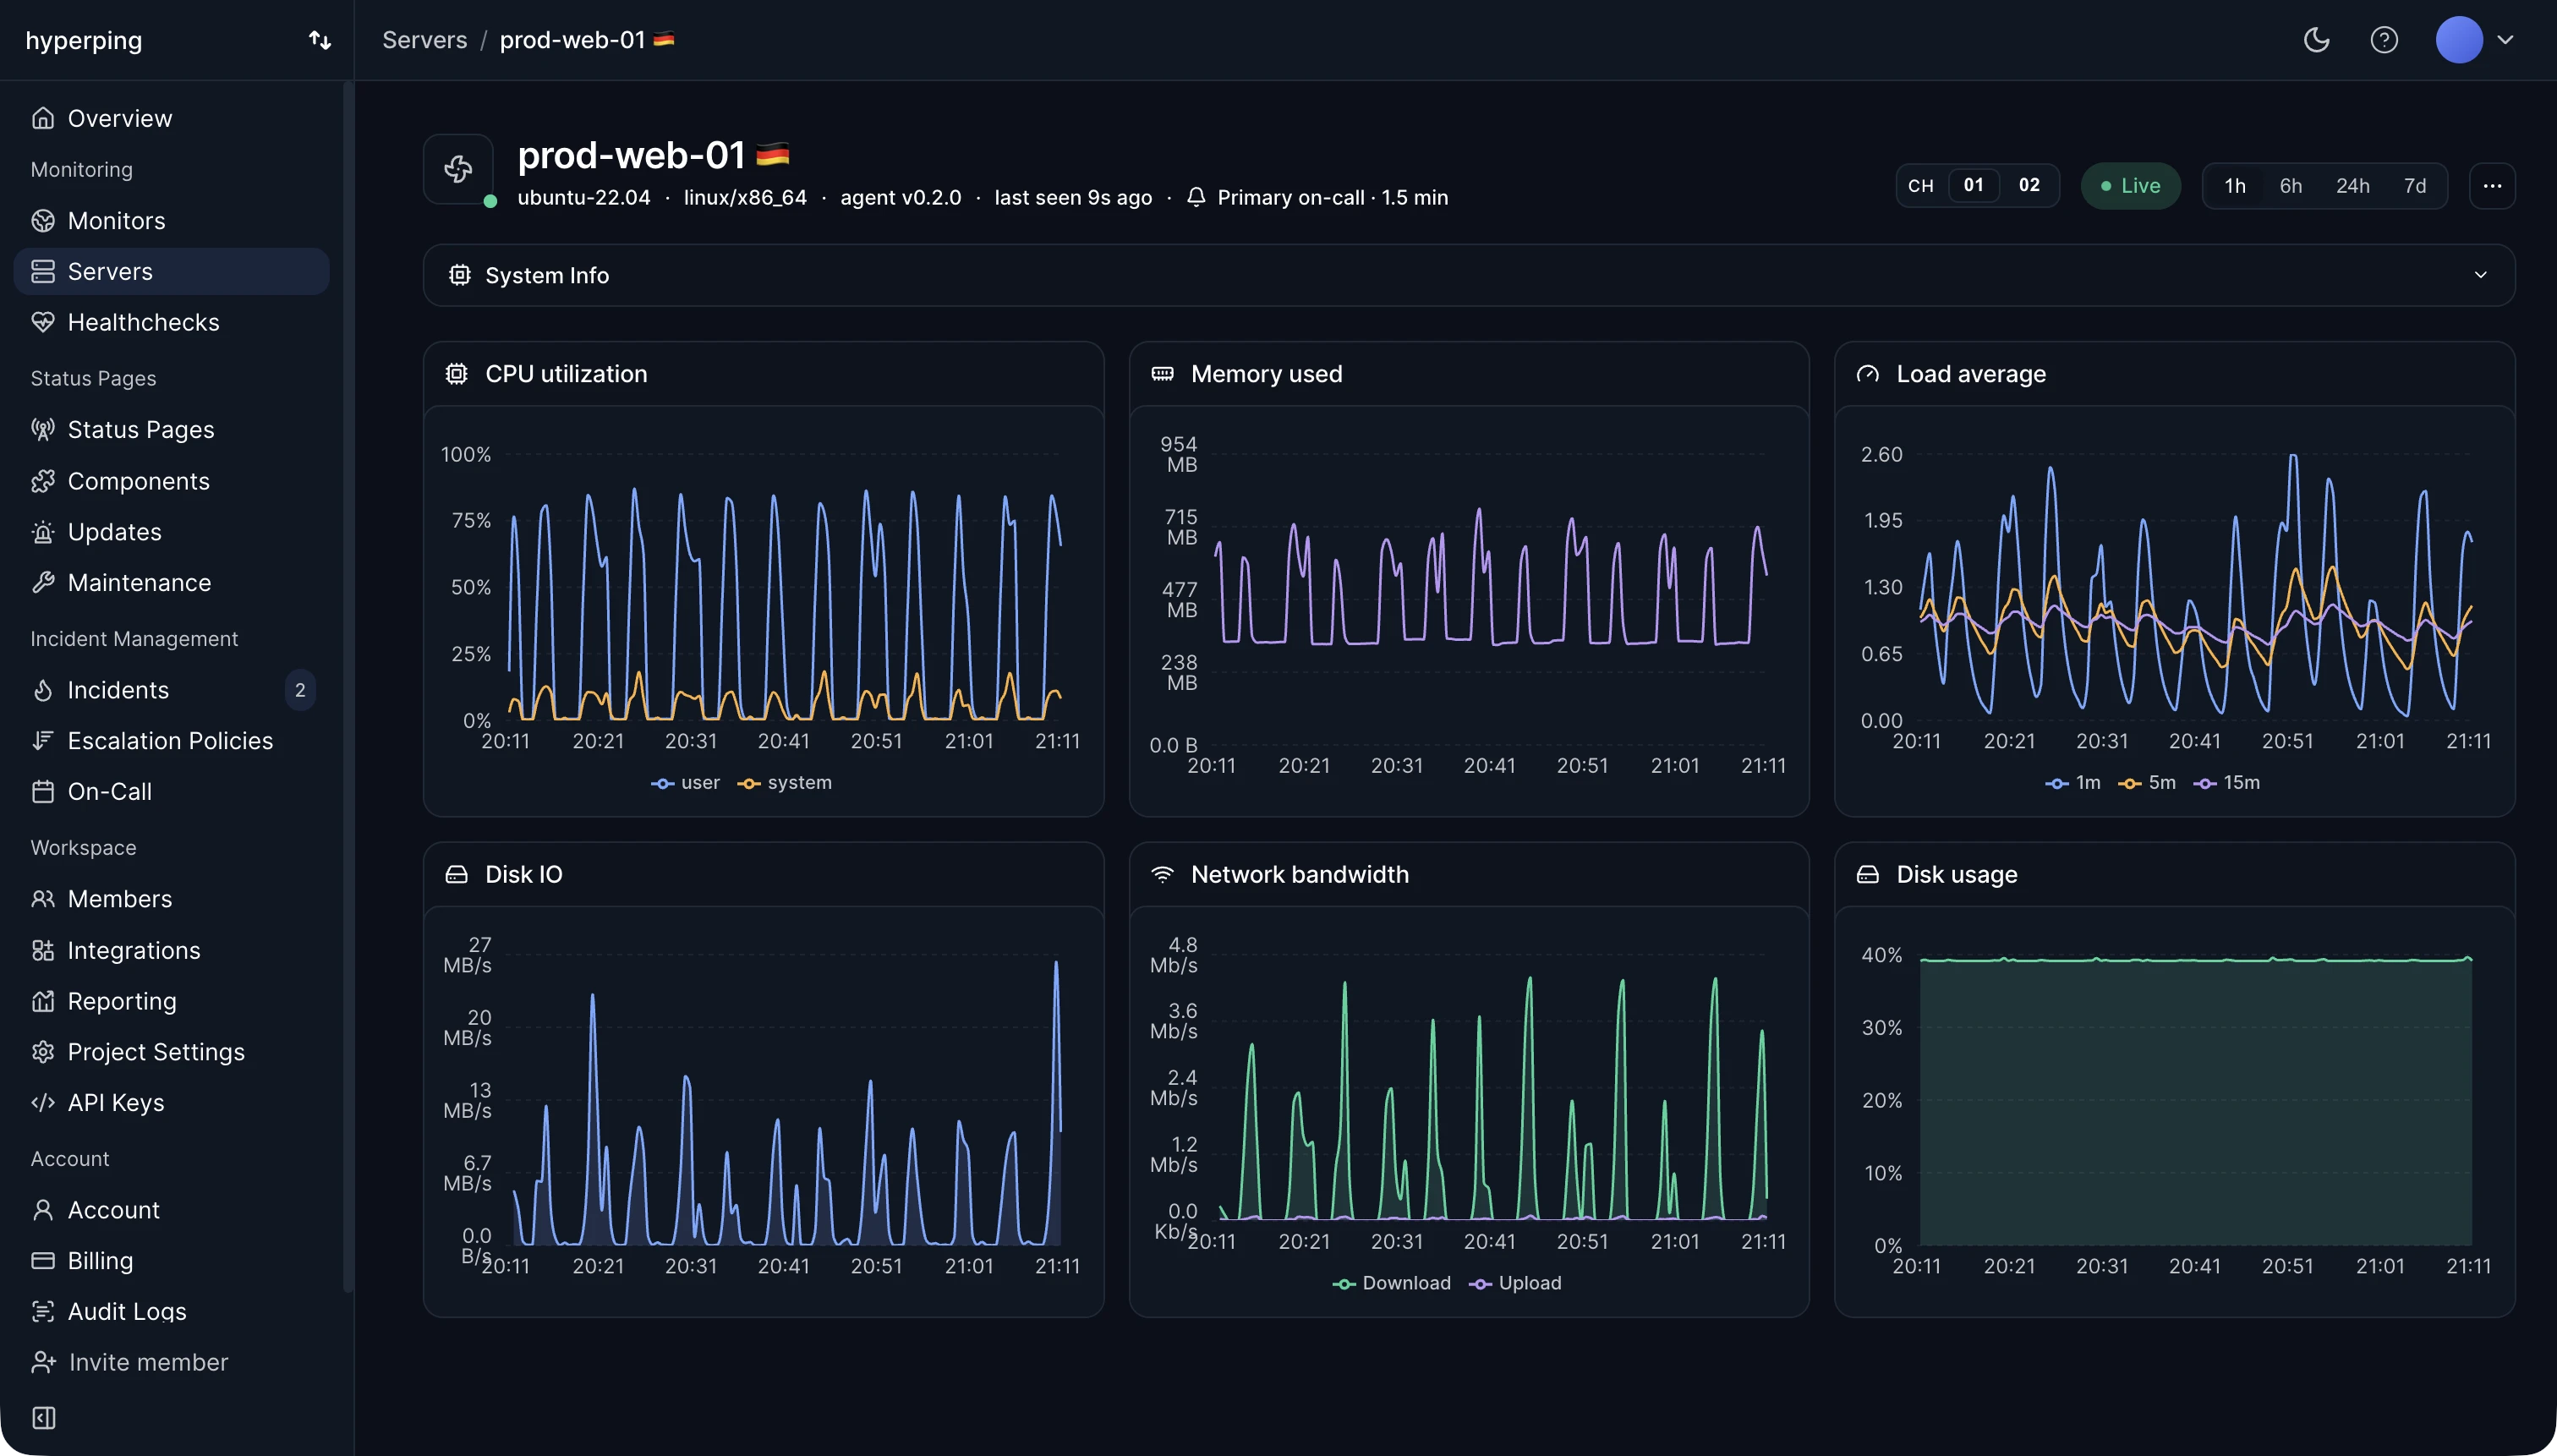
Install a lightweight agent on your Linux and macOS hosts and stream system metrics straight to your Hyperping dashboard. Each install creates one server entry showing CPU and load averages, memory, filesystem usage, disk I/O, network throughput, and host metadata, with no collector of your own to manage.
What it collects
The agent embeds an OpenTelemetry collector that scrapes system metrics every 30 seconds and ships them to Hyperping over OTLP/HTTP. The first data point reaches the dashboard within a few seconds of enrollment.
Metric categories 6 groups
CPUpercent / loadMemorybytes / percentFilesystembytesDisk I/ObytesNetworkbytesSystemseconds / stringQueue resilience, not a metric: the collector persists unsent batches to /var/lib/hyperping/queue so metrics survive ingest outages, reboots, and network blips.
For the full list of fields and units, see Metrics collected.
How enrollment works
- Generate a token
Add a server in the dashboard. Hyperping returns a single-use install token scoped to that server entry.
- Exchange for an agent token
The installer hands the install token to Hyperping and gets back a long-lived per-host agent token. From that point on the host authenticates as itself, not as the shared install token.
- Rotate by re-running
Running the installer with a new install token re-enrolls the agent and revokes the old credential. Same server UUID, clean rotation.