
The best API monitoring tools are Hyperping for HTTP and API checks with on-call and a status page, Checkly for API monitoring as code, Postman Monitors if your requests already live in Postman collections, Datadog for connecting failed checks to traces and logs, Grafana Cloud if you already write k6, Better Stack for checks inside an incident workflow, and UptimeRobot for inexpensive availability checks.
I analyzed 31 products and shortlisted seven. Every tool below runs scheduled HTTP or API checks from outside your infrastructure and can check more than the status code. API analytics, security products, gateways, and self-hosted probes are further down.
Prices were checked in September 2026. What changes the shortlist most is how each tool bills: Datadog charges $5 per 10,000 API test runs and Checkly counts runs too, so a shorter interval or a second location raises the bill, while Hyperping, Better Stack, and UptimeRobot bill by monitor.
| Tool | Best for | Starting price | Main limitation |
|---|---|---|---|
| Hyperping | HTTP API checks, on-call, and a status page in one plan | Free; $24/mo | JSON and multi-step API checks need a Playwright check, 3 on Essentials |
| Checkly | Production API checks reviewed and deployed from Git | Free; Starter $24/mo | Billed per run; no on-call rotation |
| Postman | Collections you already have and don't want to rebuild | Free; Solo $9/mo | Monitor call quotas; no uptime or on-call |
| Datadog | Failed checks next to traces and logs you already collect | $5 per 10,000 API runs | Billed per run; on-call is a separate product |
| Grafana Cloud | People who already write k6 and run Grafana | Free; 100,000 API runs | You need to know Grafana |
| Better Stack | HTTP and API checks inside an incident workflow | Free; $29/responder/mo | Priced per responder; extras add up |
| UptimeRobot | Cheap availability checks with simple JSON assertions | Free; Solo $12/mo | No login-then-call checks; no on-call |
Why trust this guide
I'm Léo, founder of Hyperping. Yes, that means I have a stake in one of these tools. But I've watched teams pick competitors when they were the better fit, and I'm not going to pretend otherwise. My goal isn't to convince you Hyperping is always the answer. It's to help you understand which tool actually solves your problem.
I went through vendor docs, pricing pages, G2 reviews, Reddit threads in r/devops and r/sysadmin, and Hyperping customer interviews, in September 2026.
What is API monitoring?
API monitoring sends scheduled requests to your endpoints and checks that the result still looks right: the method and headers you expect, some form of auth, the body, and a latency threshold. Hyperping's default interval is 30 seconds because a cheap HTTP check catches a total outage faster than a browser journey, and it costs less to run often.
Most people run a lot of simple endpoint checks and keep multi-step API or browser checks for the few flows that make money. A /health check still belongs in that mix. The failures you care about:
- Complete outage: the host doesn't answer, or a health or version endpoint returns 5xx.
- False 200: the body is empty, stale, or missing a field. GraphQL often hides errors behind HTTP 200.
- Auth failure: an expired token or password makes the check fail even though the product is up.
- Latency: the endpoint answers correctly but slower than your SLO.
- Regional failure: one location fails while the others succeed.
- Broken write path: create, read, and cleanup, or a payment or search call, fails while
/healthstill passes. - Third-party dependency: an identity or billing API you call is down.
| Method | Traffic | Where it runs | What it's for | Where it misses |
|---|---|---|---|---|
| API monitoring | Scripted, scheduled | Production | Catch a broken endpoint before users report it | Flaky assertion or expired test credential |
| API testing | Scripted, on demand or CI | Staging or preview | Stop a broken change from shipping | Nothing runs after the deploy |
| APM | Real requests, instrumented | Production | Explain which service or query is slow | Blind to an outage that never reaches the process |
| API analytics | Real consumer traffic | Production | Usage and errors by customer | No signal when traffic is low |
A Postman collection can do testing and monitoring. What production monitoring adds is a schedule, locations in more than one region, retries, someone who owns the alert, evidence when it fails, and history you can still read next week.
What should an API monitor catch?
The endpoint returned 200 and the body was wrong
Status codes are the easy part. People want headers, latency, and a body check, including GraphQL errors that never change the HTTP code. Checkly, Postman, and Datadog assert on specific fields. Better Stack and UptimeRobot check JSON. Hyperping's HTTP monitors match text in the body, and its Playwright checks assert on JSON fields.
I already have this in Postman
If the collection is the source of truth, scheduled monitors that run those requests, scripts, and environments save you from rebuilding them somewhere else. Choosing more than one region is a paid-plan feature, according to Postman's docs.
I want the checks in Git
After a few dozen monitors, dashboard edits get lost. Checkly (TypeScript, a CLI, pull requests) and Grafana Cloud (k6) are the usual answers. Checkly is the name that comes up in this r/devops thread when the API is too awkward for a URL check.
The endpoint needs a login, then a token
A static bearer header breaks when the token expires. Checkly, Postman Monitors, Assertible, and Datadog can log in, store the token, and call a protected route in an API check. Hyperping does it in a Playwright check that only sends requests, with no page to render, and counts it against the browser-check quota. Setting it up takes time on any of them, and a May 2026 G2 reviewer called Datadog's multi-step tests time-consuming to configure.
A check failed and nobody got paged
A request builder doesn't page anyone or tell customers. Hyperping and Better Stack include on-call, escalation, and a status page. With Checkly or Postman you add PagerDuty and a status page product. Alma already runs Datadog, and its SRE keeps Hyperping because the outside check often pages them first.
I need to know next month's bill
Vendors bill monitors, runs, collection calls, or seats. On Datadog and Checkly, halving the interval or adding a location doubles the runs you pay for. Postman counts every request in a collection. On Hyperping, UptimeRobot, and Better Stack it's still one monitor. From an April 2026 G2 review of Datadog:
"Datadog is costly, and the expenses may increase quicker than you anticipate."
API monitoring capability comparison
The biggest split is whether a check can log in and pass a token, and what happens after it fails.
| Capability | Hyperping | Checkly | Postman | Datadog | Grafana Cloud | Better Stack | UptimeRobot |
|---|---|---|---|---|---|---|---|
| HTTP methods and headers | Yes | Yes | Yes | Yes | Yes | Yes | Yes |
| Body check | Text match; JSON in Playwright checks | Scripted and JSON-path | JavaScript pm.test |
Assertions per step | k6 script | JSON assertions | JSON field checks |
| Log in and pass a token | In a Playwright check | Yes | Yes | Yes | In a k6 script | Playwright checks | No |
| Public locations | 17 regions | 6 on Hobby and Starter, 22 on Team | Several; more than one on paid | Managed global locations | Grafana probes | Several regions | Four region groups |
| Private locations | No | Team and above | Enterprise | Yes, add-on | Self-hosted probes | Not documented | No |
| On-call and escalation | Yes | No | No | Separate On-Call product | Grafana alerting | Yes | Alerts, no rotation |
| Customer status page | Yes | Basic | Read-only monitor reports | Separate product | No | Yes | Yes |
API monitoring pricing compared
Some tools bill by monitor and others by run, call, or person on call, so the same ten checks cost very different amounts.
| Tool | Free plan | First paid plan | What it includes | Billed by | Watch out for |
|---|---|---|---|---|---|
| Hyperping | 20 monitors, 5 min, 1 status page | Essentials, $24/mo | 50 monitors at 30s, on-call, 3 browser checks, 3 seats | Plan | JSON and multi-step API checks use browser-check quota |
| Checkly | 10,000 API runs a month | Starter, $24/mo | 25,000 API runs, 3,000 browser runs, 3 users | Run | Extra API runs are $1.80 per 10,000 |
| Postman | 1,000 monitor calls a month | Solo, $9/mo | 10,000 monitor calls a month, one user | User and call | Every request in a collection is a call |
| Datadog | No; 14-day trial | API tests, $5 per 10,000 runs | Multistep API tests, managed locations | Run | On-Call is another $20 per seat |
| Grafana Cloud | 100,000 API executions a month | $5 per 10,000 API executions | k6 checks, Grafana dashboards and alerts | Execution | No status page or on-call rotation in the product |
| Better Stack | 10 monitors, 1 status page | Responder, $29/mo | Uptime, on-call, incidents, status page, unlimited phone and SMS | Person on call | Extra 50 monitors are $21/mo |
| UptimeRobot | 50 monitors, 5 min | Solo, $12/mo | 10 monitors at 60s, 3 status pages | Monitor | Solo has fewer monitors than Free |
What ten API checks cost
Take ten HTTP API checks, each running every five minutes from one location, for a 30-day month. That's 86,400 runs. This is my estimate from public pricing.
| Tool | Plan that covers it | Monthly cost | Note |
|---|---|---|---|
| Hyperping | Free, 20 monitors | $0, or $24 with on-call | Essentials adds on-call and 30-second checks |
| Checkly | Starter, 25,000 runs plus 7 blocks of 10,000 | About $37 | Team at $64 includes 100,000 runs |
| Postman | Solo, 10,000 calls plus 2 blocks of 50,000 | About $49 | Assumes one request per collection |
| Datadog | API tests at $5 per 10,000 runs | About $43 | A second location doubles it to about $86 |
| Grafana Cloud | Free, 100,000 executions | $0 | 13,600 executions to spare |
| Better Stack | Free, 10 monitors | $0, or $29 with on-call | Uses the whole free allowance |
| UptimeRobot | Free, 50 monitors | $0 | Solo at $12 for 60-second checks |
At five minutes, ten checks fit the free plans of Hyperping, Grafana Cloud, Better Stack, and UptimeRobot. The bills split once you want on-call or a faster check. Hyperping Essentials at $24 and Better Stack at $29 add a rotation for a flat price, while Datadog and Checkly bill every extra run: at a one-minute interval, the same ten checks are about $216/month on Datadog. A Postman collection with eight requests turns every monitor run into eight calls.
Hyperping: Best for API checks with on-call and status pages
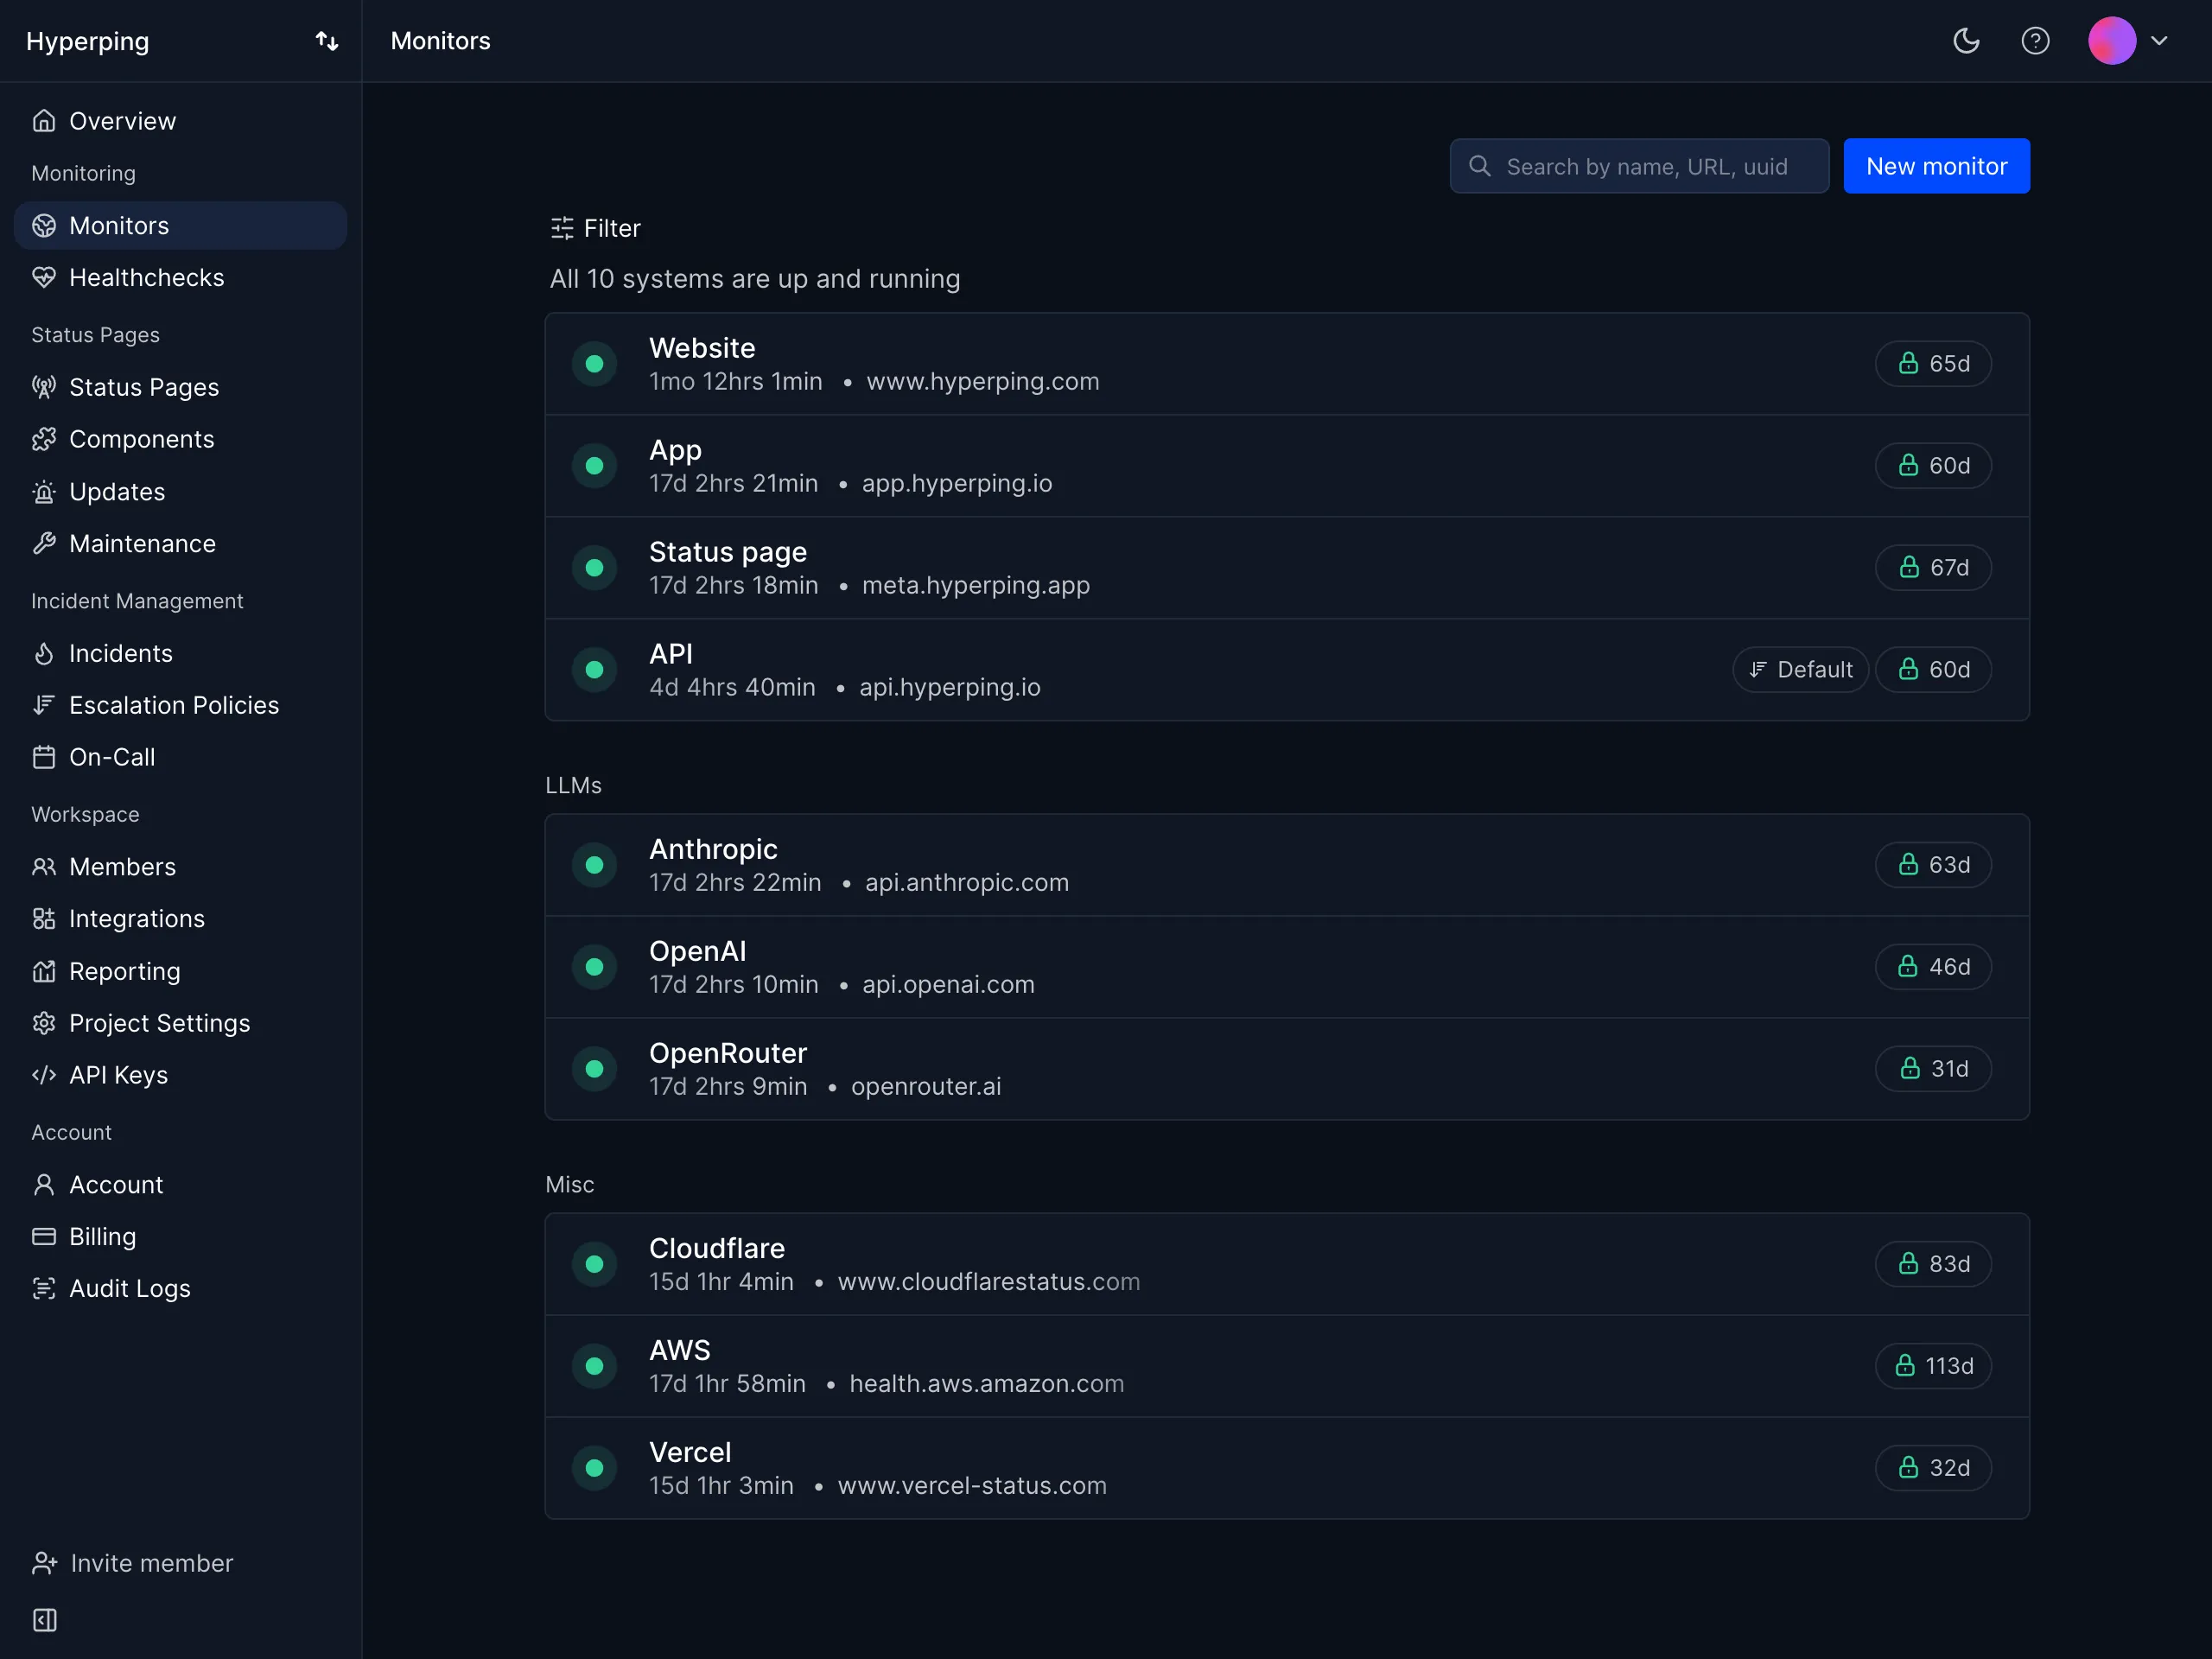
Hyperping combines HTTP and API monitors with uptime checks, Playwright browser checks, on-call schedules, escalation, incidents, and status pages. I built it for small SaaS companies that want a failed endpoint to reach the right person, then keep customers informed from the same product.
| Best for | Starting price | Main limitation |
|---|---|---|
| API checks that page a rotation and update customers | Free, then $24/mo | Multi-step API checks are code and count as browser checks |
Who Hyperping is built for
People who want frequent HTTP and API checks plus everything that follows a failure: retry, incident, on-call, escalation, and a status page. Usually a public API, a few authenticated reads, and a customer-facing status page, run by a handful of engineers who don't want to pay for PagerDuty and Statuspage on top.
Alma, a French fintech, already runs Datadog and keeps Hyperping as a second opinion from outside the cluster.
Notable features
- HTTP requests. Custom method, headers, and request body, with an expected status code and a text match on the body.
- 30-second checks. On Essentials and Pro, 20 seconds on Business, rotating through the regions you pick.
- Multi-region confirmation. A failure is confirmed from your other regions before an incident opens.
- Regions. 17 public regions, no private locations.
- On-call and escalation. Slack, SMS, or phone call to whoever is on the rotation.
- Status pages. Connected to the same monitors and included on every plan.
- API checks in code. A Playwright check can skip the browser and use Playwright's
requestfixture: log in, pass the token to the next call, and assert on JSON fields. The runtime shipsjsonwebtokenandcrypto-jsfor signed requests, and the API probe template is a starting point. - Browser checks. Playwright journeys for failures that only show up in a user flow, with a trace and a video of every failed run.
Why choose Hyperping for API monitoring?
On-call and a status page come with the check. A failed check retries, opens an incident, escalates if nobody acknowledges, and updates your status page. With Checkly or Postman, you'd add PagerDuty and a status page product to get there.
You pay for monitors, not runs. Ten API checks every five minutes from two locations are still ten monitors on Hyperping. On Datadog, the same schedule is about $86/month before any other Datadog product.
A failure is confirmed before anyone is paged. Hyperping re-runs a failed check from your other regions before it opens an incident, the same way it does for website checks. That matters when an API check is what wakes someone at 3am.
What users say
Alma runs Datadog and keeps Hyperping as an outside check. Their SRE, Fabrice Gregoire:
"Hyperping's reputation in our company is that it's more reactive than Datadog. We usually get notifications from Hyperping before Datadog."
"Datadog charges per check. You have a package, that's better. Pay per use is annoying and expensive."
"We made our Hyperping status page publicly available and it became a crucial part of our sales pitches."
How much does Hyperping cost?
- Free: 20 monitors, 5-minute checks, 1 hosted status page, email and Slack alerts
- Essentials: $24/month ($29 monthly) for 50 monitors, 30-second checks, 1 status page, 3 browser checks, 3 seats, on-call and escalation, phone call alerts
- Pro: $74/month ($89 monthly) for 250 monitors, 3 status pages, 10 browser checks, 10 seats
- Business: $249/month ($299 monthly) for 1,000 monitors, 20-second checks, 10 status pages, 25 browser checks, 20 seats
Every paid plan has a 14-day trial. Ten API checks every five minutes fit on Free, and Essentials at $24/month adds on-call and 30-second checks.
Where Hyperping falls short
We built HTTP monitors for availability and simple correctness: status codes, headers, and text in the body. JSON assertions and login-then-call need a Playwright check, which you write in code and which counts against the browser-check quota: 3 on Essentials, 10 on Pro, 25 on Business. That covers a few critical chains, not dozens of contract checks. There's no OpenAPI sync or Git workflow, where Checkly and Assertible are stronger, and no form to build JSON assertions without code. If the API is only reachable inside a VPC, we don't offer a private location today, and Datadog and Checkly do. If a failed check needs its trace next to it, that's Datadog.
Is Hyperping right for you?
Pick Hyperping if you want frequent API checks with the on-call rotation and status page already attached. Look elsewhere if you need a large monitoring-as-code suite, Postman collection reuse, or dozens of multi-step API checks.
Checkly: Best for API monitoring as code
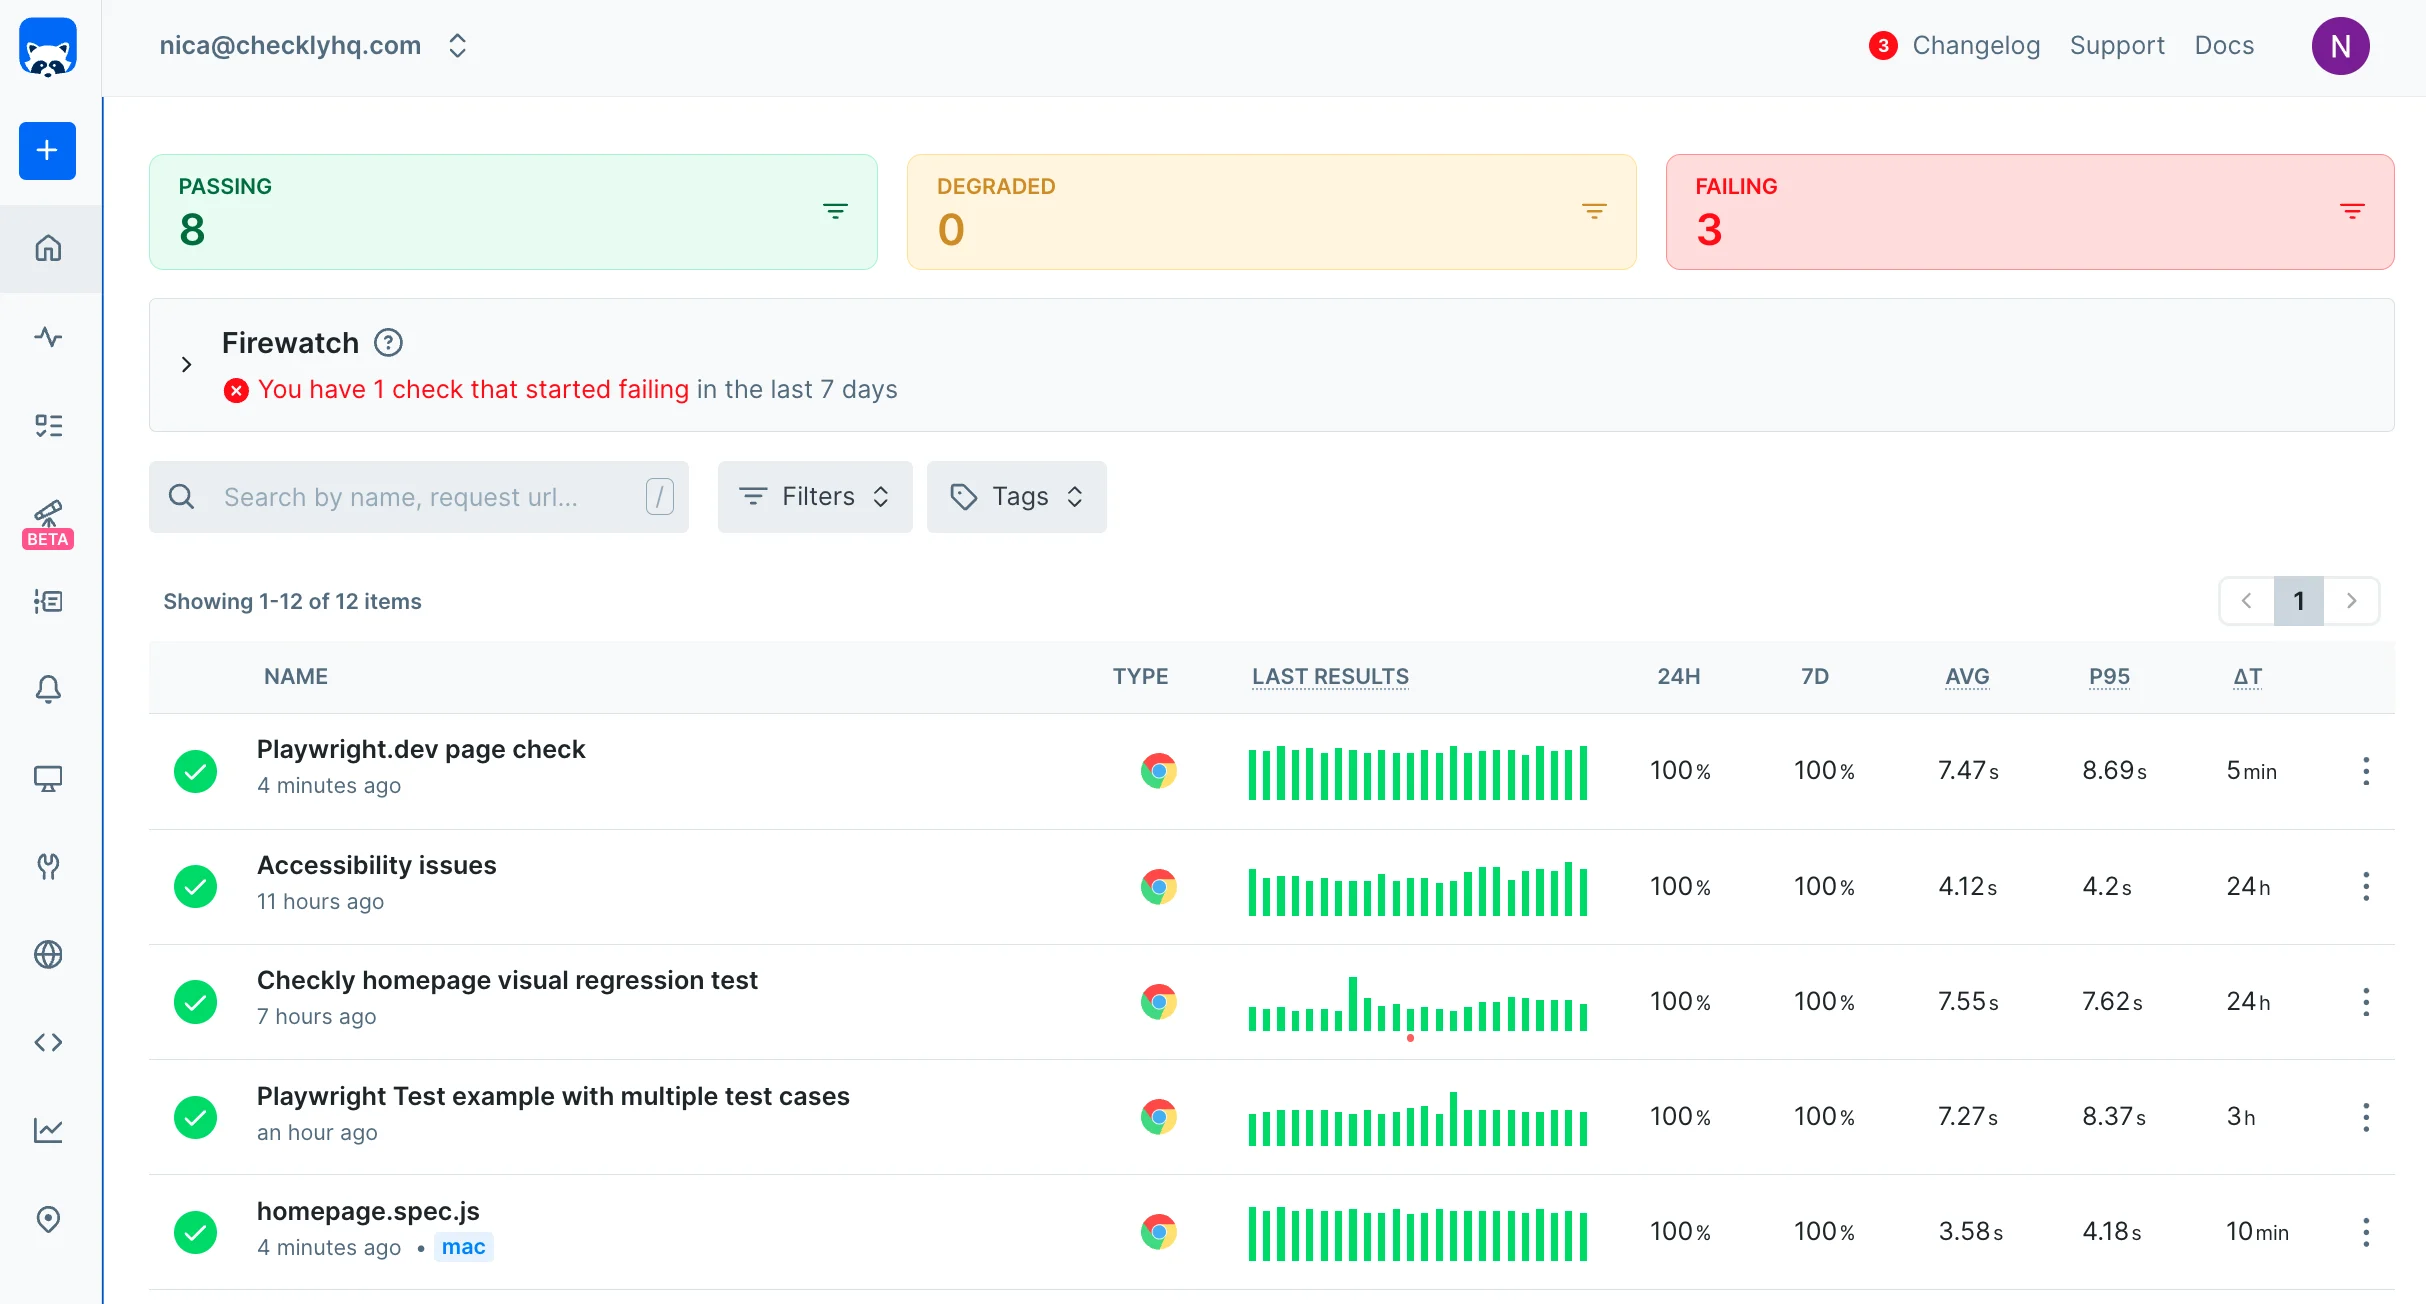
Checkly is the one I point engineers to when they want production API checks reviewed and deployed like application code. The free Hobby plan includes 10,000 API runs a month.
| Best for | Starting price | Main limitation |
|---|---|---|
| Developer-owned API checks in Git | Free; Starter $24/mo | Billed per run; no on-call rotation |
Who Checkly is built for
Developers who already review tests in Git and don't want monitors that only exist in a dashboard. Usually TypeScript, a CLI in CI, and a mix of API checks and Playwright browser checks. If non-engineers need to create monitors from a form, they'll struggle.
This r/devops thread is the typical trigger: the API is too awkward for a URL check, and Checkly is the name that comes up.
Notable features
- Checks as code. TypeScript or JavaScript, versioned in Git and deployed with a CLI.
- Assertions. Status, latency, headers, and JSON paths in the body.
- Multi-step API checks. Variables passed between requests, so a login can feed the next call.
- Locations. 6 on Hobby and Starter with up to 3 per check, all 22 on Team.
- Private locations. On Team and above, for APIs inside your network.
- 10-second checks. On Team and above.
- Browser checks. Playwright, in the same product.
- Status pages. Basic pages, sold as a separate module.
Why choose Checkly for API monitoring?
The checks live in Git. Hyperping monitors are built in a form, and UptimeRobot's JSON checks live in its dashboard. When you have dozens of Checkly checks, Git history tells you which version is running and who changed it.
It handles login-then-call without a browser. Checkly API checks can log in, store the token, and call a protected route, billed as ordinary API runs. Hyperping does it in Playwright checks, which are capped by plan, and Postman only makes sense if the collection already exists.
You can start free. Hobby includes 10,000 API runs a month, which is enough to try it or run a small, slow suite. Starter at $24/month includes 25,000.
What users say
Reviewers mostly talk about the Git workflow. From an August 2025 G2 review:
"What I like best about Checkly is its "monitoring-as-code" approach, which fits perfectly into modern CI/CD workflows. The ability to write API and browser checks in JavaScript/TypeScript using Playwright, commit them to Git, and run them globally is a game-changer."
How much does Checkly cost?
- Hobby: free, 10,000 API runs and 1,000 browser runs a month, 1 user
- Starter: $24/month ($29 monthly), 25,000 API runs, 3,000 browser runs, 3 users
- Team: $64/month ($80 monthly), 100,000 API runs, 12,000 browser runs, 22 locations, private locations, 10 users
- Extra API runs: $1.80 per 10,000 on Starter and Team
Status pages and AI root cause analysis are separate modules. Ten API checks every five minutes use 86,400 runs, so Starter needs seven extra blocks, about $37/month. Plain URL checks can use Checkly's uptime monitors instead, which don't count against API runs: 10 on Hobby and 50 on Starter.
Where Checkly falls short
The bill grows with frequency and locations. Checkly sends alerts, including SMS on Starter and phone calls on Team, but it has no on-call rotation or escalation, and its status pages are basic. Pair it with PagerDuty, or use Hyperping or Better Stack if the on-call side is why you're shopping. Non-engineers who want to add a monitor from a form will be happier on Hyperping or UptimeRobot.
Is Checkly right for you?
Pick Checkly if developers own the monitors and Git review matters. Look elsewhere if non-engineers need a form, or if you want on-call and customer status pages in the same purchase.
Postman: Best for monitoring collections you already have
Postman Monitors turn collections you already run in development into scheduled production checks. Solo starts at $9/month.
| Best for | Starting price | Main limitation |
|---|---|---|
| People whose API work already lives in Postman | Free; Solo $9/mo | Call quotas; no uptime or on-call |
Who Postman is built for
API developers whose docs, contract tests, and onboarding already live in Postman. You already run the collection locally, and Monitors pages you when it breaks in production. If nobody on your side opens Postman, skip it.
Notable features
- Collection reuse. The same requests, scripts, and environments you already maintain.
- Chained requests. Log in, extract a token, call a protected route, and assert in
pm.test. - Regions. Postman-hosted regions, with more than one per monitor on paid plans.
- Private runners. On Enterprise, for monitors inside your network.
- Monitor calls. 1,000 a month on Free, 10,000 on paid plans.
- Monitor reports. Public, read-only pages of monitor results, not a status page with incidents.
Why choose Postman for API monitoring?
You don't rebuild the collection. If the requests already live in Postman, Monitors is the shortest path. Checkly would have you rewrite them in TypeScript, and Hyperping would have you recreate them in a form.
The auth flow is already written. If the collection logs in and passes a JWT, the monitor runs the same steps. A static bearer header in UptimeRobot breaks when the token expires.
Solo is cheap to start. $9/month gets you 10,000 monitor calls a month. Long collections use them up fast.
What users say
Most of what people say about Postman is about the API client, and some say it isn't the right tool for monitoring. From a December 2025 r/webdev thread asking whether people use Postman to monitor their APIs:
"But for monitoring these are not the tools you want, they're mostly useful for testing."
How much does Postman cost?
- Free: 1,000 monitor calls a month, one user
- Solo: $9/month ($12 monthly), 10,000 monitor calls a month, one user
- Team: $19 per user/month ($23 monthly), 10,000 monitor calls a month per team
- Enterprise: $49 per user/month, private runners
Extra monitor calls are $20 per 50,000 a month on Postman's pricing page. Ten one-request monitors every five minutes make 86,400 calls, so Solo needs two extra blocks, about $49/month. A collection with eight requests uses calls eight times faster.
Where Postman falls short
Monitors only run API tests. You'll still need Hyperping, Better Stack, or UptimeRobot for SSL, status pages, and on-call. There's no Git workflow like Checkly's unless you already treat collections as the source of truth and run Newman in CI. Private runners for internal APIs are Enterprise only, where Checkly has them on Team.
Is Postman right for you?
Pick Postman if the collection is already the source of truth. Look elsewhere if you need on-call and a status page with the check, or if you want monitors written as code in Git.
Datadog: Best for synthetic checks connected to observability data

Datadog Synthetic Monitoring is the one to pick when you already use Datadog for APM, logs, infrastructure, or RUM. API tests cost $5 per 10,000 runs.
| Best for | Starting price | Main limitation |
|---|---|---|
| Existing Datadog customers with complex services | $5 per 10,000 API runs | Cost grows with frequency, locations, and other products |
Who Datadog is built for
Companies that already have a Datadog contract, whose responders live in Datadog during incidents. Synthetics are worth paying per run when a failed check needs the trace, log line, or RUM session next to it. If synthetics would be the only Datadog product you use, look at the others first.
Notable features
- Multistep API tests. Assertions on status, body, headers, and latency, with variables extracted between steps.
- Managed locations. Global public locations, plus private locations as an add-on for staging or VPC APIs.
- Correlation. A failed check opens next to the related traces and logs.
- Authoring. A recorder in the UI as well as code.
- On-Call. A separate product at $20 per seat.
- Billing. Per run, so frequency and locations multiply the cost.
Why choose Datadog for API monitoring?
You can go from the failed check to the trace. If most of your API incidents need a trace to explain them, a standalone checker means opening Datadog anyway. Hyperping, Checkly, and UptimeRobot don't link a failure to your traces.
Private locations cover internal APIs. Hyperping and UptimeRobot don't offer private locations. Checkly does on Team and above, and Postman only on Enterprise.
You're probably paying for the rest already. Adding API tests to an existing Datadog contract is a smaller decision than bringing in a second vendor, though it still costs more than ten Hyperping monitors.
What users say
Reviewers complain about cost and about how long multi-step tests take to set up. From a May 2026 G2 review:
"Configuring complex multi-step Synthetic Monitoring tests can be time-consuming, and the web UI occasionally feels sluggish when navigating through large, data-heavy dashboards during critical debugging sessions."
People in an r/devops thread say the same about the price.
How much does Datadog cost?
From Datadog's pricing list:
- Synthetic API tests: $5 per 10,000 runs, $6 month to month, $7.20 on demand
- Synthetic browser tests: $12 per 1,000 runs
- On-Call: $20 per seat/month
- Trial: 14 days
APM, logs, and infrastructure are billed separately. Ten API checks every five minutes from one location cost about $43/month, and about $86 from two.
Where Datadog falls short
Per-run billing gets expensive for frequent multi-step checks. On-call and customer status pages are separate Datadog products, or a second vendor. Reviews mention how complex the platform is almost as often as its price. Hyperping is cheaper for checks from the outside with on-call included, and Checkly is cheaper if you want the checks in Git.
Is Datadog right for you?
Pick Datadog if your responders already live in Datadog and failed checks usually need a trace. Look elsewhere if synthetics are the only Datadog product you'd use.
Grafana Cloud: Best for k6 and Grafana users
Grafana Cloud Synthetic Monitoring is the right pick if you already write k6 scripts or run Grafana dashboards. The free tier includes 100,000 API executions a month.
| Best for | Starting price | Main limitation |
|---|---|---|
| Grafana and k6 users | Free tier | No recorder; you need to know Grafana |
Who Grafana Cloud is built for
Platform engineers and SREs who already run Grafana, Prometheus, and k6. You have the scripts, so you put them on a schedule and alert in Grafana. If you're starting with no k6 at all, you'll spend the trial learning Grafana instead of covering endpoints.
Notable features
- k6 scripts. HTTP, TCP, DNS, ICMP, and browser checks.
- Free tier. 100,000 API executions and 10,000 browser executions a month.
- Grafana dashboards and alerting. Results land where you already look.
- Self-hosted probes. Run checks from locations you control.
- Authoring. Code only, with no recorder.
- Response. No status page or on-call rotation in the synthetic product.
Why choose Grafana Cloud for API monitoring?
You can reuse k6. If you already write k6 for load tests, you can schedule those scripts instead of learning Checkly's CLI or rebuilding the requests in Postman.
Ten five-minute checks are free. 86,400 runs a month fit under the 100,000 free API executions. Datadog charges about $43 for the same schedule.
You can run your own probes. Private probes take more work than Datadog's private locations, and you decide exactly where they run.
What users say
The complaint on Reddit is price once you go past the free tier. From a September 2026 r/sysadmin thread:
"Synthetic monitoring in Grafana cloud is very expensive for what you get imo."
Another reply in the same thread:
"I use Grafana Cloud for lots of stuff but their synthetics are very expensive, I only have 1 setup for external in Checks of our routing stack."
How much does Grafana Cloud cost?
From the synthetic monitoring and pricing pages:
- Free: 100,000 API executions and 10,000 browser executions a month
- Pay as you go: $5 per 10,000 API executions and $50 per 10,000 browser executions past the free tier
Ten checks every five minutes from one location cost $0.
Where Grafana Cloud falls short
There's no recorder, and no customer status page or on-call rotation in the same purchase. Hyperping and Better Stack cover that side. Checkly is a more focused Git workflow if you aren't already a Grafana shop. Investigating a failure can mean Grafana plus Loki and Tempo rather than one screen built for synthetic checks.
Is Grafana Cloud right for you?
Pick Grafana Cloud if k6 and Grafana are already how you work. Look elsewhere if you want a status page and on-call rotation in the same purchase.
Better Stack: Best for API checks inside an incident workflow
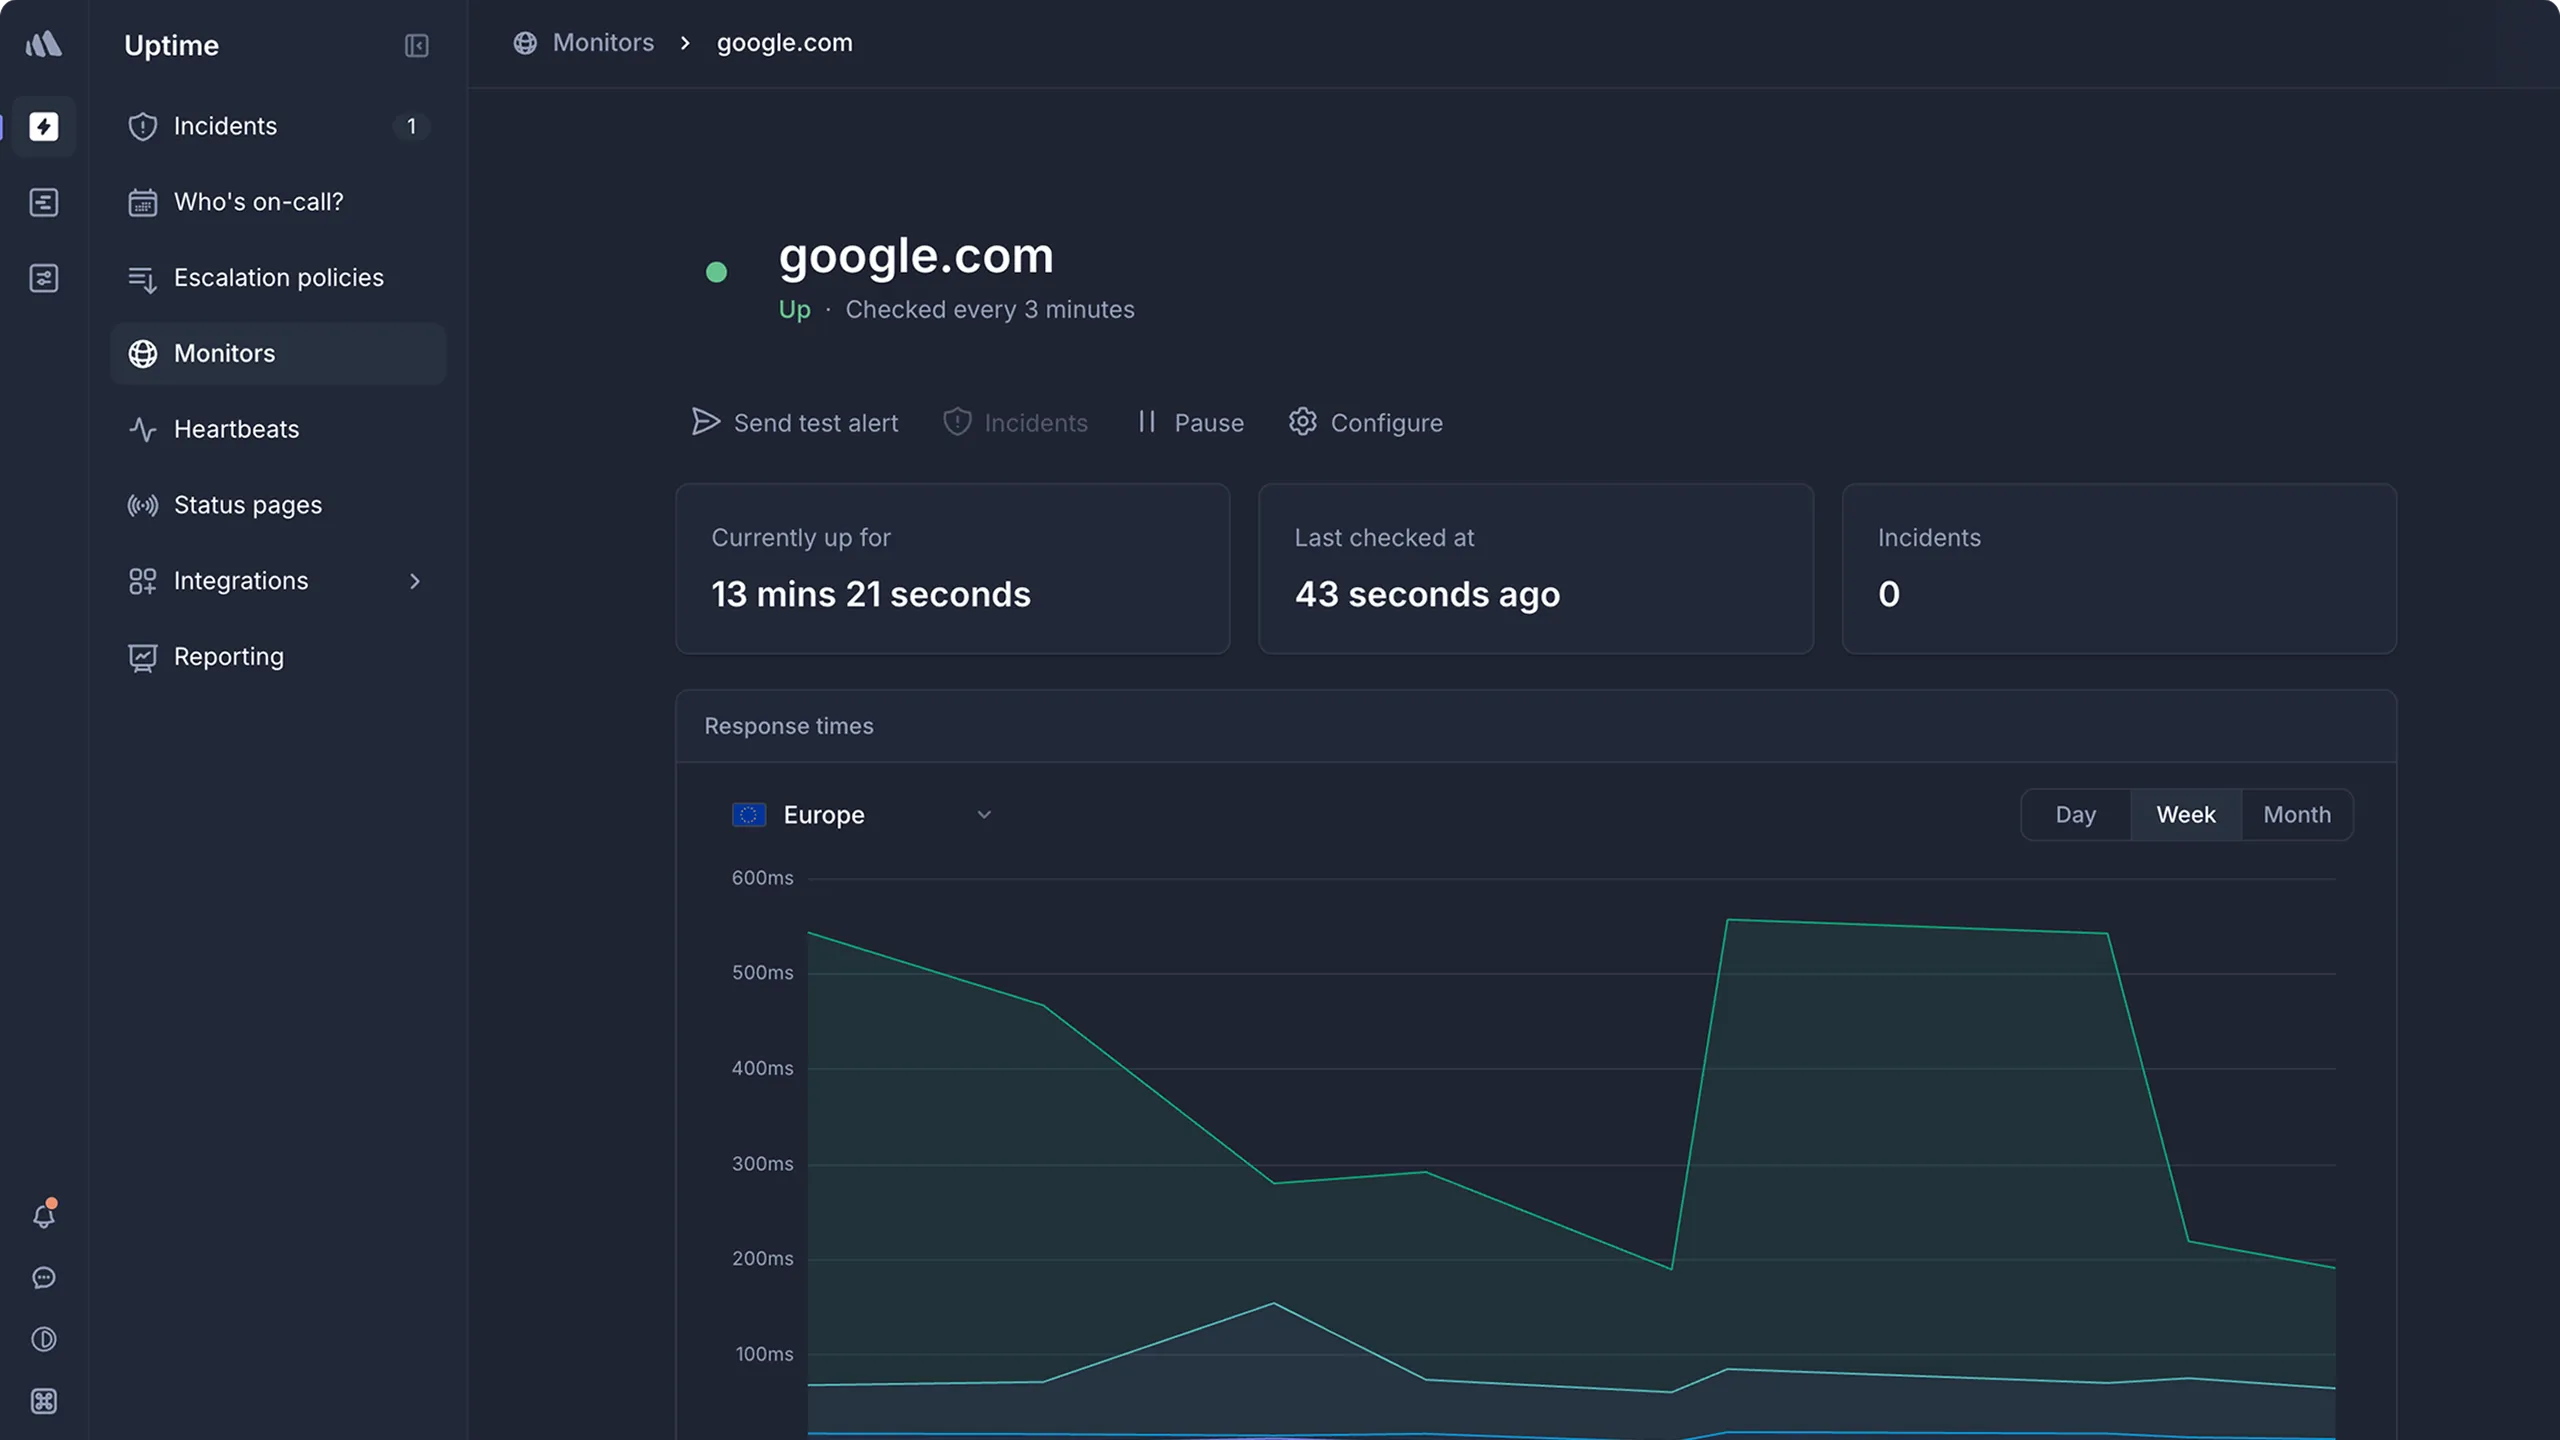
Better Stack puts HTTP and API checks next to on-call, incidents, logs, and status pages. Responder seats start at $29/month.
| Best for | Starting price | Main limitation |
|---|---|---|
| Startups that want monitoring and on-call together | Free; $29/responder/mo | Priced per responder; API depth thinner than Checkly |
Who Better Stack is built for
Startups that want the check, the page, the incident timeline, and the logs from one vendor, usually because they're tired of wiring UptimeRobot to PagerDuty to a status page. In a February 2025 r/devops thread comparing Hyperping, Better Stack, and OneUptime, people praised Better Stack's support, logging, API, and Terraform provider, and told the poster to test the browser monitoring before counting on it. If you already run PagerDuty and only need a checker, you'll overbuy.
Notable features
- HTTP and API checks. JSON assertions on the response body.
- Monitors. 10 included, then $21/month for each extra 50.
- On-call. Schedules, escalation, phone, SMS, push, and email, with unlimited phone and SMS for responders.
- Incidents. Slack and Teams workflows, timelines, and post-mortems.
- Status pages. Public and private, with subscriber notifications.
- Logs and traces. In the same product, billed by volume.
- Playwright checks. $1 per 100 minutes of browser time.
- Terraform and REST API. For managing monitors as code.
Why choose Better Stack for API monitoring?
Incidents, on-call, and logs sit next to the check. Hyperping also bundles on-call and status pages. Better Stack adds logs, traces, and a deeper Slack and Teams incident workflow.
One responder seat covers the basics. The $29 Responder plan,, includes uptime, on-call, incidents, and a status page. Hyperping Essentials is $24/month with 3 seats, and doesn't charge per responder.
The body check reads JSON. Better Stack's JSON assertions go further than Hyperping's text match, and not as far as Checkly's scripted assertions.
What users say
Reviewers like having everything in one place. From an August 2026 G2 review:
"I love using Better Stack for logging, telemetry, and alerting. It's been great for unifying data from our multiple services."
Price is the usual complaint, especially from small companies. From a March 2026 G2 review:
"The pricing can feel a bit high for small teams or individual developers. Also, some of the more advanced features and configuration options come with a learning curve."
How much does Better Stack cost?
- Free: 10 monitors and heartbeats, 1 status page, Slack and email alerts
- Responder: $29 per user/month ($34 monthly), with uptime, incidents, on-call, status pages, and unlimited phone and SMS
- Extra monitors: $21/month for each 50
- Extra public status page: $12/month
- Status page extras: white-label, SSO, and IP allowlisting are $208 per page/month
Ten API checks fit the free plan's 10 monitors. With on-call, it's one Responder seat at $29/month.
Where Better Stack falls short
The price grows with every responder and every status page extra, which makes it harder to predict than Hyperping's plans. Multi-step API checks are thinner than in Checkly, Postman, or Datadog. White-label, SSO, and IP allowlisting on a status page cost $208 each per page, while Hyperping Business includes white-labeling and IP allowlisting at $249/month. If you already run PagerDuty and only need a checker, UptimeRobot is cheaper.
Is Better Stack right for you?
Pick Better Stack if incident management is why you're shopping and you want logs next to the check. Look elsewhere if you already run PagerDuty and only need a checker, or if API contracts in Git are the real job.
UptimeRobot: Best for inexpensive API availability
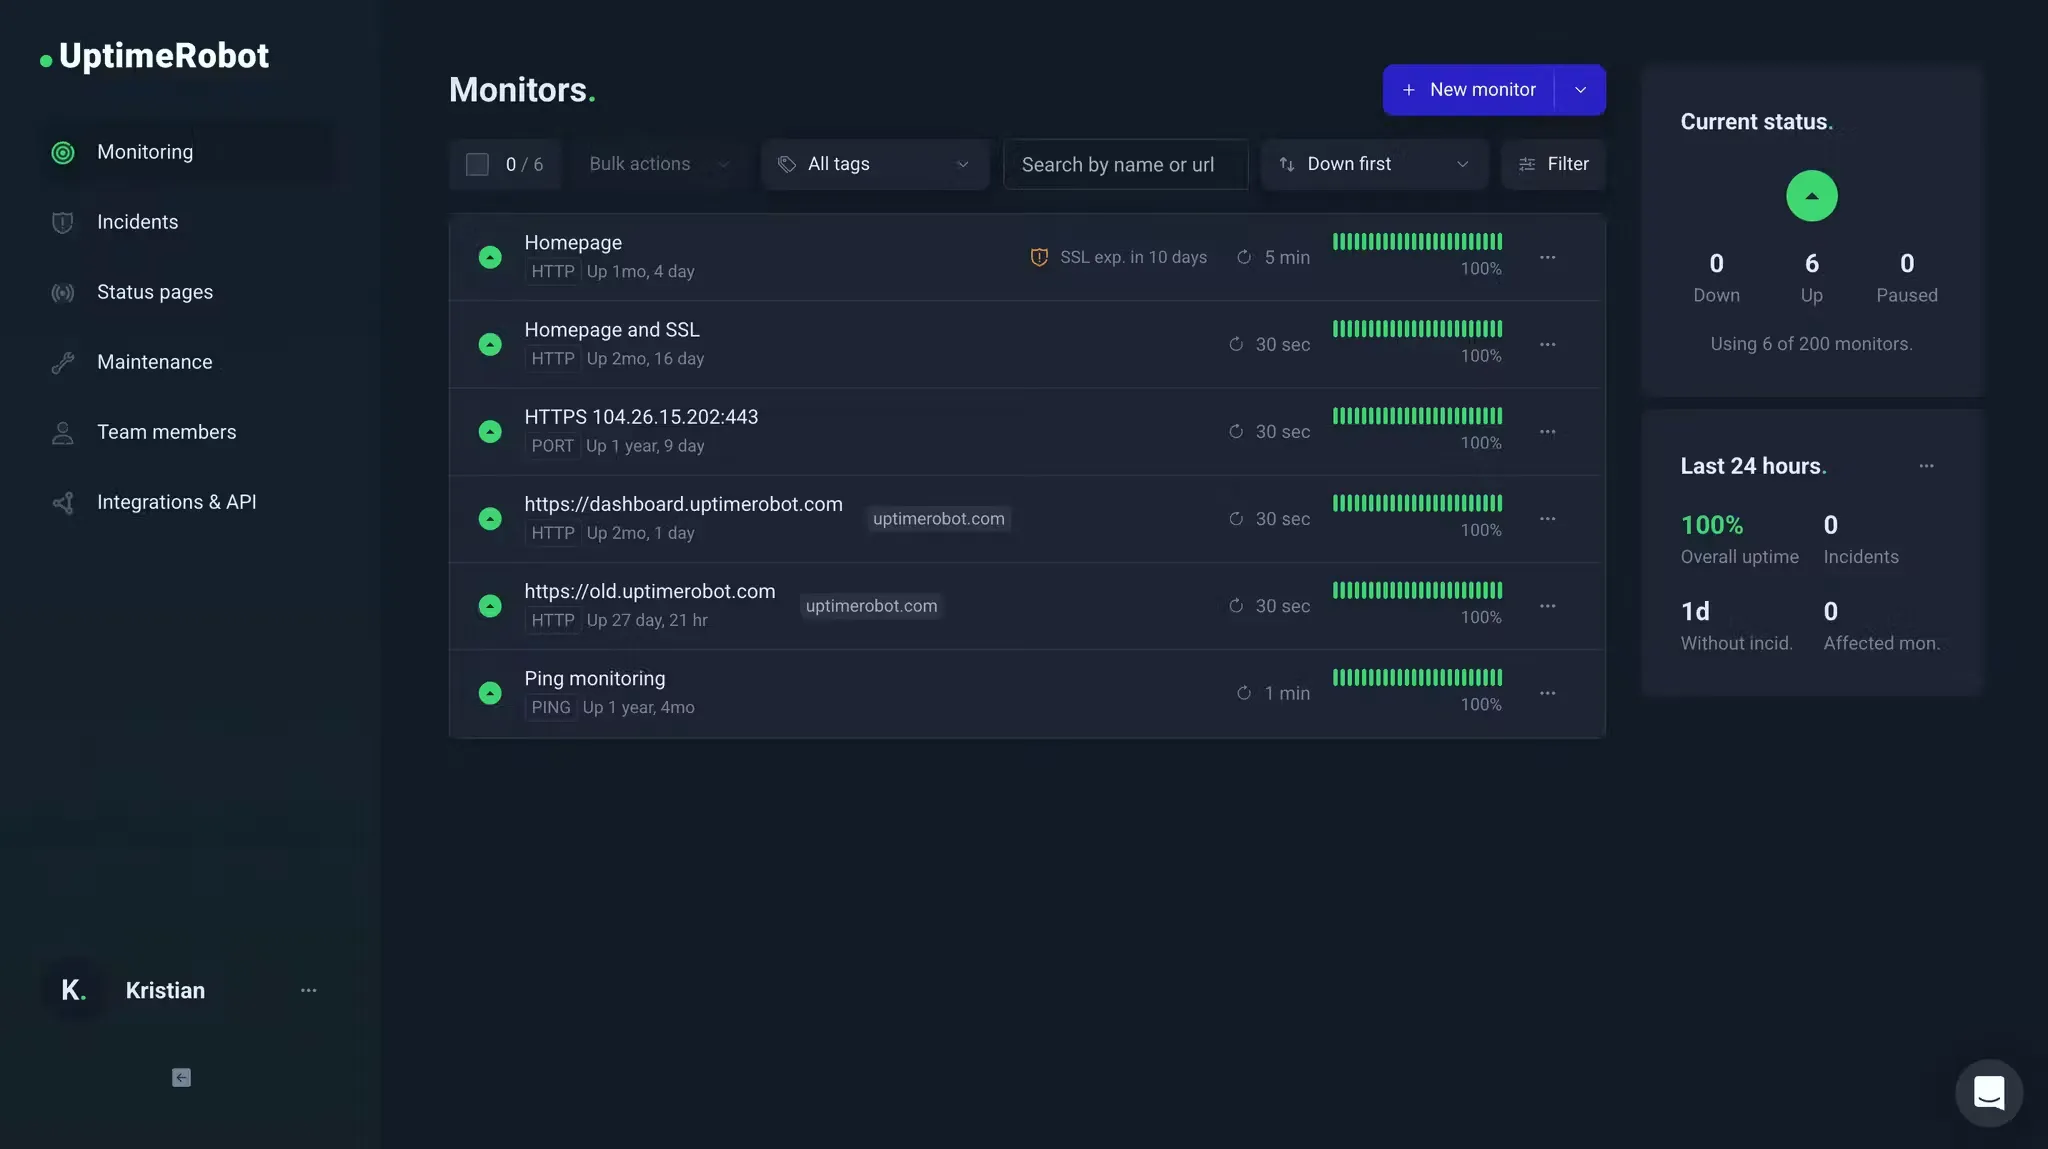
UptimeRobot has the biggest free plan here, 50 monitors at 5-minute intervals, with simple HTTP and API checks. Paid plans start with Solo at $12/month.
| Best for | Starting price | Main limitation |
|---|---|---|
| Solo developers and small agencies | Free; Solo $12/mo | Keyword and JSON field checks, no login-then-call |
Who UptimeRobot is built for
Solo developers, small companies, and agencies that need many endpoints watched and can live with simpler checks. Usually 30 URLs and a JSON health endpoint, with nobody on call. If the API contract is the product, it doesn't go deep enough.
Notable features
- Free plan. 50 monitors at 5-minute intervals.
- API monitors. JSON field checks, plus keyword and status code checks.
- Intervals. 60 seconds on Solo, 30 seconds on Team, 15 seconds on Scale.
- Status pages. 1 on Free, 3 on Solo, 100 on Team.
- Alerts. Email, mobile app, Slack, webhooks, and PagerDuty, depending on the plan.
- On-call. No schedules or escalation, so you still own the rotation.
- Locations. Public only, no private locations.
Why choose UptimeRobot for API monitoring?
50 free monitors. Hyperping's free plan has 20. For a pile of cheap availability checks, that's why people start here.
JSON field checks on API monitors. It won't log in and pass a token like Checkly or Postman, but for a public health endpoint it's often enough.
100 status pages on Team. Team is $39/month. Hyperping's self-serve plans stop at 10 status pages, so if you need many public pages and nobody on call, UptimeRobot gives you more.
What users say
People mostly praise how easy it is to set up. From a July 2026 G2 review:
"I like that UptimeRobot is very intuitive and very easy to set up. It gives me timely email notifications and also the weekly summaries."
Plan changes are the complaint. In a July 2025 r/selfhosted thread, a long-time user was being moved off an $8 legacy plan toward a $34 Team plan.
How much does UptimeRobot cost?
- Free: 50 monitors, 5-minute checks, 1 basic status page
- Solo: $12/month ($13 monthly) for 10 monitors, 60-second checks, 3 status pages
- Team: $39/month ($46 monthly) for 100 monitors, 30-second checks, 100 status pages
- Scale: $83/month ($98 monthly) for 200 monitors, 15-second checks
Ten checks every five minutes fit the free plan. For 60-second checks, Solo covers exactly ten at $12/month.
Where UptimeRobot falls short
Auth is static headers, so it can't log in and then call a protected route. There's no on-call rotation or escalation. Checkly, Postman, and Datadog cover the API contract, and Hyperping and Better Stack cover on-call and incidents.
Is UptimeRobot right for you?
Pick UptimeRobot if you need many cheap checks and can live with simpler assertions. Look elsewhere if the API contract is the product, or if a failed check should page a rotation and update customers.
Head-to-head
Checkly vs Postman Monitors
Both can log in, pass a token, and assert on the body. Checkly keeps checks as TypeScript in Git and deploys them with a CLI, and Postman runs the collections you already maintain. Checkly bills API runs (10,000 free, 25,000 on Starter at $24/month), and Postman bills monitor calls, counting every request in a collection (1,000 free, 10,000 on Solo at $9/month). Pick Postman if the collection is already the source of truth and nobody wants to rewrite it, and Checkly if you're starting fresh or want every monitor change reviewed in a pull request.
Checkly vs Datadog Synthetics
Both bill per run, do multi-step API checks, and offer private locations. Datadog puts the failed check next to traces and logs at $5 per 10,000 runs. Checkly is cheaper for the same schedule, about $37/month for this guide's ten checks against Datadog's $43, and it keeps the checks in Git. Pick Datadog if your responders already live in Datadog, and Checkly if you want monitoring as code and don't need APM beside it.
Hyperping vs Better Stack
Both put the check, on-call, and a status page in one product. Hyperping Essentials is $24/month for 50 monitors and 3 seats. Better Stack charges $29 per responder with 10 monitors included and $21 for each extra 50, so two people on call already cost $58/month before extra monitors. Better Stack adds logs, traces, and Slack incident workflows. Both handle login-then-call only through Playwright checks. Pick Hyperping for a flat price with several people on the rotation, and Better Stack if you want your logs in the same place as the alert.
Do I need API monitoring or API testing?
API testing (Postman collections, a CI suite, Assertible after deploys) stops a broken change from shipping. API monitoring runs checks against production on a schedule, from several regions, and pages someone when a live endpoint breaks. Most people need both: tests in CI, and monitors on the endpoints customers depend on. Postman Monitors is the shortest path from one to the other if your tests already live in Postman.
Which one should you pick?
| Buyer or situation | Recommended tool | Reason |
|---|---|---|
| SaaS company that wants checks, on-call, and a status page | Hyperping | One plan covers it; Essentials is $24/mo |
| Engineers who want monitors in Git | Checkly | CLI, TypeScript, CI/CD, 10,000 API runs free |
| Your collections already live in Postman | Postman Monitors | Least new work; add something for on-call and status |
| Already on Datadog | Datadog Synthetics | Failed checks sit next to traces; about $43/mo for ten checks |
| Already on Grafana and k6 | Grafana Cloud | Reuse scripts; ten five-minute checks fit the free tier |
| Startup that wants incidents and logs in Slack | Better Stack | On-call and incidents included; logs if you need them |
| Tight budget, simple endpoints | UptimeRobot | 50 free monitors with JSON field checks |
| JSON-path contracts and deploy smoke tests only | Assertible | Focused API tester, listed below |
If you're spending nothing, ten five-minute checks fit the free plans of Hyperping, Grafana Cloud, Better Stack, and UptimeRobot. The first thing worth paying for is usually on-call: Hyperping Essentials includes it for 3 people at $24/month, and Better Stack charges $29 per responder. If you need one-minute checks on many endpoints, stay away from per-run billing unless the trace correlation is worth it.
Start with what you already run. Postman users can turn a collection into a monitor, Datadog customers get checks next to their traces, and Grafana users can schedule k6 scripts they already have. If you already pay for PagerDuty, you don't need on-call from the monitor, so Checkly or UptimeRobot sending alerts to PagerDuty is a reasonable setup.
Other credible options
API analytics, API security, gateways, and self-hosted probes are here because they solve a related but different job. Assertible is the one to look at if the only job is JSON-path contracts: Standard is $25/month.
Focused API test and monitor products
| Tool | Main strength | Main limitation | Good for |
|---|---|---|---|
| Assertible | JSON-path, schema, OpenAPI sync, GitHub deploys | No uptime or status page; $25/mo Standard | Contract tests after every deploy |
| APIContext (APImetrics) | 125+ locations, OAuth, mTLS, FAPI | Few independent reviews | APIs with strict auth requirements |
| SmartBear AlertSite | OpenAPI and SoapUI reuse | Quote-based enterprise purchase | Companies already on SmartBear |
| BlazeMeter API Monitoring (Runscope) | Long-running API monitor | Now part of BlazeMeter | Former Runscope users |
| Sematext Synthetics | HTTP monitors plus private locations | Few independent reviews | People already on Sematext |
| LoadFocus | API checks plus load testing | Load testing is the main product | People who also load-test their API |
Uptime and reliability bundles
| Tool | Main strength | Main limitation | Good for |
|---|---|---|---|
| Site24x7 | Multi-step API transactions inside a wide platform | Learning curve | People who want servers and APIs in one suite |
| Xitoring | Cheap bundle with body checks and cURL import | Few independent reviews | Small budgets that still need body checks |
| Oh Dear | HTTP and API assertions, EU hosting | Billed per site | Agencies checking client sites |
| Pingdom | Mature reporting | Dated product, no free plan | Companies already on SolarWinds |
| Uptime.com | Many locations and private locations | Enterprise pricing | Larger websites with SLA reports |
| StatusCake | EU and UK data residency | Not built for deep API checks | Cheap basic uptime checks |
| Uptrends | Large location network | Credit-based pricing | Enterprise synthetic monitoring |
| Dotcom-Monitor | REST, SOAP, GraphQL, and gRPC checks | Few third-party reviews | People monitoring SOAP or gRPC APIs |
| Catchpoint / LogicMonitor | Global agent network | Enterprise procurement | Network reliability engineers |
Observability platforms
| Tool | Main strength | Main limitation | Good for |
|---|---|---|---|
| New Relic Synthetics | Checks next to APM | Usage-based bill | Companies already on New Relic |
| Dynatrace | AI correlation | Cost and footprint | Companies already on Dynatrace |
| Splunk Synthetics | Checks next to Splunk logs | Heavy platform | Companies already on Splunk |
Open source and related jobs
| Tool | Main strength | Main limitation | Good for |
|---|---|---|---|
| Prometheus + Blackbox Exporter | Free HTTP and TLS probes | You run the stack | People already on Prometheus |
| Uptime Kuma | Free self-hosted interface | One location unless you run several | Homelabs and small setups |
| OneUptime | Open-source synthetics plus on-call | Mixed independent reviews | Self-hosters who want on-call |
| Moesif | API product analytics | Doesn't send synthetic checks | API businesses tracking usage |
| Treblle | SDK-based API observability | Needs instrumentation | Developers debugging live traffic |
I left out Levo, Akto, Traceable, Rapid7, and Qualys because they're API security products, and IBM API Connect, DigitalAPI, Apigee, and Kong because they're gateways. Kibana, Graphite, and PRTG aren't dedicated API monitors, and Rohitab API Monitor is a Windows desktop tracer.
How to test API monitoring tools
Every tool on the shortlist has a free plan or a trial:
- Hyperping: 20 monitors on the free plan, plus a 14-day trial of paid plans
- Checkly: 10,000 API runs a month on the free Hobby plan, no card
- Postman: 1,000 monitor calls a month on the free plan
- Datadog: 14-day trial
- Grafana Cloud: 100,000 API executions a month on the free tier
- Better Stack: 10 monitors and 1 status page on the free plan
- UptimeRobot: 50 monitors at 5-minute intervals on the free plan
A green /health check won't tell you much. Break things on purpose:
- Create three checks: a public health endpoint, an authenticated read, and one revenue path. Give each a named owner.
- Return HTTP 200 with a broken body, and confirm the tool alerts on the content, not only the status code.
- Expire the token or password, and see whether the alert reads as an auth problem or a product outage.
- Run the same check from two or more locations, then block one region. See whether the alert separates a regional failure from a global one.
- If the tool supports multi-step flows, chain login, create, verify, and delete, and confirm the test data gets cleaned up.
- Ignore an alert. Check who gets it, whether it escalates, and how acknowledging stops the paging.
- Price your exact schedule: checks times daily runs, locations, collection length, and seats. A $24/month plan that replaces a checker, PagerDuty, and a status page often costs less than the cheapest checker plus the other two.
- Change a shared environment variable or collection. Count how many monitors break, and whether the change could have been reviewed first.
Give every monitor an owner and its own test account. A check nobody trusts gets muted, whatever product runs it.
Related reading
- What API monitoring means: Hyperping's definition of the category
- Best synthetic monitoring tools: browser journeys for advanced checks
- Hyperping pricing: monitors, status pages, and seats by plan
FAQ
What are the best API monitoring tools? ▼
The best API monitoring tools are Hyperping for HTTP and API checks with on-call and status pages, Checkly for API monitoring as code, Postman Monitors if your requests already live in Postman collections, Datadog for connecting failed checks to traces and logs, Grafana Cloud if you already write k6, Better Stack for checks inside an incident workflow, and UptimeRobot for inexpensive availability checks.
What is API monitoring? ▼
API monitoring runs scheduled requests against your endpoints and checks that the result matches what you expect. A useful check looks at the status code, headers, response time, and usually the response body, not only whether the host answered.
What is the difference between API monitoring and APM? ▼
API monitoring works from the outside. It sends synthetic requests from external locations and reports what a client sees. APM works from the inside. It instruments your application to show which function, query, or service is slow. Plenty of people run both, for example Hyperping for outside checks next to Datadog APM.
What is the difference between API monitoring and API testing? ▼
API testing tools such as Postman collections or a CI suite check correctness on demand or at deploy time. API monitoring runs checks against production on a schedule, from several regions, keeps history, and pages someone when a live endpoint breaks. Postman Monitors turns a collection into a scheduled monitor.
Can I monitor authenticated APIs? ▼
Yes. Most tools support static headers, basic auth, or bearer tokens. If the check has to log in, store a token, and call a protected route, Checkly, Postman Monitors, Assertible, and Datadog do that in API checks. Hyperping does it in a Playwright check that sends the requests without opening a page, and those count against the browser-check quota.
How much does API monitoring cost? ▼
Ten checks every five minutes from one location make 86,400 runs a month. That fits the free plans of Hyperping, Grafana Cloud, Better Stack, and UptimeRobot. It's about $37/month on Checkly Starter with extra runs, about $43/month on Datadog at $5 per 10,000 runs, and about $49/month on Postman Solo with extra monitor calls. With on-call included, Hyperping Essentials is $24/month and Better Stack is $29 per responder.

