The best synthetic monitoring tools are Hyperping for Playwright browser checks with on-call and status pages, Checkly for Playwright monitoring as code, Datadog for connecting failed journeys to logs and traces, Grafana Cloud for people who already write k6, Better Stack for checks inside a wider incident workflow, Site24x7 for no-code recording and broad location coverage, and Uptime.com for enterprise website monitoring.
I analyzed 36 products and shortlisted seven. Every tool below can run a multi-step browser journey or chained transaction on a schedule and alert when a step fails. Basic uptime checkers, page-speed labs, enterprise network monitoring, and self-hosted runners are further down.
The fact that changes the shortlist most is how the vendor bills. Five browser checks every five minutes from one location is 43,200 runs in a 30-day month. At Datadog's $12 per 1,000 browser runs, that's about $518/month, while Hyperping Pro covers it at $74/month, with on-call and a status page included. Prices were checked in August and September 2026.
| Tool | Best for | Starting price | Main limitation |
|---|---|---|---|
| Hyperping | Playwright checks, on-call, and a status page | $24/mo | Browser checks every 5 minutes; no private locations |
| Checkly | Playwright monitoring as code | Free; paid from $24/mo | Runs add up with frequency and locations; no recorder |
| Datadog | Failed journeys next to traces and logs | $12 per 1,000 browser runs | Per-run billing and platform complexity |
| Grafana Cloud | People who already write k6 and run Grafana | Free; Pro $19/mo plus usage | No recorder; you need to be comfortable in Grafana |
| Better Stack | Synthetics with logs and incident response | $29/responder/mo, plus runtime | Browser minutes are billed on top |
| Site24x7 | No-code recording across many locations | $9/mo; browser from $36/mo | Large suite; the $9 pack doesn't cover browser journeys |
| Uptime.com | Enterprise website and private-location monitoring | From $9/mo | Each journey is an Advanced Check, priced in a calculator |
Why trust this guide
I'm Léo, founder of Hyperping. Yes, that means I have a stake in one of these tools. But I've watched teams pick competitors when they were the better fit, and I'm not going to pretend otherwise. My goal isn't to convince you Hyperping is always the answer. It's to help you understand which tool actually solves your problem.
I went through vendor docs, pricing pages, G2 reviews, and Reddit threads for every tool on the list, in August and September 2026.
What is synthetic monitoring?
Synthetic monitoring sends scheduled, scripted traffic at a website, application, or API and checks that the result still looks right. A useful browser monitor can sign in, walk a workflow, submit data, wait, and assert the final state. A homepage returning HTTP 200 while checkout is broken is the failure this category exists to catch.
A 30-second HTTP check still belongs next to these. It usually catches a complete outage faster and costs less to run. Most people I talk to run frequent endpoint checks for coverage and keep browser checks for a handful of login, signup, or payment paths.
The failures a synthetic check should catch:
- Complete outage: the host doesn't answer. An HTTP check will usually see this first.
- False 200: the page loads, but the button is gone, the cart is empty, or the thank-you page never appears.
- Auth failure: an expired test password or SSO change fails the journey even though customers are fine.
- Selector flake: a harmless UI change breaks the monitor, and you need video, a trace, and a step name to tell it from a real outage.
- Regional failure: one probe location fails while others pass.
- Broken revenue path: search, checkout, payment authorization, lead form, or order confirmation.
- Third-party dependency: identity or billing in the middle of the journey.
- Checks behind a firewall: staging or an internal app that public probes can't reach.
| Method | Traffic | Typical environment | Primary job | Common failure |
|---|---|---|---|---|
| Synthetic monitoring | Scripted, scheduled | Production | Catch a broken journey before users report it | Flaky monitor or bad test data |
| End-to-end test automation | Scripted, triggered by CI | Staging or preview | Stop a broken build from shipping | Test suite blocks a release |
| Real user monitoring | Actual visitors | Production | Measure what customers experienced | Low-traffic paths give little signal |
| Load testing | Generated concurrent traffic | Test or controlled production | Find capacity and performance limits | Test traffic affects the system |
Playwright can cover CI tests and production monitors. Production monitoring adds a schedule, runners in more than one region, retries, someone who owns the alert, failure video, and history you can still read next week. Reusing page objects helps, but production monitors need isolated accounts and data that survive repeated runs.
What should a synthetic monitoring tool catch?
The homepage passed while checkout was broken
A ping on / tells you the host responded. You need a browser check that logs in and pays to know customers can still buy, or you'll hear about it from one of them.
Alma already runs Datadog, and their SRE still keeps Hyperping because the outside check often pages them first.
My Playwright tests already live in Git
After a few dozen monitors, checks edited by hand in a dashboard drift from what's in the repo. Checkly (Playwright, CLI, Terraform, Pulumi) is the usual answer when the suite already lives next to the app. Grafana Cloud is the answer when the suite is k6.
A February 2025 r/devops thread comparing Hyperping, Better Stack, and OneUptime for Playwright shows how people shop: they want real browser checks, and they warn each other to confirm browser support instead of assuming it from uptime features.
The people who own checkout don't write TypeScript
If the people responsible for checkout aren't the people who review pull requests, a code-only tool will sit unused. Site24x7 has a no-code recorder, Selenium IDE import, Chrome and Firefox playback, and an on-premise poller. Datadog has a recorder plus code. Checkly and Hyperping don't ship a recorder.
After it fails, who gets the phone call?
A red check doesn't page anyone or update customers on its own. Hyperping and Better Stack include on-call and status pages. Checkly still needs PagerDuty or incident.io for a rotation, and Datadog On-Call and status pages are separate products.
I need the trace next to the failed checkout
That's Datadog's case. From a May 2026 G2 review, configuring complex multi-step synthetic tests "can be time-consuming." You get the correlation, and you pay for it in setup time and the per-run bill.
I need to know next month's bill
Vendors bill checks, runs, execution minutes, locations, or seats. Five browser checks every five minutes is 43,200 runs. Datadog charges for each run, and Checkly includes 3,000 runs on Starter and 12,000 on Team, so this schedule needs extra runs. Grafana gives 10,000 browser executions free, then $50 per 10,000 on Pro. Better Stack charges Playwright minutes plus a responder. Hyperping counts browser checks in the plan, on a fixed five-minute schedule.
From an April 2026 G2 review of Datadog:
"Datadog is costly, and the expenses may increase quicker than you anticipate."
Synthetic monitoring capability comparison
The biggest split is how you write checks and how often a browser check can run.
| Capability | Hyperping | Checkly | Datadog | Grafana Cloud | Better Stack | Site24x7 | Uptime.com |
|---|---|---|---|---|---|---|---|
| Browser engine | Playwright | Playwright | Datadog browser tests | k6 browser | Playwright | Chrome and Firefox | Real browser |
| How you write checks | Playwright code, templates | Playwright code, CLI, Terraform, Pulumi | Recorder or code | k6 JavaScript | Playwright code | Recorder or Selenium IDE import | Recorder and scripts |
| Fastest browser interval | 5 minutes | 1 minute | 1 minute | 60 seconds | 30 seconds | 1 minute | 1 minute |
| API checks | Yes | Yes, including multistep | Yes, including multistep | Yes | Yes | Yes | Yes |
| Public locations | Managed network | 22 on Team, 6 on lower plans | Managed global locations | Grafana probes | Regional groups | 130+ | 80+ |
| Private locations | No | Team plan and up | Yes, as an add-on | Probes you host | Not published | On-premise poller | Yes |
| Failure evidence | Video, traces, and logs | Video, traces, and screenshots | Screenshots, linked traces and logs | Grafana metrics and logs | Screenshots and logs | Reports and captured steps | Browser reports |
| On-call rotation | Yes | No | Separate Datadog product | Grafana alerting | Yes | Alerting and integrations | Alerting and escalation |
| Status pages | Included | Priced as a separate module | Separate product | No | Included | Yes | Yes |
Synthetic monitoring pricing compared
Vendors bill browser checks, runs, execution minutes, or responders, so the same schedule costs very different amounts.
| Tool | Free plan | First paid plan | What it includes | Billed by | Watch out for |
|---|---|---|---|---|---|
| Hyperping | 20 monitors, 1 status page, no browser checks | Essentials, $24/mo | 3 browser checks, 50 monitors at 30s, on-call, 1 status page | Plan | Five browser checks need Pro at $74/mo |
| Checkly | Hobby: 1,000 browser runs, 10 monitors | Starter, $24/mo | 3,000 browser runs, 25,000 API runs, 6 locations | Run | Status pages, AI root cause, and private locations cost extra |
| Datadog | No; 14-day trial | $12 per 1,000 browser runs | Only the runs you schedule | Run | $18 per 1,000 on demand; On-Call is $20 per seat |
| Grafana Cloud | 10,000 browser executions a month | Pro, $19/mo platform fee | 10,000 browser executions, then $50 per 10,000 | Execution, per location per minute of runtime | A 30-second run still counts as a full minute |
| Better Stack | 10 monitors and 1 status page | Responder, $29/mo ($34 monthly) | On-call, unlimited phone and SMS, uptime, 1 status page | Responder plus Playwright minutes | $1 per 100 Playwright minutes on top |
| Site24x7 | Yes, limited resources | Web Uptime, $9/mo | 25 websites at 1-minute checks | Pack | Browser journeys need Web Perf at $36/mo |
| Uptime.com | No; 30-day money-back guarantee | Website Monitoring, $9/mo | Basic and Advanced Checks set in the calculator | Check tier | Every transaction check is an Advanced Check |
What five browser checks cost
This is my estimate from public pricing. It assumes five browser checks, each every five minutes from one location, for a 30-day month (43,200 runs), and 30 seconds per run where the vendor bills by the minute.
| Tool | Plan that covers it | Monthly cost | Note |
|---|---|---|---|
| Hyperping | Pro, 10 browser checks | $74 | On-call and 3 status pages included; $89 billed monthly |
| Checkly | Starter plus 41,000 extra runs at $4 per 1,000 | About $188 | Team plus 32,000 extra runs is about $192 |
| Datadog | 43,200 runs at $12 per 1,000 | About $518 | About $778 at the $18 on-demand rate |
| Grafana Cloud | Pro, 33,200 executions over the free 10,000 | About $185 | $19 platform fee plus about $166 of executions |
| Better Stack | 21,600 Playwright minutes plus 1 responder | About $245 | $216 of runtime plus $29; a one-minute script doubles runtime |
| Site24x7 | Web Perf, 8 transaction monitors | $36 | 1-minute polling and 8 locations in the pack |
| Uptime.com | 5 Advanced Checks tier | $30 | Uptime.com doesn't publish the dollar price for this tier |
Site24x7 comes out cheapest because Web Perf bundles eight transaction monitors into a flat pack, and Hyperping is next because it counts browser checks instead of runs. Everyone who bills by run or minute (Checkly, Grafana Cloud, Better Stack, Datadog) lands between $185 and $518, and a second location doubles their usage while Hyperping and Site24x7 stay flat.
Hyperping: Best for browser checks with on-call and status pages
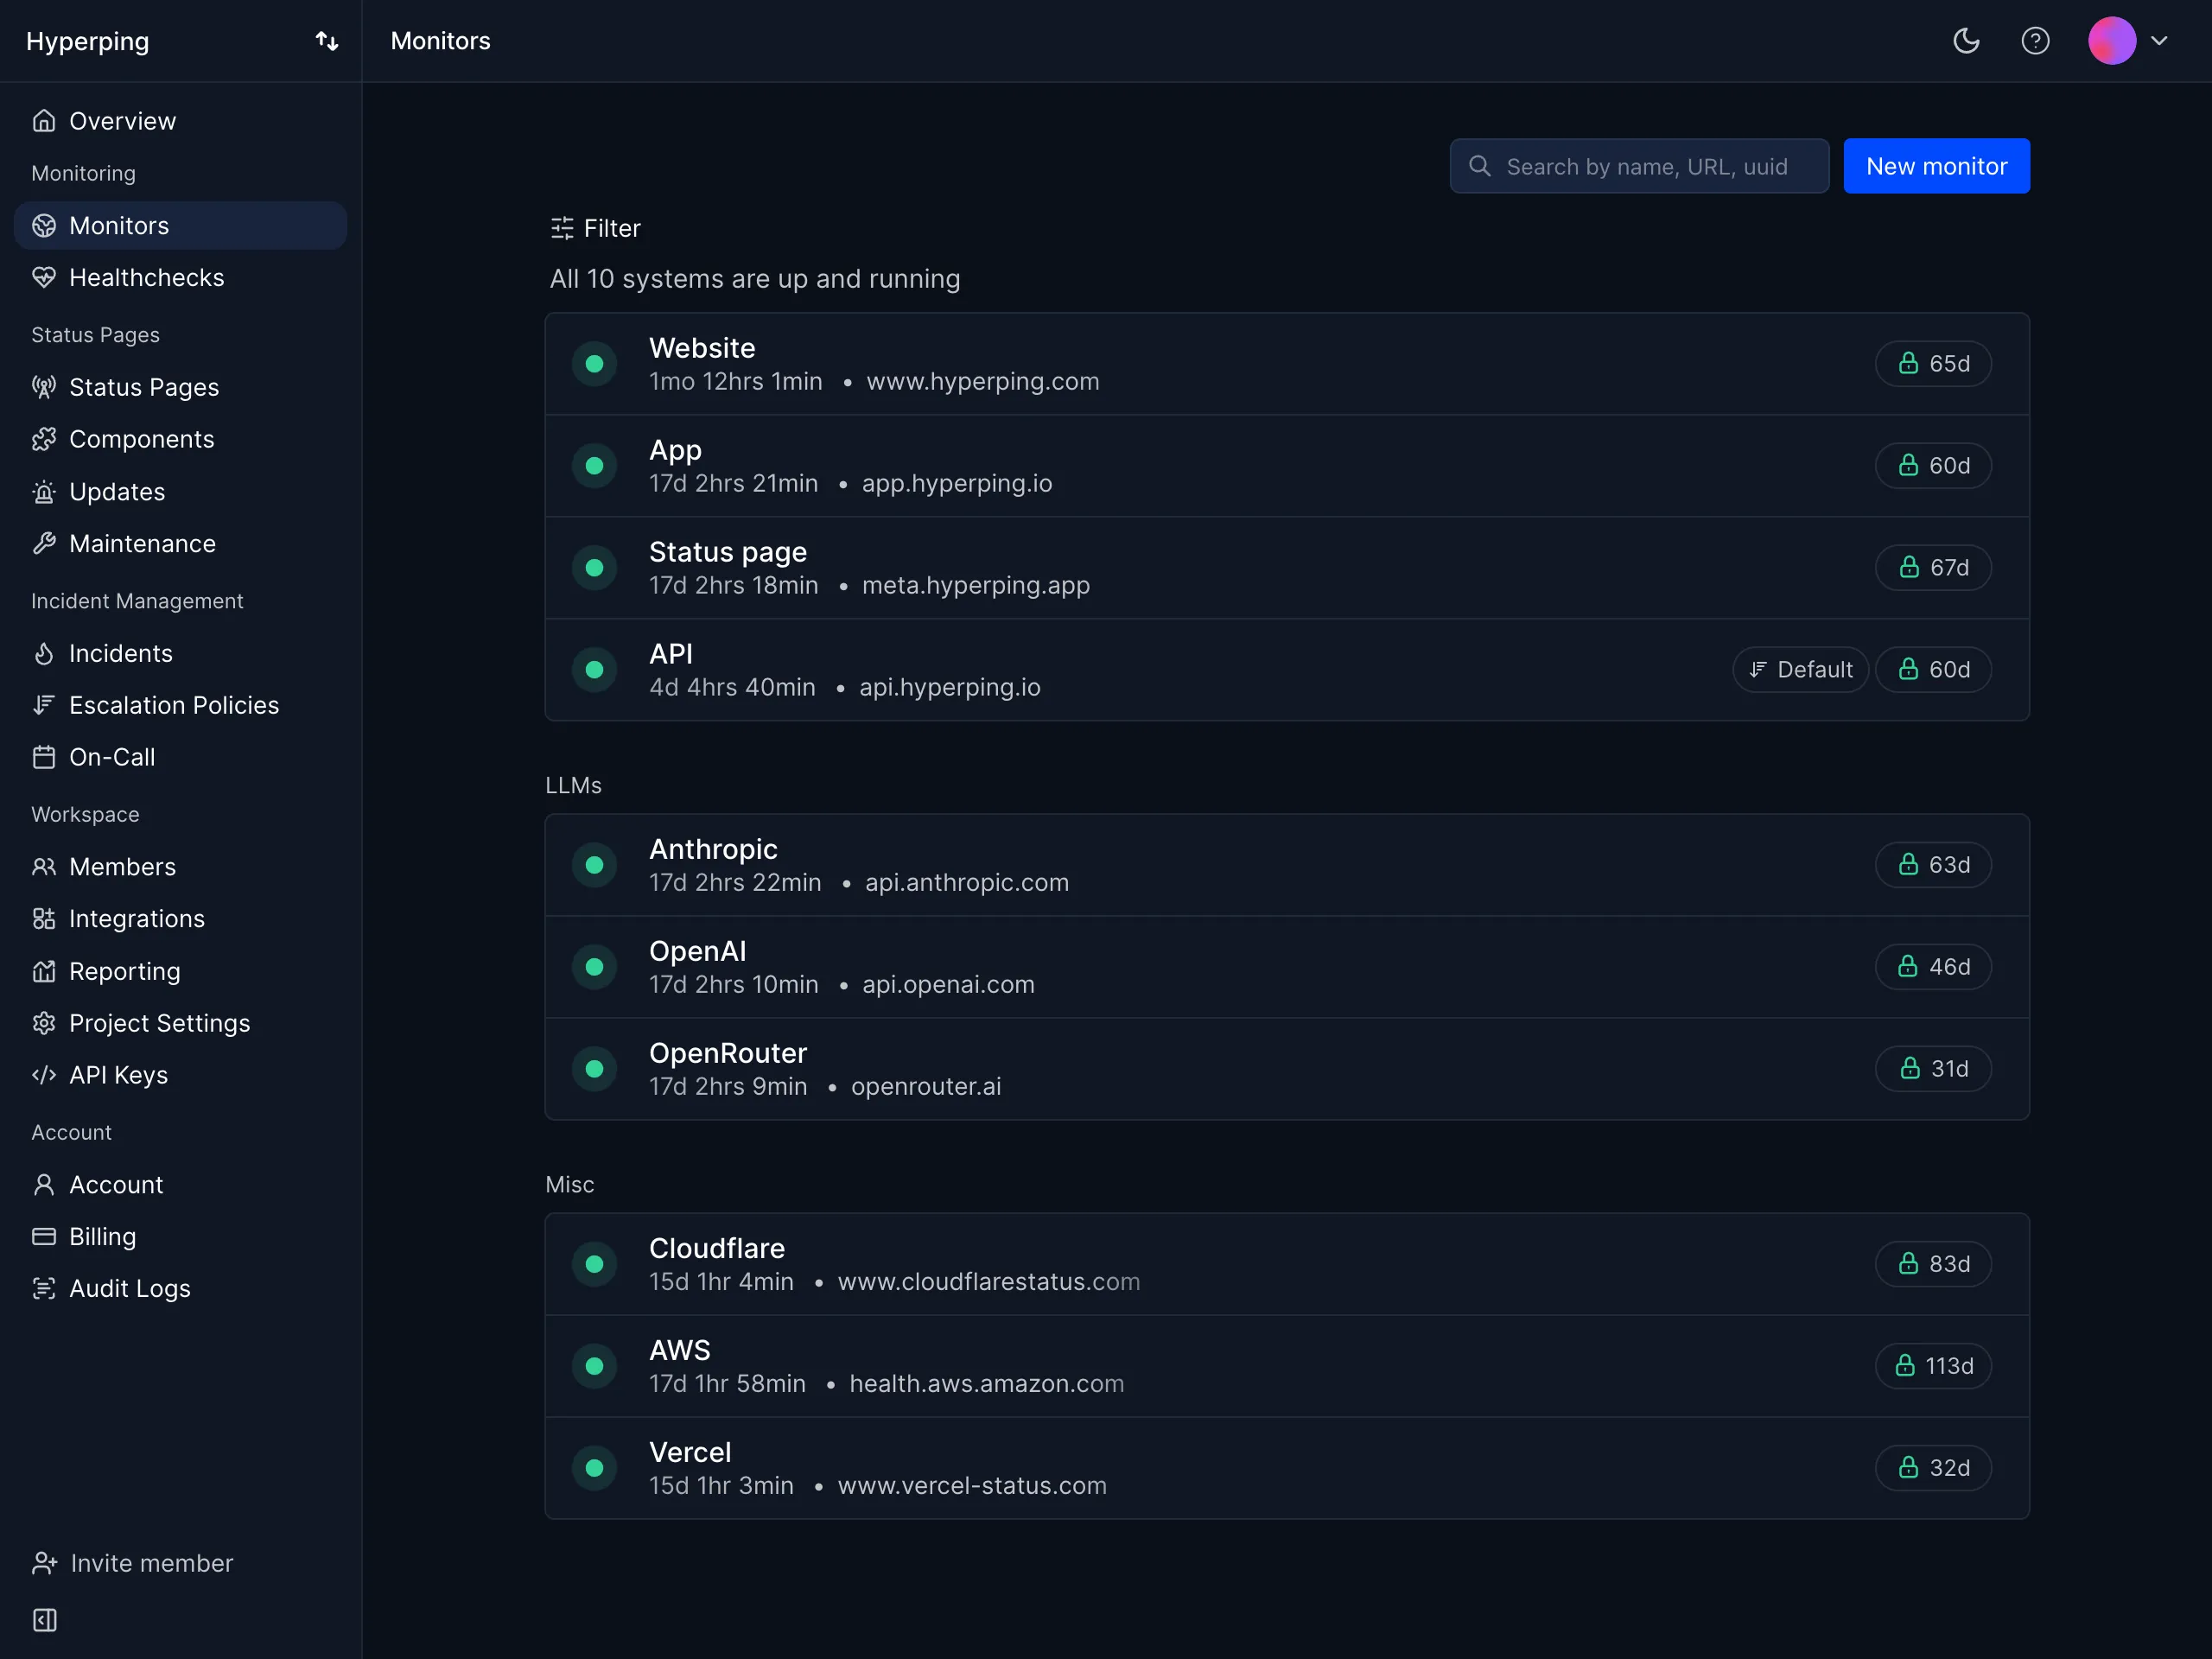
Hyperping combines Playwright browser checks with uptime monitoring, on-call schedules, escalation policies, incidents, server monitoring, and status pages. I built it for SaaS companies that want to watch a few critical journeys, get the failure to the right person, and keep customers informed from the same product.
| Best for | Starting price | Main limitation |
|---|---|---|
| SaaS companies buying a complete reliability workflow | $24/mo | 5-minute browser schedule and public locations only |
Who Hyperping is built for
People who want a small set of Playwright journeys (login, signup, checkout) plus the rest of the response: retry, incident, on-call, escalation, and a status page. Usually that's a handful of engineers who don't want a second vendor for PagerDuty and Statuspage.
Alma is the outside-in example: they already run Datadog and still keep Hyperping as a second opinion from outside the cluster.
Notable features
- Playwright browser checks. Two-minute timeout per run, developed locally from templates.
- Failure evidence. Logs, video, and trace data on failed runs.
- Environment variables. Credentials for isolated test accounts stay out of the script.
- Browser interval. Every 5 minutes, on every plan.
- On-call and escalation. Slack, SMS, or phone call, routed to whoever is on the current rotation.
- Status pages. Linked to the same monitors and included on every plan.
- Uptime monitors next to the journeys. 30-second HTTP checks catch complete outages between browser runs.
Why choose Hyperping for synthetic monitoring?
On-call and a status page are in the same plan. A failed journey can retry, open an incident, escalate, call the person on call, and update a status page. Checkly has no on-call rotation, and Datadog On-Call is $20 per seat on top of the runs.
You pay for browser checks, not runs. Five journeys every five minutes use five of Pro's ten browser checks at $74/month. The same schedule is about $188/month on Checkly and about $518/month on Datadog, before any other Datadog product.
The failure comes with video and a trace. Responders see the failed step with video and a Playwright trace. Checkly stores the same artifacts, and Datadog adds correlation into APM and logs.
What users say
Alma's SRE, Fabrice Gregoire, compared Hyperping to Datadog on speed and billing:
"Hyperping's reputation in our company is that it's more reactive than Datadog. We usually get notifications from Hyperping before Datadog."
"Datadog charges per check. You have a package, that's better. Pay per use is annoying and expensive."
DynaPictures on the status page:
"We made our Hyperping status page publicly available and it became a crucial part of our sales pitches."
How much does Hyperping cost?
- Free: 20 monitors, 5-minute checks, 1 hosted status page. No browser checks
- Essentials: $24/month ($29 monthly) for 3 browser checks, 50 monitors at 30-second checks, 1 status page, 3 seats, on-call and escalation, phone call alerts
- Pro: $74/month ($89 monthly) for 10 browser checks, 250 monitors, 3 status pages, 10 seats
- Business: $249/month ($299 monthly) for 25 browser checks, 1,000 monitors at 20-second checks, 10 status pages, 20 seats
Every paid plan has a 14-day trial. Five browser checks need Pro at $74/month, since Essentials includes three.
Where Hyperping falls short
Browser checks run every five minutes on every plan, from managed public locations only. There's no private-location runner for staging or internal apps and no no-code recorder. Checkly is the better fit for a large Playwright repository managed through Git, Datadog is stronger when every failed journey needs the trace and logs next to it, and Site24x7 covers the recorder and 130-plus locations.
Is Hyperping right for you?
Pick Hyperping if you want a handful of Playwright checks with on-call and a status page already attached. Look elsewhere if you need a recorder, private locations, one-minute browser checks, or Datadog-style APM correlation.
Checkly: Best for Playwright monitoring as code
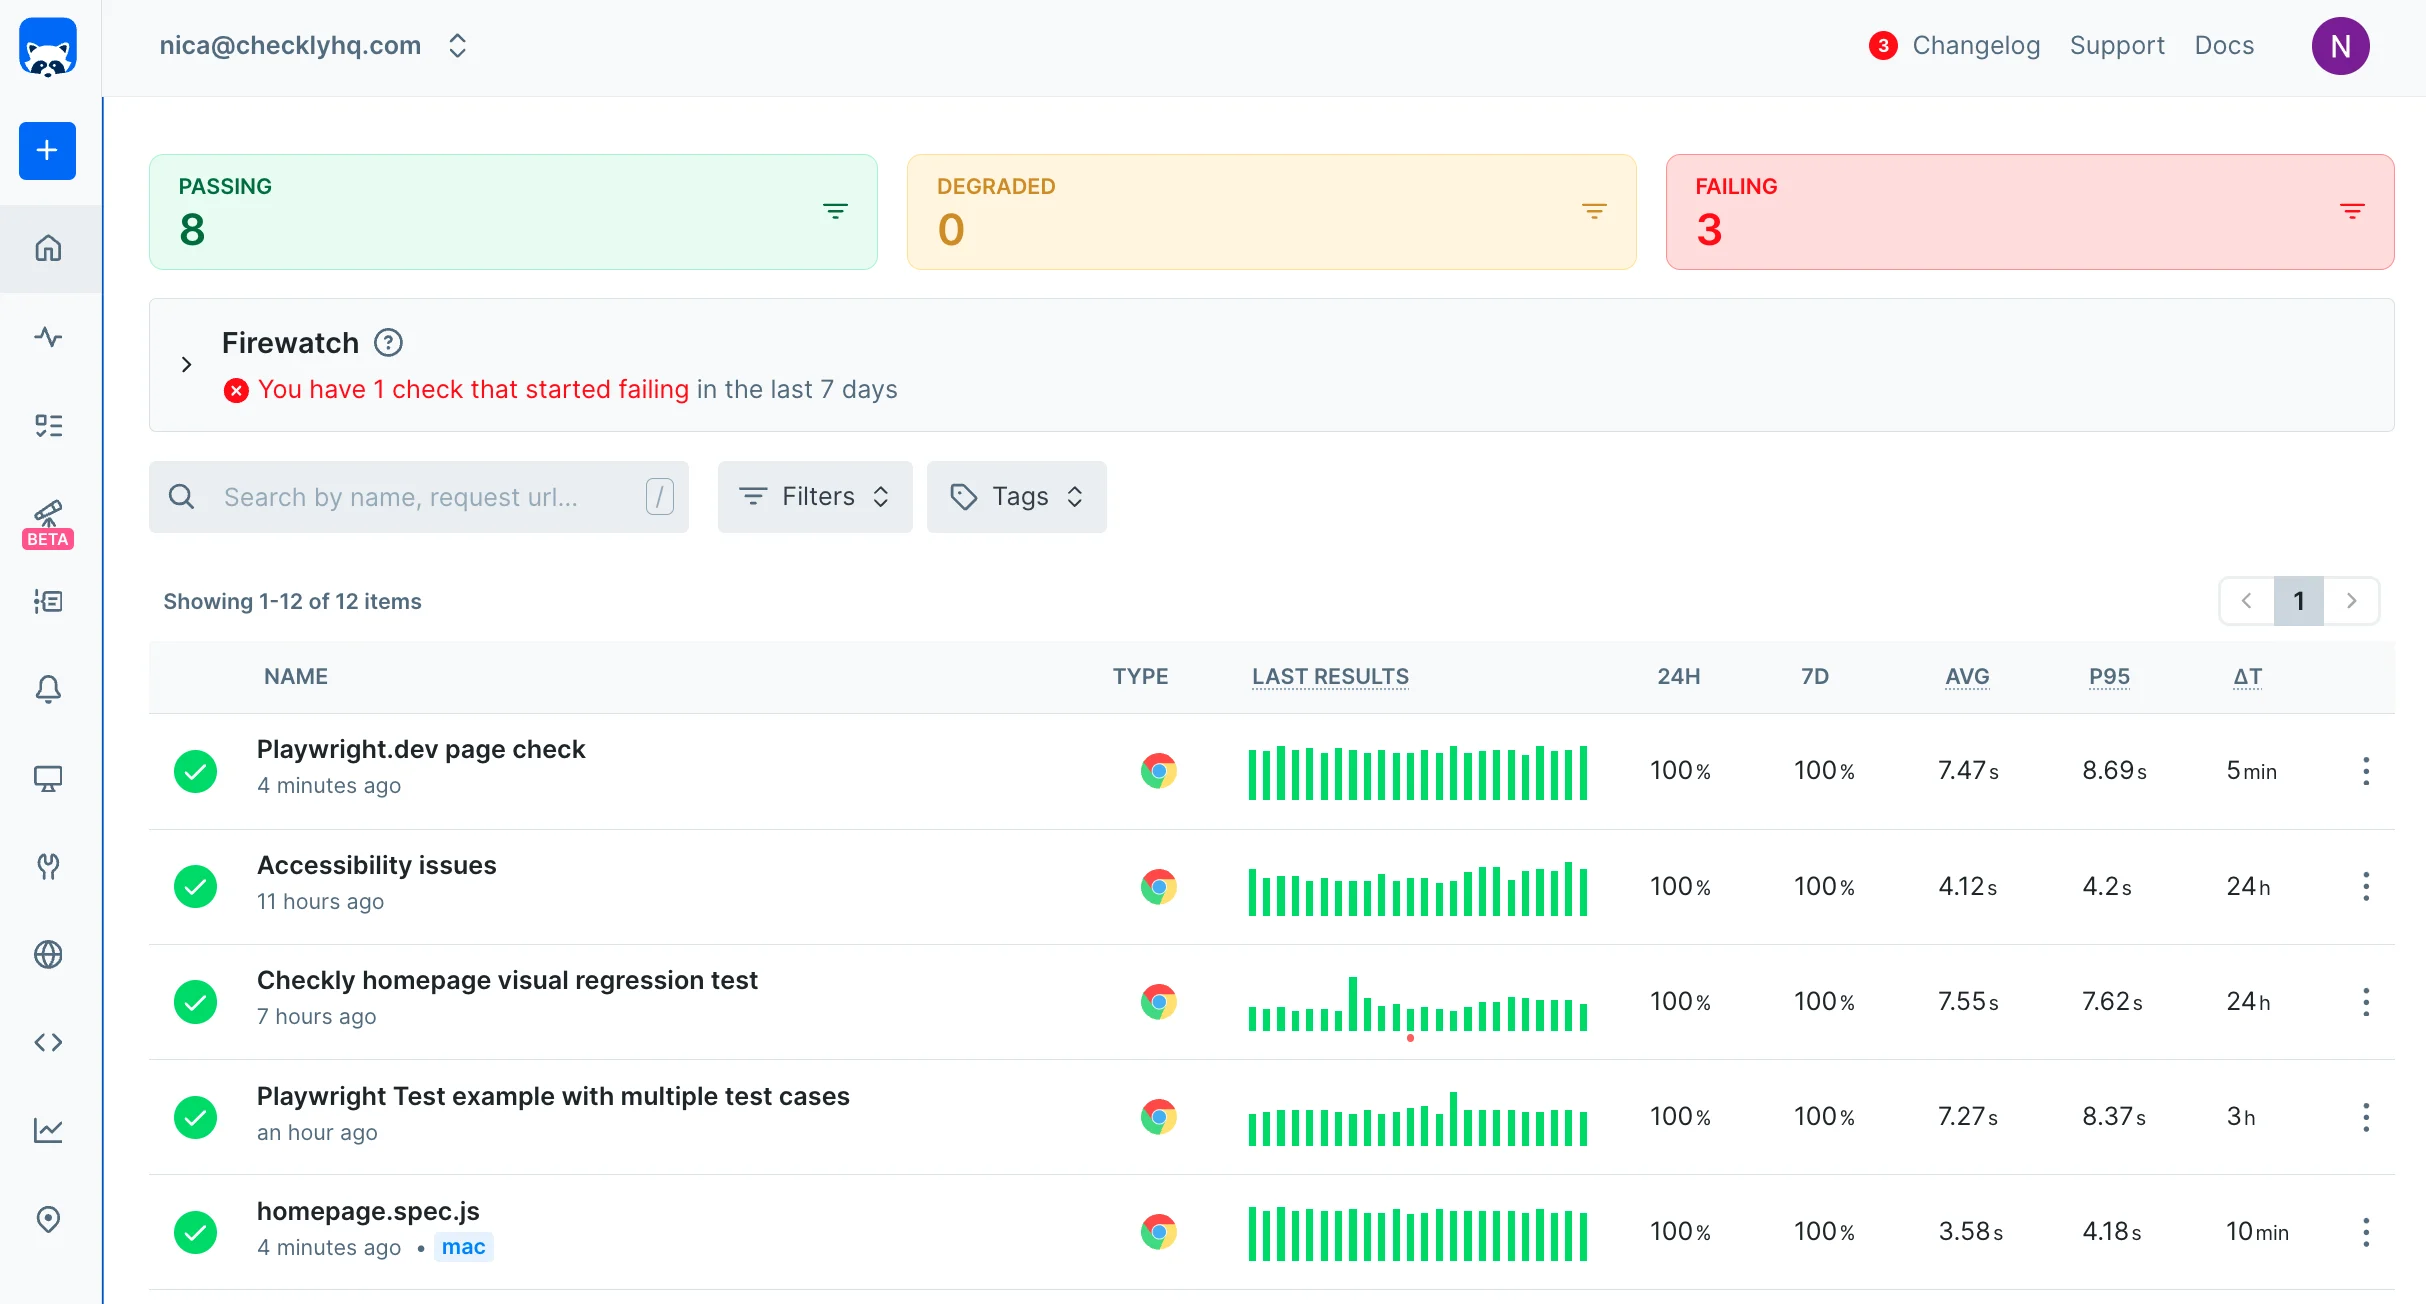
Checkly is the one I point engineers at when they already use Playwright and want production monitors reviewed and deployed like application code. The free Hobby plan includes 1,000 browser runs a month.
| Best for | Starting price | Main limitation |
|---|---|---|
| Developer-owned Playwright checks in Git | Free; paid from $24/mo | Runs add up with frequency and locations |
Who Checkly is built for
Developers who already review Playwright tests in Git and won't accept monitors that only exist in a dashboard: CLI in CI, Terraform or Pulumi, and a mix of API and browser checks. There's no recorder, so people who don't write code can't build journeys on their own.
Notable features
- Standard Playwright. Scripts stay close to your existing test code.
- Monitoring as code. CLI, CI/CD, Terraform, and Pulumi, so monitor changes go through pull requests.
- Locations. 6 on Hobby and Starter (3 per check), all 22 on Team.
- Private locations. On Team and Enterprise.
- Failure artifacts. Traces, video, and screenshots.
- API checks and heartbeats. In the same product, with multistep API checks.
- Status pages. Sold as a separate Communicate module, free on Hobby and from $9/month on Starter.
Why choose Checkly for synthetic monitoring?
The checks live in Git. Hyperping's browser checks are templates and a form around Playwright. Once you have dozens of journeys, Git history is how you tell which version is live, and that's what Checkly is built around.
It runs real Playwright. You can share page objects with your CI tests, which keeps maintenance down. Grafana Cloud wants k6 scripts instead.
The free plan is enough to try it. 1,000 browser runs a month covers one check every 45 minutes, which is enough for a trial or a tiny, slow suite, and needs no credit card.
What users say
Reviewers praise the monitoring-as-code workflow. From an August 2025 G2 review:
"What I like best about Checkly is its "monitoring-as-code" approach, which fits perfectly into modern CI/CD workflows. The ability to write API and browser checks in JavaScript/TypeScript using Playwright, commit them to Git, and run them globally is a game-changer."
How much does Checkly cost?
From Checkly's pricing page, for the Detect module that covers browser and API checks:
- Hobby: free, 1,000 browser runs/month, 10,000 API runs, 10 uptime monitors, 1 user
- Starter: $24/month ($29 monthly), 3,000 browser runs, 25,000 API runs, 3 users
- Team: $64/month ($80 monthly), 12,000 browser runs, 100,000 API runs, 22 locations, private locations, 10 users
Extra browser runs are $4 per 1,000 ($5 monthly), and overage is $6.50 per 1,000 on Starter or $6.25 on Team. Status pages and AI root cause analysis are separate modules.
Five checks every five minutes is 43,200 runs, which costs about $188/month on Starter with 41,000 extra runs, or about $192 on Team.
Where Checkly falls short
There's no recorder and no on-call rotation or incident workflow of its own. Runs add up with frequency and locations, and private locations need Team. Pair it with PagerDuty, or buy Hyperping or Better Stack if the response path is why you're shopping. Datadog is the pick if the failed journey needs a trace in the same UI.
Is Checkly right for you?
Pick Checkly if developers own the monitors and Playwright portability matters. Look elsewhere if people who don't code need a recorder, or if you want on-call, incidents, and customer status updates in the same purchase.
Datadog: Best for synthetic checks connected to observability data

Datadog Synthetic Monitoring is the pick when you already use Datadog for APM, logs, infrastructure, or RUM. Browser tests cost $12 per 1,000 runs.
| Best for | Starting price | Main limitation |
|---|---|---|
| Existing Datadog customers and complex applications | $12 per 1,000 browser runs | Cost grows with frequency, locations, and other Datadog products |
Who Datadog is built for
Companies that already have a Datadog contract and whose synthetic failures usually need a trace, a RUM session, or a log line to diagnose. If synthetics would be the only Datadog product you buy, look at Checkly or Hyperping first.
Notable features
- Recorder plus code. Ops people can record, engineers can script.
- Multistep API tests. Next to browser journeys.
- Locations. Managed global locations, plus private locations as an add-on.
- Correlation. A failed checkout opens next to traces, logs, RUM, or infrastructure data.
- Frequency. From every minute to once a week.
- CI/CD integrations. Run the same tests in your pipeline.
- Mobile app tests. Next to browser tests.
Why choose Datadog for synthetic monitoring?
You can go from the failed journey to the trace. If most checkout incidents end up in APM anyway, a standalone checker means jumping into Datadog after every alert.
Private locations cover staging and internal apps. Hyperping doesn't offer a private runner. Grafana does, as probes you operate, Site24x7 has an on-premise poller, and Uptime.com has private locations.
There's a recorder. Checkly and Hyperping don't have one. Site24x7's recorder is the other no-code path, without Datadog's correlation.
What users say
Reviewers praise the correlation and complain about setup time and cost. From a May 2026 G2 review:
"Configuring complex multi-step Synthetic Monitoring tests can be time-consuming, and the web UI occasionally feels sluggish when navigating through large, data-heavy dashboards during critical debugging sessions."
From a July 2026 G2 review:
"One of the biggest strengths of Datadog is how it brings logs, metrics, traces, and alerts into a single platform."
How much does Datadog cost?
From Datadog's pricing page:
- Browser tests: $12 per 1,000 runs, $15 month to month, $18 on demand
- API tests: $5 per 10,000 runs
- On-Call: $20 per seat per month
APM, logs, infrastructure, and status pages are billed separately. Five browser checks every five minutes from one location cost about $518/month, and about $1,037/month from two locations.
Where Datadog falls short
Per-run billing gets expensive on frequent journeys, and every extra location multiplies the bill. On-call and customer status pages are separate Datadog products or a second vendor, and reviewers mention setup complexity next to cost. Hyperping is cheaper for a small Playwright set with the response workflow included, and Checkly is cheaper if you want the checks in Git and already have PagerDuty.
Is Datadog right for you?
Pick Datadog if synthetic failures usually need logs and traces and the company already has a Datadog contract. If synthetics are the only thing you need, you'll pay for a platform you don't use.
Grafana Cloud: Best for people using k6 and Grafana
Grafana Cloud Synthetic Monitoring fits people who already write k6 for load or browser testing and run Grafana for dashboards. The free tier includes 10,000 browser executions a month.
| Best for | Starting price | Main limitation |
|---|---|---|
| Grafana, Prometheus and k6 users | Free; Pro $19/mo plus $50 per 10,000 executions | No recorder and a Grafana-centered way of working |
Who Grafana Cloud is built for
Platform and SRE people who already operate Grafana and k6. You have the scripts, so you put them on a schedule and alert in Grafana. If you're starting with no k6 at all, you'll spend the trial learning Grafana instead of covering checkout.
Notable features
- k6 scripts. HTTP, TCP, DNS, ICMP, and browser checks.
- Free tier. 10,000 browser executions and 100,000 API executions a month.
- Results in Grafana. Dashboards and alerting you already use.
- Self-hosted probes. Run checks from private or controlled locations.
- Browser interval. As often as every 60 seconds, faster than Hyperping's five minutes.
- Authoring. Code only, with no recorder.
Why choose Grafana Cloud for synthetic monitoring?
You can reuse k6. If you already write k6 for load tests, you can schedule those scripts instead of adopting Checkly's Playwright CLI or Hyperping's templates.
The free allowance is real. 10,000 free browser executions cover three checks every 15 minutes from one location, and this guide's five checks every five minutes need Pro.
Private probes are yours to run. That's more work than Datadog's private-location add-on and gives you more control.
What users say
People on Reddit mention the k6 support and the free monthly allowance.
"I just use Synthetic Monitoring in Grafana Cloud. It lets you run complex checks using K6 or just simple pings, and they have a bunch you can do per month for free."
"Checkly. Grafana cloud synthetics is a little clunky but works"
How much does Grafana Cloud cost?
From Grafana's pricing page:
- Free: 10,000 browser executions and 100,000 API executions a month
- Pro: $19/month platform fee, the same allowance, then $50 per 10,000 browser executions with volume discounts
An execution is one test in one location per minute of runtime, rounded up. Five checks every five minutes from one location is 43,200 executions, about $185/month on Pro.
Where Grafana Cloud falls short
There's no recorder, and no customer status page or on-call rotation in the same purchase. Hyperping and Better Stack cover that response path. Checkly is a more focused Playwright workflow if you aren't already running Grafana, and a full investigation may mean Grafana plus Loki and Tempo instead of one synthetic-specific screen.
Is Grafana Cloud right for you?
Pick Grafana Cloud if k6 and Grafana are already how you work. If you wanted a recorder, or a status page and on-call rotation in the same purchase, look at Site24x7 or Hyperping.
Better Stack: Best for browser checks with logs and incident response
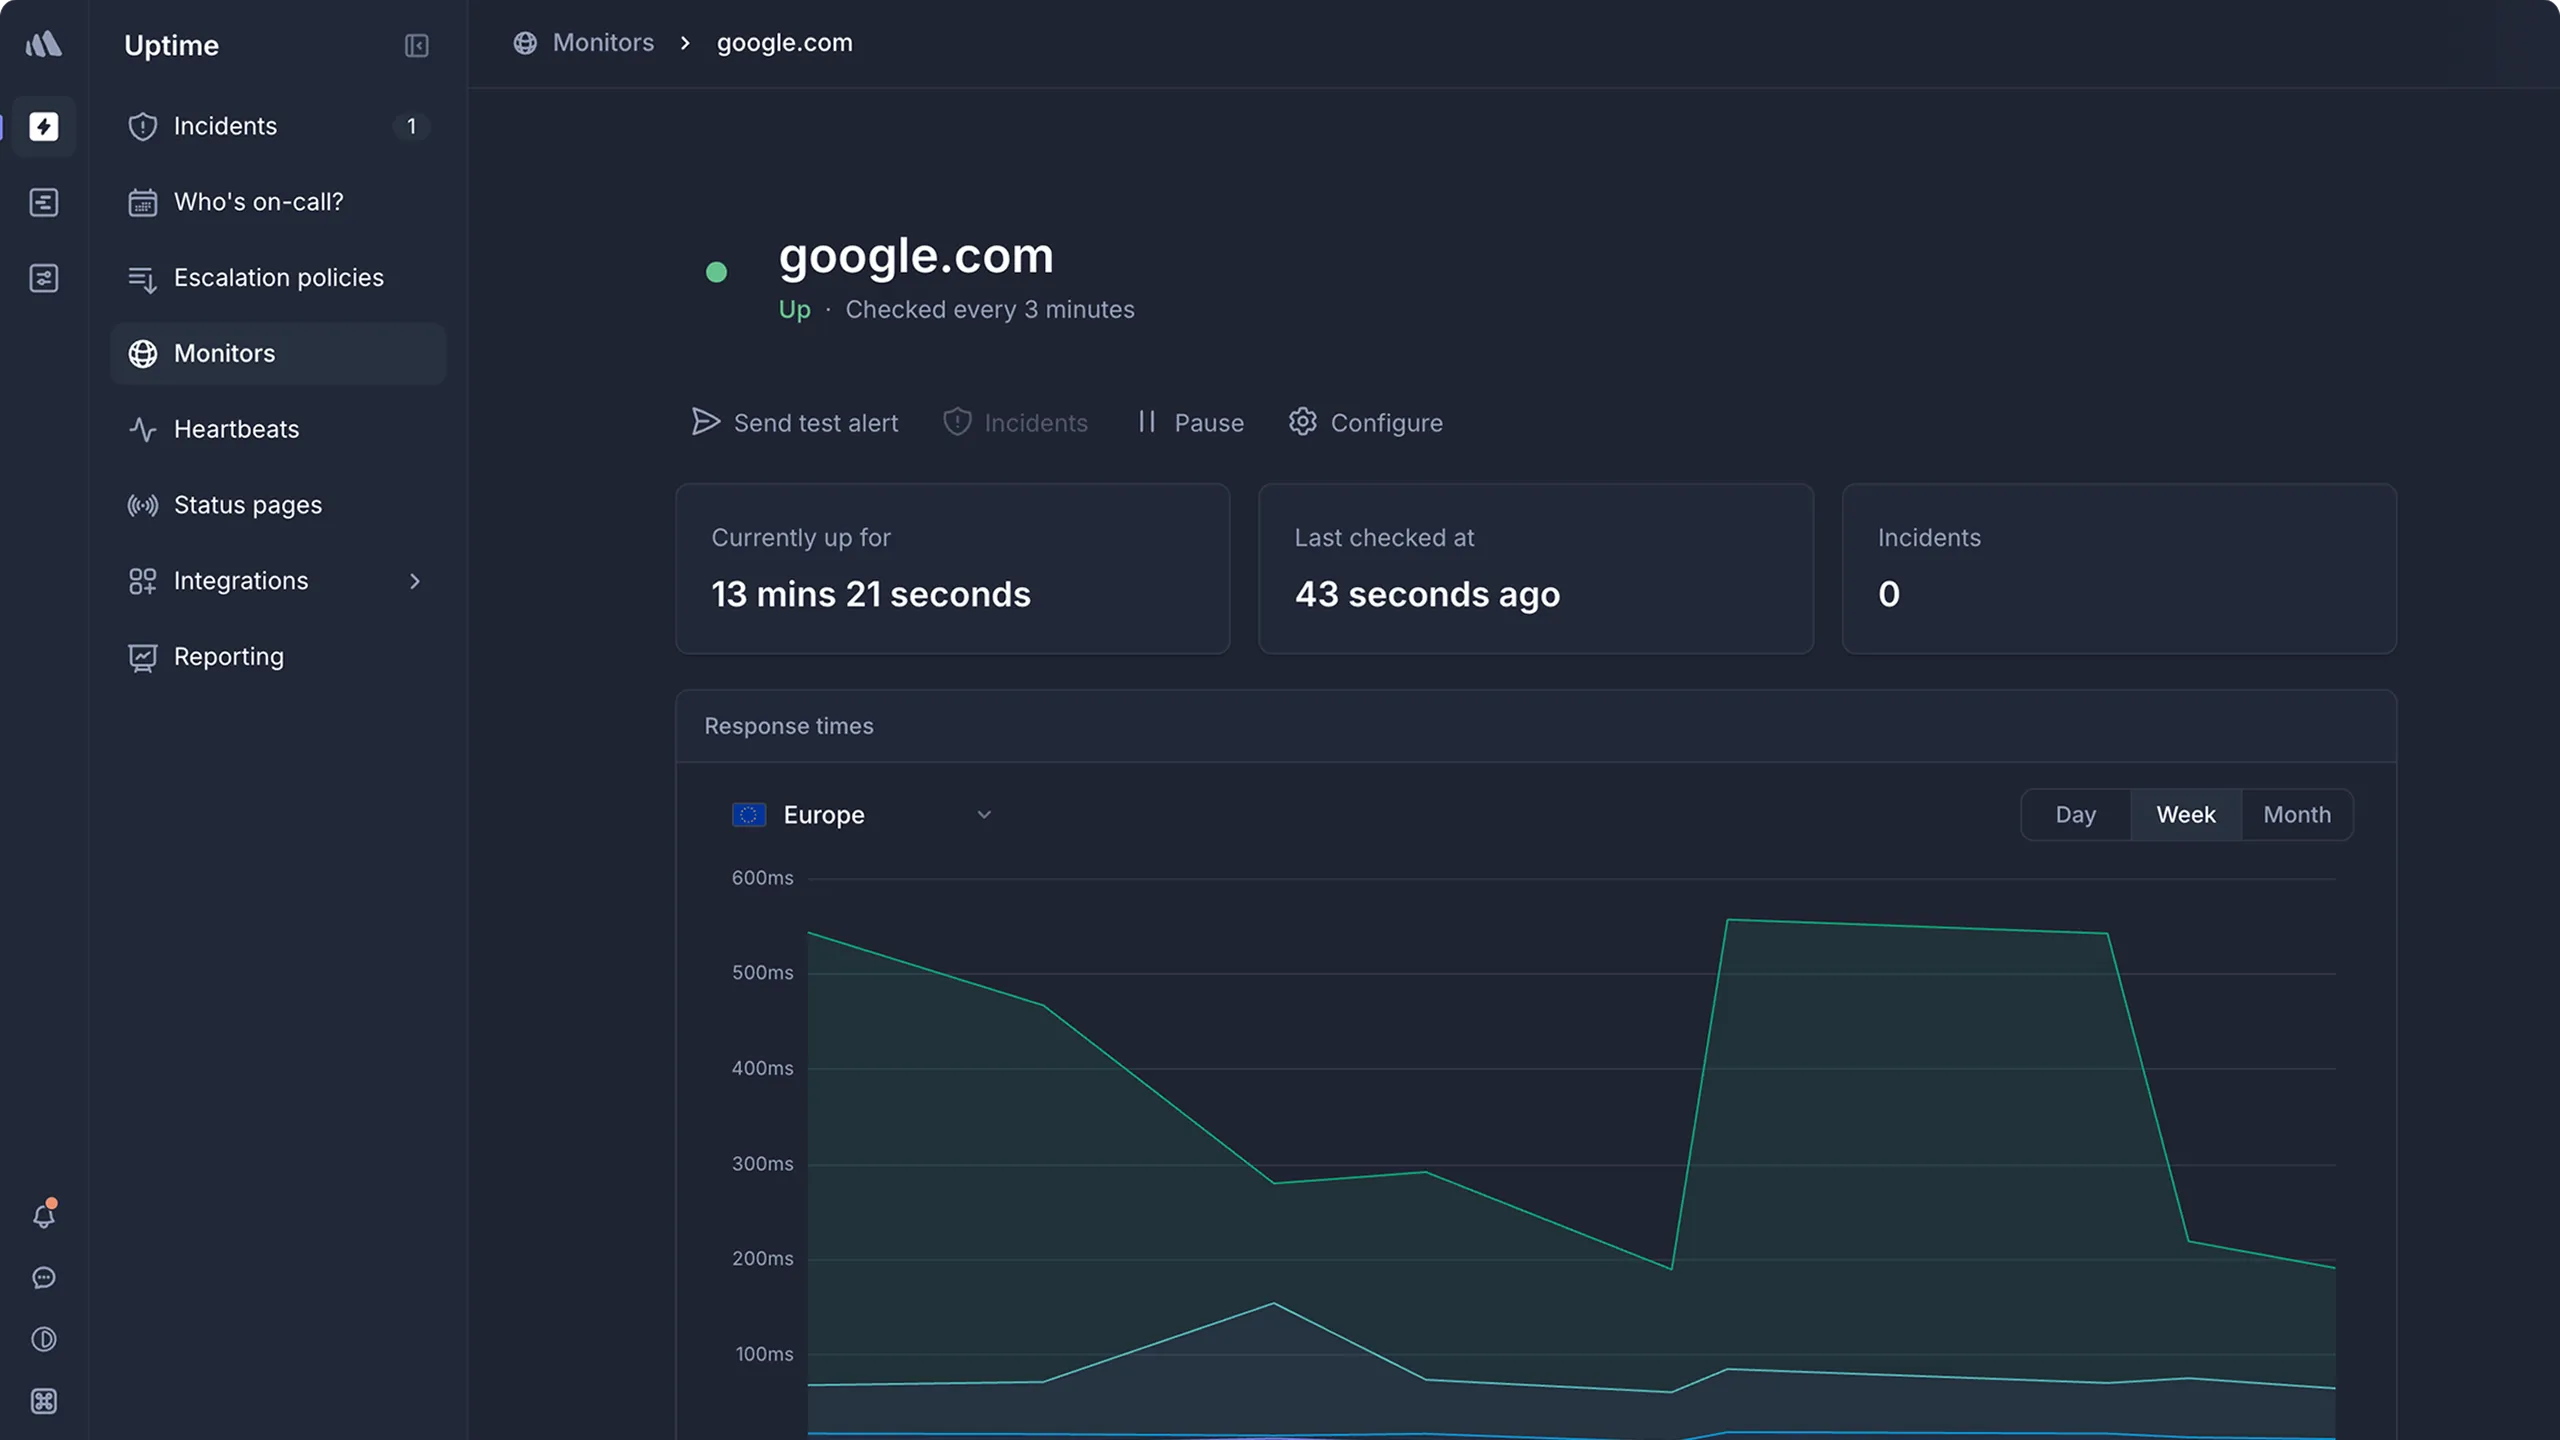
Better Stack combines Playwright checks with uptime monitoring, telemetry, on-call, incidents, and status pages. A responder costs $29/month, and browser runtime is billed on top.
| Best for | Starting price | Main limitation |
|---|---|---|
| Logs and response workflows next to browser checks | $29/responder/mo | $1 per 100 Playwright minutes on top |
Who Better Stack is built for
Startups that want the check, the page, the incident timeline, and the logs from one vendor, usually because they're tired of stitching a checker to PagerDuty to a status page. If you already run PagerDuty and only needed Playwright, you'll buy more than you use.
In the February 2025 r/devops thread, people liked Better Stack's support, logging, API, and Terraform provider.
Notable features
- Playwright transaction checks. Hosted, as often as every 30 seconds.
- On-call. Schedules, escalation, and unlimited phone and SMS for responders.
- Incidents. Slack and Teams workflows, timelines, and post-mortems.
- Status pages. Public and private, 1 included.
- Telemetry. Logs, metrics, traces, error tracking, and RUM, which is why people pick it over Hyperping when diagnosis needs data.
- Terraform and REST API. Manage monitors as code.
- Browser runtime. $1 per 100 Playwright minutes.
Why choose Better Stack for synthetic monitoring?
Incidents, on-call, and logs sit next to the check. Hyperping also bundles on-call and status pages. Better Stack adds logs, traces, and a more developed Slack and Teams incident workflow.
One responder gets you started. The $29 Responder plan covers uptime, on-call, monitoring, and a status page, with browser minutes on top. Hyperping Pro is $74/month with 10 browser checks included.
There's a Terraform provider. Useful if you want infrastructure as code without switching to Checkly's Playwright CLI.
What users say
Pricing for small teams is the complaint that repeats. From a March 2026 G2 review:
"The pricing can feel a bit high for small teams or individual developers. Also, some of the more advanced features and configuration options come with a learning curve."
From an August 2026 G2 review:
"I love using Better Stack for logging, telemetry, and alerting. It's been great for unifying data from our multiple services."
How much does Better Stack cost?
From Better Stack's pricing page:
- Free: 10 monitors and heartbeats, 1 status page, Slack and email alerts
- Responder: $29/month ($34 monthly), with on-call and unlimited phone and SMS
- Playwright runtime: $1 per 100 minutes
- Status page add-ons: white-label $208 per page per month, SSO $208 per page per month
Five checks every five minutes at 30 seconds a run is 21,600 minutes, about $216 in runtime plus $29 for one responder, so about $245/month before logs or extra status pages. A one-minute script doubles the runtime part.
Where Better Stack falls short
Modular pricing is harder to predict than Hyperping's plans, and browser usage is always extra. Locations are chosen as broad regions, which is coarser than Checkly or Site24x7. Checkly goes deeper on multi-step Playwright if Git-owned checks are the job. White-label status pages cost $208 per page per month, while Hyperping Business includes white labeling at $249/month.
Is Better Stack right for you?
Pick Better Stack if you want browser monitoring next to logs and incident response. If you want predictable plan pricing or cheap branded status pages, Hyperping is the simpler bill.
Site24x7: Best for no-code recording and broad location coverage
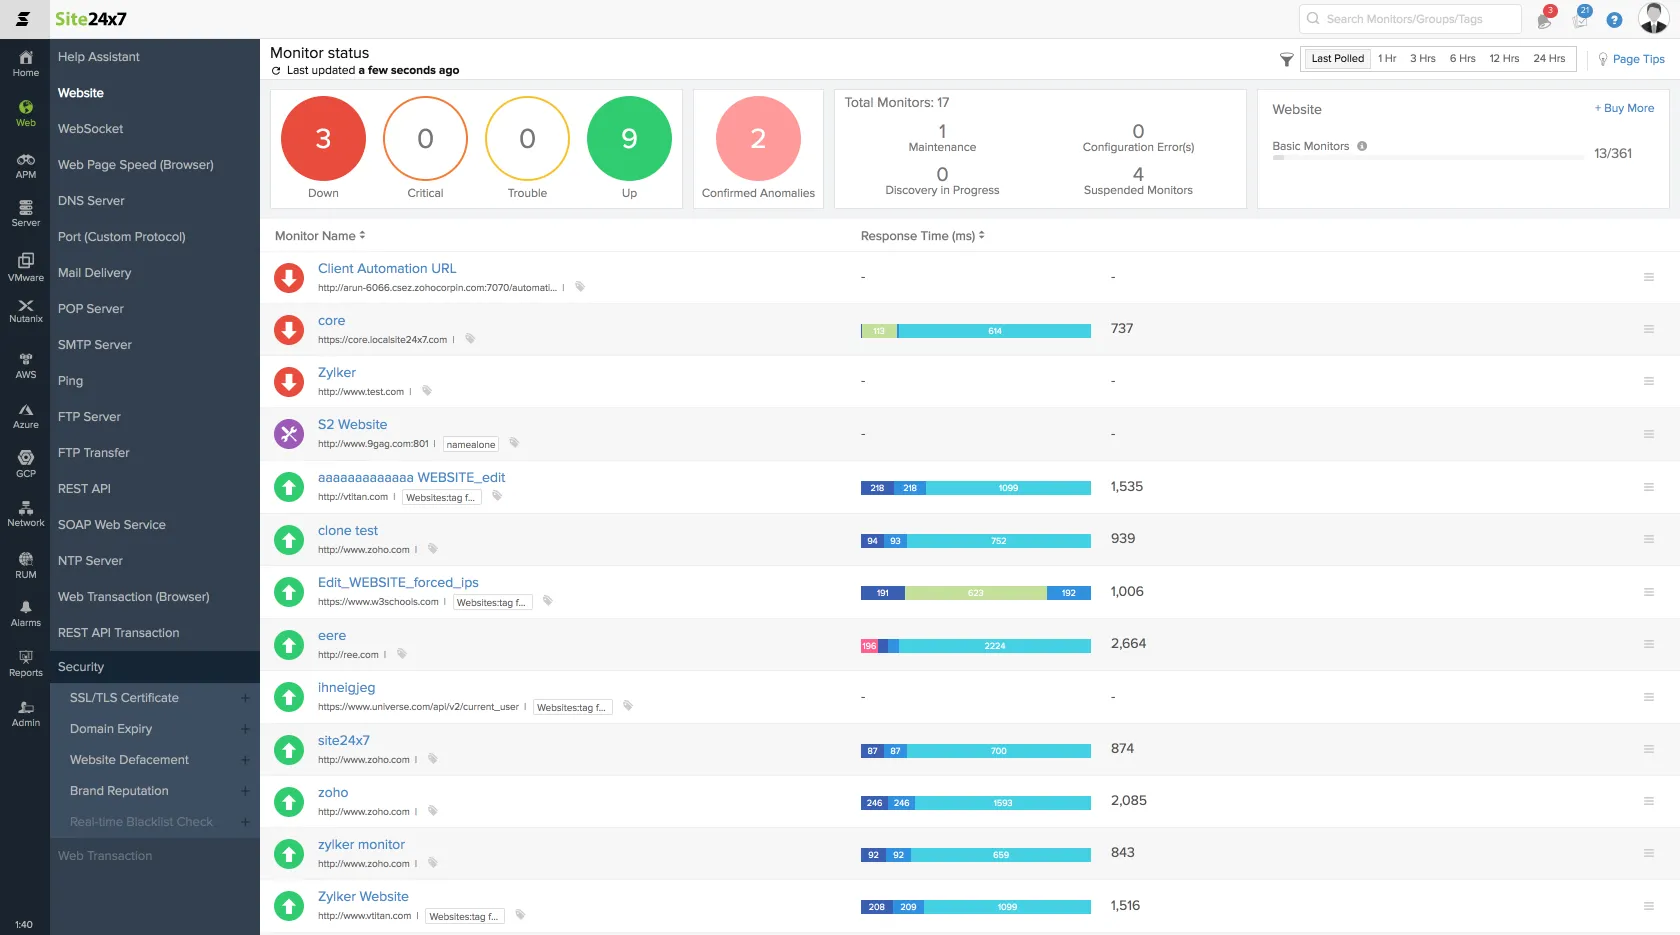
Site24x7 is a broad IT monitoring suite with browser transaction monitoring, API checks, real user monitoring, APM, infrastructure, and network monitoring. Browser journeys start on the Web Perf pack at $36/month.
| Best for | Starting price | Main limitation |
|---|---|---|
| IT operations people who need a recorder and many locations | $9/mo; browser from $36/mo | The console gets crowded once you use the suite |
Who Site24x7 is built for
IT operations groups who need to maintain transactions without every check starting as a Playwright repo, often because they already buy Site24x7 for servers and network and want browser journeys in the same login.
Notable features
- Recorder. No-code recording and Selenium IDE import.
- Browsers. Chrome and Firefox playback.
- Locations. 130-plus monitoring locations.
- On-premise poller. Checks for internal apps.
- The rest of the suite. API checks, RUM, APM, infrastructure, and network monitoring.
- Status pages. Included in the website packs.
Why choose Site24x7 for synthetic monitoring?
The recorder is the main way in. Checkly and Hyperping don't have one, and Datadog's comes inside a more expensive observability contract.
It has the most locations on the list. 130-plus, against Checkly's 22 on Team and Hyperping's managed public network.
It's the cheapest way to run five journeys. Web Perf covers eight transaction monitors at 1-minute polling for $36/month. The suite can also replace several vendors for IT ops, which is where the learning curve comes from.
What users say
Reviewers like the multi-location setup and complain about pricing and a cluttered console. From a January 2026 G2 review:
"The setup is easy and straightforward, especially for multi-location checks of web services performance."
From a December 2025 G2 review:
"Site24x7's pricing can be confusing, and some users find the advanced features have a learning curve. The alert system can be overwhelming without proper setup, and there are fewer third-party integrations compared to competitors. Also, the UI could be more modern and less cluttered."
How much does Site24x7 cost?
From Site24x7 pricing:
- Web Uptime: $9/month for 25 websites. Not enough for browser journeys
- Web Perf: $36/month for 8 transaction monitors, 1-minute polling, and 8 locations
- Web Perf synthetic combo add-ons: from $50/month for 50 uptime monitors and 10 transactions
There's a 30-day free trial with no credit card. Five browser journeys every five minutes fit inside Web Perf at $36/month.
Where Site24x7 falls short
The $9 entry pack doesn't include browser journeys, and Playwright code isn't how you write checks. Checkly is the Git-owned path, Hyperping is the smaller bundle with on-call, and Datadog is the APM correlation path.
Is Site24x7 right for you?
Pick Site24x7 if recorder-based authoring, browser choice, global coverage, and an on-premise poller matter. If you want portable Playwright code or a small product focused on browser journeys, look at Checkly or Hyperping.
Uptime.com: Best for enterprise website monitoring
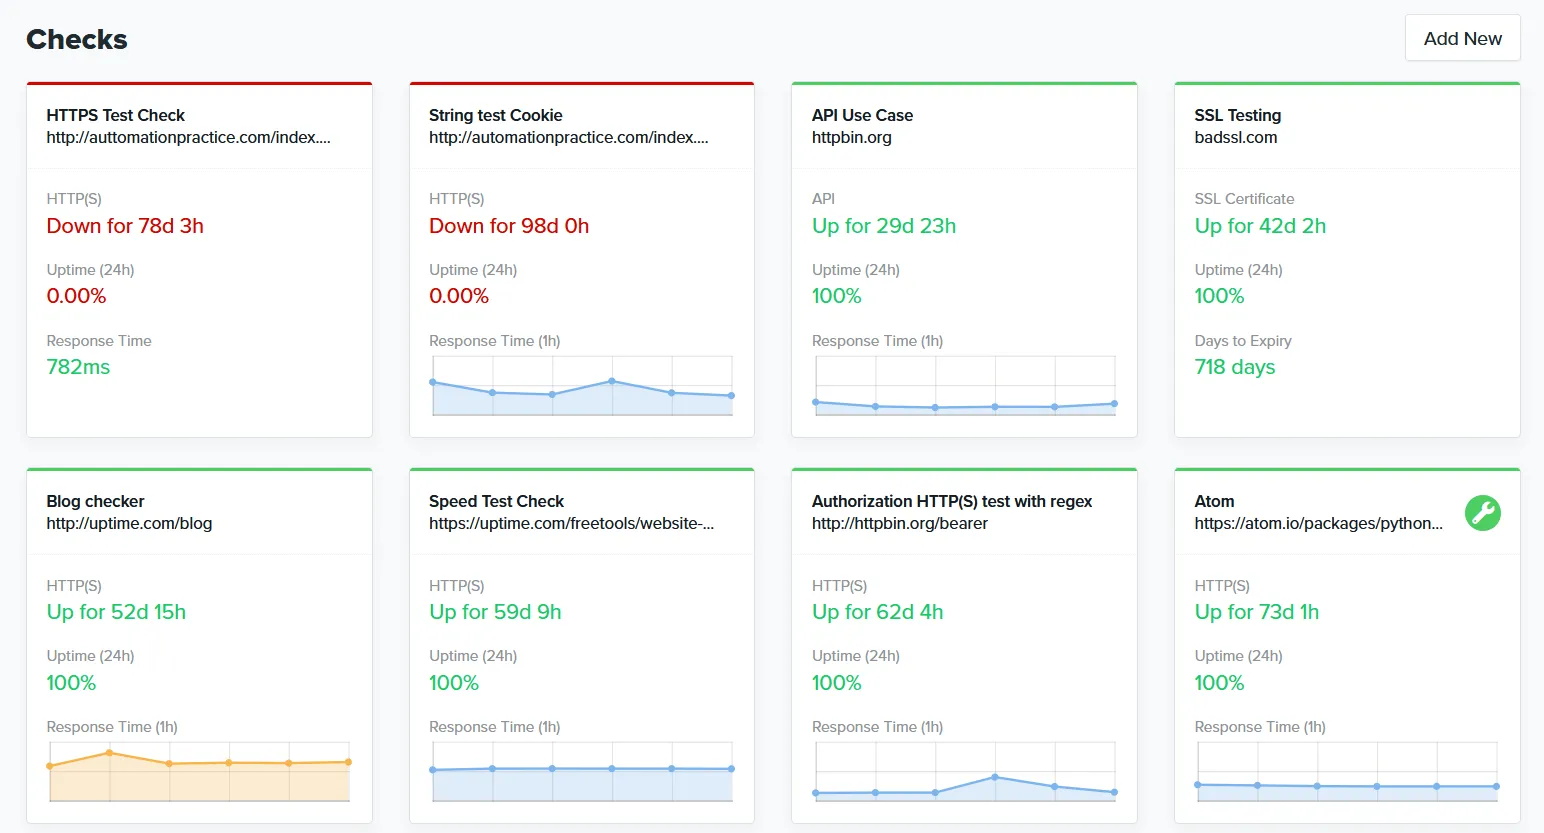
Uptime.com combines real-browser synthetics with uptime checks, API monitoring, real user monitoring, private locations, status pages, and more than 80 points of presence. Website Monitoring starts at $9/month.
| Best for | Starting price | Main limitation |
|---|---|---|
| Organizations buying website monitoring as a managed service | From $9/mo | Each journey is an Advanced Check, priced in a calculator |
Who Uptime.com is built for
Companies that want public and internal website journeys without running their own probes: real-browser checks, API, RUM, private locations, and status pages. It's a heavier purchase than Hyperping's self-serve plans, and a five-person startup that wants Playwright in Git will be happier with Checkly.
Notable features
- Real-browser synthetics. Transaction, micro-transaction, and extended transaction checks.
- Points of presence. 80-plus, with private locations behind your firewall.
- API checks and RUM. RUM covers unlimited sites with 13-month retention.
- Status pages. Public or private, with subscribers.
- Unlimited users. On every plan.
Why choose Uptime.com for synthetic monitoring?
Browser, API, RUM, and private locations come in one managed product. That covers more of the website job than an uptime-only vendor, and Hyperping has no private locations.
The location network is wide. 80-plus points of presence plus private checks. Site24x7 lists more public locations, and Datadog's private locations are an add-on to an observability contract.
It suits people who buy website monitoring as a service. If engineers want the checks in a Playwright repo, Checkly is the better fit.
What users say
Reviewers who build journeys mention the scenario engine. From an August 2026 G2 review:
"I really like the scenario engine of Uptime.com. It allows me to implement complex scenarios in detailed customer journeys."
How much does Uptime.com cost?
From uptime.com/pricing:
- Website Monitoring: from $9/month ($84/year) for 10 basic checks, 1 advanced check, and 25 SMS
- Five-journey tier: $38/month ($360/year) for 50 Basic Checks, 5 Advanced Checks, and 75 SMS
Transaction monitoring is an Advanced Check, so five journeys need the 5-Advanced-Check tier. Uptime.com doesn't publish a price for that tier, so price it in the calculator. There's a 30-day money-back guarantee and no free plan.
Where Uptime.com falls short
You can't see the price of five browser journeys without the calculator. Checkly is clearer if Git-owned Playwright is the job, and Hyperping is clearer if you want 10 Playwright checks and on-call for $74/month.
Is Uptime.com right for you?
Pick Uptime.com if you need a managed website-monitoring product with private checks and broad global coverage. If a focused Playwright workflow or a published browser price matters more, look at Checkly, Hyperping, or Site24x7.
Head-to-head
Checkly vs Datadog
Both run browser checks on a schedule and bill by the run. Checkly keeps Playwright in Git with a CLI, Terraform, and Pulumi, and five checks every five minutes cost about $188/month on Starter with extra runs. Datadog adds a recorder, private locations as an add-on, and the failed journey next to traces, logs, and RUM, for about $518/month on the same schedule. Pick Checkly if developers own the monitors and you don't need APM, and Datadog if you already pay for Datadog and the trace is what you need to fix the failure.
Checkly vs Grafana Cloud
This comes down to Playwright or k6. Checkly counts runs, while Grafana counts executions per location per minute of runtime, rounded up, so a 30-second check costs the same as a 60-second one on Grafana. On this guide's schedule they land close: about $188 on Checkly Starter and about $185 on Grafana Pro. Pick the one that runs the scripts you already have, and pick Checkly if you're starting fresh and don't run Grafana.
Site24x7 vs Uptime.com
Both are recorder-first website monitoring products with internal coverage, through Site24x7's on-premise poller or Uptime.com's private locations. Site24x7 publishes its browser price ($36/month for 8 transactions), plays back in Chrome or Firefox, imports Selenium IDE scripts, and lists 130-plus locations. Uptime.com sells each journey as an Advanced Check priced in a calculator, adds RUM with 13-month retention, and gets G2 praise for its scenario engine. Pick Site24x7 for a published price and more locations, and Uptime.com if you want a managed service with private checks and are fine getting a quote.
Hyperping vs Checkly
Both run Playwright. Checkly wins on monitors as code (CLI, Terraform, Pulumi), 22 locations and private locations on Team, and faster browser schedules. Hyperping wins on the response: on-call, escalation, phone call alerts, and status pages are in the plan, and five checks cost $74/month against about $188 on Checkly. Pick Checkly for a large Playwright repo owned by developers, and Hyperping for a handful of journeys that need to page someone and update customers. There's a longer comparison on the Checkly alternative page.
Do I need Playwright scripts or a no-code recorder?
It depends on who fixes the monitor when it breaks. Playwright tools (Checkly, Hyperping, Better Stack) and k6 on Grafana Cloud keep checks reviewable in Git and let you share page objects with CI tests, which suits developers. Recorders (Site24x7, Datadog, Uptime.com) let ops or QA people build and repair journeys without a pull request. If both groups touch the checks, Datadog is the one on the list that has a recorder and code.
Which one should you pick?
| Buyer or situation | Recommended tool | Reason |
|---|---|---|
| Browser checks, on-call, and a status page in one plan | Hyperping | Five checks fit Pro at $74/mo |
| Large Playwright suite owned by developers | Checkly | Playwright, CLI, and checks in Git; 1,000 browser runs free |
| Already on Datadog | Datadog | Failed journeys next to traces; about $518/mo for five checks |
| Already on Grafana and k6 | Grafana Cloud | Reuse scripts; 10,000 free browser executions |
| Logs and on-call in the same product | Better Stack | On-call and incidents included; about $245/mo for five checks |
| Ops people who prefer recording | Site24x7 | Recorder, Chrome and Firefox, 130-plus locations, $36/mo |
| Enterprise with public and private website journeys | Uptime.com | Browser, API, RUM, and private locations |
| Network reliability, ISP and CDN paths | Catchpoint | Deeper last-mile coverage, listed below |
| Full control, self-hosting | Playwright on a cron | No license; you run the runners, retries, and alerting |
Under $40 a month, you have three options: Site24x7 Web Perf at $36 covers eight journeys, Hyperping Essentials at $24 covers three with on-call, and Checkly Hobby is free for one check every 45 minutes. Between $70 and $250, Hyperping Pro covers ten checks at a flat price, while Checkly, Grafana Cloud, and Better Stack cost more each time you add frequency or a location. Datadog only makes sense above that, when you're already paying for the platform.
Then start from what you already run. Playwright tests in Git point to Checkly, an existing Datadog contract points to Datadog synthetics, and k6 scripts point to Grafana Cloud. If none of those apply and you'd otherwise buy PagerDuty and Statuspage too, Hyperping or Better Stack saves you the second and third vendor.
Other credible options
Playwright and code-first tools
| Tool | Main strength | Main limitation | Good for |
|---|---|---|---|
| Sematext Synthetics | Playwright journeys and private locations | Scripts capped at 32 KB; Terraform doesn't create synthetics | People already using Sematext |
| OpenObserve | Playwright, recorder, and private locations | Synthetic monitoring is in beta | OpenObserve users who can live with a beta |
| Elastic Synthetics | Chromium journeys with managed or private runners | Needs an Elastic deployment | People already on Elastic |
| Amazon CloudWatch Synthetics | Playwright, Puppeteer, or Selenium canaries in AWS | IAM, Lambda, and artifact setup | AWS-only setups |
| OnlineOrNot | Simple browser checks with uptime and status pages | 2-minute Playwright run cap; scripts live in the UI | Small sites that need a few simple journeys |
| OneUptime | Open-source checks, on-call, and status pages | A whole ops platform to run | Self-hosters who want on-call too |
Recorder-first and website-health tools
| Tool | Main strength | Main limitation | Good for |
|---|---|---|---|
| Pingdom | Established Chrome transaction recorder and RUM | Less flexible than Playwright; price rises with checks | People already on SolarWinds |
| Uptrends | Recorder, 230-plus checkpoints, and Terraform | Credit-based pricing and a high entry cost | Large sites that need many checkpoints |
| Oh Dear | Playwright journeys inside per-site health monitoring | Per-site pricing hurts large inventories | Agencies with a handful of client sites |
| Dotcom-Monitor | Real-browser ecommerce transaction monitoring | EveryStep and UserView first; Playwright import is .NET only | Stores already using EveryStep scripts |
| RapidSpike | Checkout journeys and managed scripting | Sales-led and narrowly focused | Ecommerce stores that want scripts written for them |
| Vigilant | Plain-language flows and AGPL self-hosting | Plain-language flows instead of Git-owned Playwright | Self-hosters who'd rather describe flows in words |
Enterprise observability and digital experience
| Tool | Main strength | Main limitation | Good for |
|---|---|---|---|
| New Relic Synthetics | Synthetics next to APM and NRQL data | Scripted-browser format is less portable | People already on New Relic |
| Dynatrace | Clickpaths and Davis AI correlation | Cost, setup, and enterprise footprint | People already on Dynatrace |
| Catchpoint, now part of LogicMonitor | Large agent network and network-path diagnosis | Enterprise procurement | Network reliability engineers |
| Cisco ThousandEyes | ISP paths and SaaS outage visibility | Network monitoring more than Playwright | Network engineers in Cisco shops |
| Splunk Synthetics | Browser checks next to Splunk logs and APM | Splunk contract and platform scope | People already on Splunk |
| AppDynamics | Enterprise APM with synthetic coverage | Heavyweight and less browser-first | People already on AppDynamics |
Uptime-first tools with lighter browser coverage
| Tool | Main strength | Main limitation | Good for |
|---|---|---|---|
| UptimeRobot | Large free uptime allowance and easy setup | Browser journeys are limited or missing by plan | Uptime checks on a free plan |
| StatusCake | Uptime and page-speed checks | No Playwright journeys | Uptime plus page speed on a small budget |
| Xitoring | Low-cost uptime, SSL, and server monitoring | No real-browser journeys | Cheap uptime and server checks |
| OpenStatus | Open-source uptime and status pages | Uptime instead of browser journeys | People who want an open-source status page |
Page-speed tools
| Tool | Main strength | Main limitation | Good for |
|---|---|---|---|
| DebugBear | Core Web Vitals, filmstrips, and CrUX | Measures speed, not login or checkout | Tracking Core Web Vitals |
| SpeedCurve | Performance budgets and competitor benchmarks | Doesn't check login or checkout logic | Performance budgets across releases |
| Calibre | Performance CI and Core Web Vitals budgets | Page-speed focus | Speed checks in CI |
| WebPageTest | Deep browser diagnostics and experiments | Monitoring comes second to diagnostics | One-off deep performance investigations |
Self-hosted and protocol probes
| Tool | Main strength | Main limitation | Good for |
|---|---|---|---|
| Uptime Kuma | Free and easy to self-host | No multi-step browser journeys | Homelabs and small self-hosted setups |
| Playwright on a cron | Complete control and portable tests | You run every part of it yourself | People who'll own runners, retries, and alerting |
| Prometheus Blackbox Exporter | Free HTTP, TCP, ICMP, and TLS probes | No browser engine | People already on Prometheus |
PagerDuty routes incidents and doesn't run checks. Zabbix, Nagios, Prometheus, and Netdata focus on infrastructure and protocol checks, Ghost Inspector and BugBug are QA recorders, and "transaction monitoring" for bank fraud is a different category.
How to test synthetic monitoring tools
Every tool on the shortlist has a free plan, a trial, or a money-back guarantee:
- Hyperping: free plan without browser checks, and a 14-day trial of paid plans, which include 3 to 25 browser checks
- Checkly: free Hobby plan with 1,000 browser runs a month, no credit card
- Datadog: 14-day trial
- Grafana Cloud: free tier with 10,000 browser executions a month
- Better Stack: free plan with 10 monitors and 1 status page; Playwright minutes are $1 per 100, with a 60-day money-back guarantee
- Site24x7: 30-day free trial, no credit card
- Uptime.com: no free plan, 30-day money-back guarantee
A green homepage won't tell you how the product pages. Break things on purpose:
- Create three journeys: login, the action that makes money, and one critical API chain. Give each a named owner and an isolated test account.
- Break one selector with a harmless UI change. Check whether the failure names the step and captures enough evidence to fix the monitor quickly.
- Return HTTP 200 while the final action fails, to confirm the monitor checks the end state and not only that the page loaded.
- Run the same journey from two or more locations, then block one region. See whether the alert tells a regional failure from a global one.
- Expire or revoke the test account. See how clearly a login-data failure stands apart from a product failure.
- Ignore an alert. Confirm who gets it, whether it escalates, and how acknowledging it stops the paging.
- Price the exact schedule after the trial: checks times runs per day, locations, runtime, retention, and responder seats. Five checks every five minutes is 43,200 runs a month.
- Change a shared page object or UI component. Count how many monitors need fixing and whether changes can be reviewed before they go live.
Give every monitor a named owner, an isolated test account, and a reason to exist. A check nobody trusts gets muted, whatever product runs it.
Related reading
- Hyperping synthetic monitoring: Playwright browser checks, Web Vitals, on-call and status pages
- Hyperping browser checks docs: how to create Playwright-based synthetic checks
- Hyperping as a Checkly alternative: a focused comparison for Playwright monitoring
- Choosing the right uptime checks: where browser journeys fit next to HTTP, DNS, port, and SSL checks
- Hyperping pricing: browser-check allowances by plan
FAQ
What are the best synthetic monitoring tools? ▼
The best synthetic monitoring tools are Hyperping for browser checks with on-call and status pages, Checkly for Playwright monitoring as code, Datadog for failed journeys next to logs and traces, Grafana Cloud for people who already write k6, Better Stack for browser checks inside a wider incident workflow, Site24x7 for no-code recording and 130-plus locations, and Uptime.com for enterprise website monitoring with private locations.
What is synthetic monitoring? ▼
Synthetic monitoring runs scheduled checks that act like a user or client on your website, application, or API. A browser check can log in, fill a form, add an item to a cart, and confirm checkout still works before a customer reports it.
What is the difference between synthetic monitoring and uptime monitoring? ▼
Uptime monitoring checks one endpoint for a status code, keyword, port, DNS record, or certificate. Synthetic monitoring runs a multi-step browser or API journey and asserts that each step works, so it catches a homepage that returns HTTP 200 while login or checkout is broken.
What is the difference between synthetic monitoring and real user monitoring? ▼
Synthetic monitoring sends scripted traffic on a schedule, so it can catch a failure before a real user hits it. Real user monitoring records what actual visitors experienced on their own browsers, devices, and networks. Synthetic checks are repeatable and RUM reflects production traffic, so plenty of people run both.
Can I run Playwright tests as synthetic monitors? ▼
Yes. Checkly, Hyperping, Better Stack, and OpenObserve run Playwright browser checks. You can also run Playwright on a cron, but then you own the runners, retries, regions, alert routing, failure storage, and upkeep.
How much does synthetic monitoring cost? ▼
Five browser checks every five minutes from one location is 43,200 runs a month. That's $74/month on Hyperping Pro, about $188 on Checkly Starter with extra runs, about $185 on Grafana Cloud Pro, about $245 on Better Stack, and about $518 on Datadog at $12 per 1,000 browser runs. Site24x7's Web Perf pack covers it at $36/month.