
The best Redis monitoring setup usually combines more than one tool. Use Prometheus with redis_exporter and Grafana for open-source metrics and alerts, Redis Insight when you need to inspect keys and slow commands, Datadog when Redis failures need to connect to application traces and logs, Sematext for a lower-cost hosted Redis integration, Netdata for per-second host and Redis charts, ManageEngine Applications Manager for on-premises IT ops, and Hyperping for the health of a self-hosted Redis machine, outside-in availability, and incident response.
I analyzed 32 products and shortlisted seven. "Redis monitoring" covers four different jobs: continuous INFO metrics, interactive inspection, reachability, and host health, and each tool on the shortlist does at least one of them well. Load testers, dead GUIs, and alert routers that don't collect Redis metrics are further down.
Prices were checked in August 2026. Ten Redis hosts on Datadog Infrastructure Pro is $150/month on annual billing, before APM and logs. Sematext Standard is $3.60/host, about $36/month for the same ten. Prometheus and Redis Insight are free software.
| Tool | Best for | Starting price | Main limitation |
|---|---|---|---|
| Prometheus + redis_exporter + Grafana | Open-source Redis and Valkey metrics | Free software | You operate the monitoring stack |
| Redis Insight | Interactive inspection and debugging | Free | Limited history and no complete alerting workflow |
| Datadog | Redis next to APM, logs, and traces | $15/host/mo | Cost and platform complexity |
| Sematext | Hosted Redis monitoring at a lower host price | $3.60/host/mo | 7-day Standard retention; published Redis catalog is a small INFO subset |
| Netdata | Per-second host and Redis visibility | Free open-source agent; Cloud plans extra | Long-term and centralized features depend on deployment |
| ManageEngine Applications Manager | On-premises and hybrid IT operations | Free for 5 monitors; Pro from $945/year | Heavier interface and setup |
| Hyperping | Redis host health, availability, and on-call | $24/mo | No Redis INFO or per-process metrics; needs a Redis collector |
Why trust this guide
I'm Léo, founder of Hyperping. Yes, that means I have a stake in one of these tools. But I've watched teams pick competitors when they were the better fit, and I'm not going to pretend otherwise. My goal isn't to convince you Hyperping is always the answer. It's to help you understand which tool actually solves your problem.
I went through vendor docs, pricing pages, G2 reviews, and Redis's command documentation in August 2026.
What is Redis monitoring?
Most collectors pull fields from the INFO command and store them as time series. That still misses the host Redis runs on, the client waiting in a connection pool, and whether anyone got paged. A production setup needs Redis itself, the machine or managed service under it, and the application that talks to it.
Keep MONITOR out of that setup. Redis's own docs report that one MONITOR client cut throughput by more than 50% in its published benchmark, so leave it for a short debug session with a timeout and use INFO, SLOWLOG, and latency metrics for continuous watching.
The failures Redis monitoring should catch:
- Memory pressure:
used_memoryagainstmaxmemory,evicted_keysversusexpired_keys, andallocator_frag_ratiowith fragmented bytes. Redis documentsallocator_frag_ratioas the real allocator signal.mem_fragmentation_ratiois RSS divided by Redis allocation and includes code, libraries, and stacks. - Cache miss: hit ratio falling, read beside evictions so you can tell capacity from a bad key pattern.
- Latency: slow log, per-command percentiles, main-thread CPU,
latest_fork_usec. - Clients:
blocked_clients,rejected_connectionsatmaxclients, and the application pool that INFO can't see. - Replication:
master_link_status, lag,sync_full. Repeated full resyncs usually mean a backlog that's too small or replicas that keep restarting. - Persistence:
rdb_last_bgsave_status,aof_last_write_status, andaof_last_bgrewrite_statusfail independently. - A hot shard: cluster-wide averages look fine while one node is using most of its memory.
- Host death: RAM, a full data mount, disk I/O. Redis INFO won't tell you the disk filled up.
- The app can't reach Redis: TCP or an internal health endpoint. Don't open port 6379 to the internet to get that signal.
| Command or subsystem | Use it for | Continuous monitoring? | Main caveat |
|---|---|---|---|
INFO |
Memory, clients, stats, CPU, replication and persistence | Yes | Bare INFO omits commandstats and latencystats |
SLOWLOG |
Commands whose execution exceeded the configured threshold | Yes, sampled carefully | Excludes socket I/O and keeps a bounded in-memory list |
| Latency monitor | Named latency events such as fork, eviction cycle and AOF fsync | Yes after configuration | Disabled by default |
| Extended latency tracking | Per-command latency percentiles | Yes | On by default in Redis OSS but absent from bare INFO |
MONITOR |
Short investigation of every command being executed | No | Heavy throughput and output-buffer cost |
A bare INFO call doesn't return commandstats or latencystats. Ask for those sections explicitly or collect INFO all. The slow log defaults to 10,000 microseconds (10 milliseconds) and measures command execution, not the time to ship a large reply over the network.
What people actually need
Keys vanished and the dashboard still looked fine
Expiry means a TTL worked. Eviction means Redis hit maxmemory and threw data away, or rejected writes under noeviction. Redis documents evicted_keys and expired_keys separately, and allocator_frag_ratio as the fragmentation number that isn't polluted by RSS overhead.
If you only alert on mem_fragmentation_ratio, a small instance will page someone over a few megabytes.
One shard is on fire, the cluster average is not
Collect every node. A cluster-wide memory or ops average can hide a hot shard. You also want slot coverage, role, failover, and per-node latency. Prometheus, Datadog, and Redis Insight all do this if you point them at the nodes, and a single chart for the whole cluster won't show it.
I need to see which keys are huge
Dashboards tell you memory is growing. They don't tell you the key pattern. That's Redis Insight: browse keys and TTLs, run the memory analysis, open the slow log, profile a short window. It isn't a 24/7 alerting system, so pair it with Prometheus or a hosted collector.
Redis looks healthy and the app is still down
INFO reports connected clients. It doesn't report a pool waiting inside the application, network round-trip, or local-cache hits that never reached Redis. Redisson's 2026 metrics writeup covers that gap from the client side. Datadog and other APM products catch it. redis_exporter doesn't, unless you scrape the app too.
I already pay for Datadog, and the bill keeps moving
Cost is the complaint I see most on Datadog. From an April 2026 G2 review:
"Datadog is costly, and the expenses may increase quicker than you anticipate."
Ten Redis hosts is $150/month for Infrastructure Pro on annual billing, before APM and logs. If Redis is the only thing you wanted to watch, Prometheus or Sematext is the cheaper collector. If responders already live in Datadog, adding the Redis integration is still the smaller decision.
Don't open 6379 just to ping it
Redis should stay on a private network. Hyperping's public probes can't reach a VPC Redis node, and they shouldn't. The safer pattern is an authenticated application health endpoint that runs a lightweight PING or a small read/write internally, then returns success or failure for an outside check. A TCP handshake also doesn't prove Redis can execute commands.
Managed Redis adds another wrinkle. CONFIG is unavailable on ElastiCache and Azure Cache. ElastiCache Serverless also blocks SLOWLOG, MONITOR, LATENCY, COMMANDLOG, and the MEMORY family. A dashboard built for self-hosted Redis can show empty panels even when the collector connects.
Redis monitoring capability comparison
The biggest difference is what each tool can see: INFO history for Prometheus, keys for Redis Insight, Redis next to traces for Datadog, and the host plus the outside path for Hyperping.
| Capability | Prometheus stack | Redis Insight | Datadog | Sematext | Netdata | ManageEngine | Hyperping |
|---|---|---|---|---|---|---|---|
| INFO metrics and history | Yes | Live view, limited history | Yes | Yes | Yes | Yes | No |
| Redis memory and evictions | Yes | Yes | Yes | Yes | Yes | Yes | No; host RAM only |
| Hit ratio and clients | Yes | Yes | Yes | Yes | Yes | Yes | No |
| Replication metrics | Yes | Yes | Yes | Yes | Documented collector coverage | Yes | No |
| Slow command visibility | Depends on exporter version | Slow log and profiler | Slowlog percentiles | Not listed in Redis docs | Slowlog fields documented | Slow query monitoring | No |
| Host CPU, RAM, disk and network | Node exporter or agent | No | Yes | Yes | Yes | Yes | Hyperping server agent only |
| Alerts and history | Alertmanager and Prometheus | Limited | Yes | Yes | Yes | Yes | Availability and host alerts only |
| Interactive key browser | No | Yes | No | No | No | No | No |
| APM and trace correlation | Separate stack | No | Yes | Yes | Limited | Application dependency monitoring | No |
| Outside-in availability | Add Blackbox Exporter | No | Service check and synthetics | Availability monitoring | Service checks | Availability monitoring | TCP or HTTP health check |
| Deployment | Self-hosted or managed components | Desktop, Docker, Kubernetes or EC2 | SaaS agent | SaaS agent | Open-source agent and Cloud | Self-hosted software | SaaS probes and optional host agent |
Slow-log and latency coverage differs across exporter versions and plans, so confirm the exact fields during a trial.
What ten Redis instances can cost
Take ten Redis or Valkey instances that need internal metrics, dashboards, retention, and alerts, without application tracing, log ingestion, cloud infrastructure, or staff time. This is my estimate from public pricing.
| Tool | Published pricing applied to the scenario | Approximate monthly result | What is missing or variable |
|---|---|---|---|
| Prometheus + redis_exporter + Grafana OSS | Free software | $0 license | Compute, storage, backups, HA and staff time |
| Redis Insight | Free | $0 | Complete alerting, long-term history and on-call |
| Datadog Infrastructure Pro | $15 per host/mo | $150 | APM, logs and other Datadog products |
| Sematext Standard | $3.60 per host/mo | $36 | Standard includes 7 days of retention |
| Netdata | Open-source agent; Cloud plan varies | $0 self-hosted license | Centralization, retention and enterprise features depend on deployment |
| ManageEngine Professional | $945/year for 25 monitors and one user | $78.75 | Assumes each Redis instance counts as one monitor; confirm licensing |
| Hyperping Essentials | $24/mo with 5 server agents, plus $2/mo for each of 5 extra ones | $34 | Host health and availability only; Redis metrics need a separate collector |
Prometheus and Redis Insight are cheapest on license, but you pay for the servers and the person who runs them. Among hosted collectors, Sematext comes out at about $36/month against Datadog's $150, and Datadog adds APM and logs on top. Hyperping's $34 covers host health, outside checks, and on-call for ten machines, so add it to whichever collector you pick.
The Prometheus stack is the default for people who already operate it. Storage, upgrades, alert rules, retention, and high availability still need owners.
Prometheus, redis_exporter, and Grafana: Best open-source Redis monitoring stack
Prometheus with redis_exporter is the standard open-source answer for continuous Redis metrics. The exporter connects to Redis or Valkey, exposes metrics for Prometheus, and ships with Grafana dashboard examples. Alertmanager handles routing.
| Best for | Starting price | Main limitation |
|---|---|---|
| People already using Prometheus or Kubernetes | Free software | You own the monitoring system |
Who Prometheus is built for
Platform and SRE groups that already scrape exporters. Kubernetes shops land here by default. A five-person company standing this up only for Redis will spend the month running Prometheus instead of watching Redis.
The oliver006/redis_exporter repo is actively maintained and supports Redis and Valkey 7, 8, and 9.
Notable features
- redis_exporter. Runs on port 9121 and exposes more than 50 useful metrics for Prometheus to scrape.
- Valkey 7, 8, and 9. Same collector path as Redis.
- Grafana dashboards. Examples ship in the exporter repo.
- Alertmanager. Routing you already know if you run Prometheus.
- Metric names. They aren't 1:1 with INFO:
sync_fullbecomesredis_replica_resyncs_full. - Operations. You run storage, retention, HA, and access control.
- Community project. It isn't an official Redis Ltd product, and Redis Software has a different built-in Prometheus endpoint.
Why choose Prometheus for Redis monitoring?
It's the portable collector. You get memory, evictions, clients, commands, replication, persistence, and keyspace stats, and the data stays with you instead of inside Datadog or Sematext.
The dashboards already exist. Grafana examples ship with the exporter. You still have to write alert rules for your workload, and a rule written against a guessed INFO field name never fires.
The software is free. Ten instances cost $0 in license, though you still pay for disks, backups, and the person who gets the 3am Alertmanager page.
How much does Prometheus cost?
- Software: free (Prometheus, Grafana OSS, redis_exporter)
- Running costs: compute, storage, backups, HA, and staff time
Ten Redis instances on Prometheus cost $0 in license. Budget the box and the on-call for Alertmanager separately.
Where Prometheus falls short
You operate the exporter, Prometheus, storage, retention, Alertmanager, Grafana, access control, backups, and high availability. You'd still want Redis Insight to browse keys, Hyperping or Blackbox Exporter for the outside-in check, and Datadog if Redis metrics need traces in the same UI.
Is Prometheus right for you?
Choose this stack if Prometheus is already part of your infrastructure or open metrics matter. Skip it if nobody wants to own the monitoring backend.
Redis Insight: Best for interactive inspection and debugging
Redis Insight is the official free GUI for Redis. It runs as a desktop application and can also be deployed through Docker, Kubernetes, or EC2.
| Best for | Starting price | Main limitation |
|---|---|---|
| Developers investigating a live Redis instance | Free | It doesn't replace historical metrics and alerts |
Who Redis Insight is built for
Whoever gets the Slack message "memory is climbing" and has to find the key pattern, usually a developer or an on-call engineer who opens a GUI for 20 minutes. If you're trying to replace Prometheus, look elsewhere.
Notable features
- Key browser. Keys, TTLs, and values.
- Memory analysis. Shows which key patterns are responsible for growth.
- Slow log. Commands that crossed the threshold.
- Profiler. Live traffic, with the same caution as other command streaming.
- Cluster and Sentinel views. Topology for production clusters.
- Workbench. Run commands against the instance.
- Deployment. Desktop, Docker, Kubernetes, or EC2.
Why choose Redis Insight for Redis monitoring?
It's the tool you open when a graph isn't enough. Prometheus and Datadog will tell you used memory went up, and Insight shows you the keys behind it.
It's free and official. Another Redis Desktop Manager and Tiny RDM are GUI alternatives in the list below, but Insight is the one Redis Ltd ships.
It supports Cluster and Sentinel. You can point it at your production topology as well as localhost.
How much does Redis Insight cost?
Redis Insight is free, so ten instances cost $0. You still need a metrics product for history and alerts.
Where Redis Insight falls short
Historical retention, proactive alerting, escalation, and incident workflow are limited next to Prometheus or Datadog. The profiler needs the same caution as MONITOR: production traffic can be sensitive and expensive to stream. Sematext and Netdata don't have a key browser either, so keep Insight next to whichever collector you pick.
Is Redis Insight right for you?
Choose Redis Insight as the debugging companion to another monitoring system. For a small development environment it may be enough on its own. Skip it as your only production monitor.
Datadog: Best for Redis connected to APM, logs, and infrastructure

Datadog's Redis integration collects Redis metrics through the Datadog Agent and includes a redis.can_connect service check. It supports standalone, Cluster, and Sentinel. Published Infrastructure Pro pricing is $15/host/month on annual billing.
| Best for | Starting price | Main limitation |
|---|---|---|
| People already using Datadog | $15/host/mo | APM and logs are billed extra |
Who Datadog is built for
Companies that already have a Datadog contract, and whose Redis incidents usually need a trace, a deploy, or a log line. If Redis would be the only Datadog product, look at Prometheus or Sematext first.
Notable features
- Redis metrics. More than 50, covering memory, throughput, evictions, clients, replication, persistence, and optional command statistics.
- Service check.
redis.can_connectruns alongside the metrics. - Slowlog percentiles. Documented on the integration.
- Host metrics. Collected by the same agent.
- Cluster and Sentinel. Both are supported deployments.
- Billing. Standard Redis integration metrics aren't billed as custom metrics, per Datadog's integration docs.
- APM and logs. Separate products, which is where the bill usually grows.
Why choose Datadog for Redis monitoring?
A Redis blip sits next to the trace. With Prometheus you'd open three other tabs to find the request that hit it. If most Redis incidents need application context, redis_exporter alone leaves you switching tools anyway.
The host is in the same agent. Datadog's agent collects host metrics and Redis INFO together, like Netdata does locally, while Hyperping's agent is host-only.
You're probably already paying for the rest of it. Adding Redis to an existing contract is a smaller decision than introducing Prometheus. It's still $150/month for ten hosts before APM and logs.
What users say
Reviewers complain about cost and praise having logs, metrics, and traces in one place. From an April 2026 G2 review:
"Datadog is costly, and the expenses may increase quicker than you anticipate."
From a July 2026 G2 review:
"One of the biggest strengths of Datadog is how it brings logs, metrics, traces, and alerts into a single platform."
How much does Datadog cost?
- Infrastructure Pro: $15/host/month. APM, logs, custom retention, and other products are extra.
Ten Redis hosts on Datadog cost about $150/month for infrastructure, before APM and logs.
Where Datadog falls short
The bill grows with hosts, logs, and APM, and reviewers mention platform complexity next to cost. Prometheus is cheaper if you already run it, and Sematext is cheaper as a focused hosted collector. You'd still use Redis Insight to browse keys and Hyperping for an independent outside-in check and a customer status page.
Is Datadog right for you?
Choose Datadog if it's already the company's observability platform or Redis incidents require trace and log correlation. Skip it if you only needed Redis INFO and didn't want the rest of the platform.
Sematext: Best lower-cost hosted Redis monitoring
Sematext Monitoring combines Redis metrics, host metrics, logs, dashboards, anomaly detection, and alerts in a hosted product. Standard starts at $3.60 per host per month.
| Best for | Starting price | Main limitation |
|---|---|---|
| Hosted Redis metrics without a large observability contract | $3.60/host/mo | 7-day Standard retention; published Redis catalog is a small INFO subset |
Who Sematext is built for
Smaller groups that want dashboards and alerts without running Prometheus, and without Datadog's host price, on bare metal, VMs, or containers. If you need APM correlation like Datadog's, look there instead.
Notable features
- Redis integration. Memory, clients, hit and miss ratio, evictions, commands, and replicas.
- OS metrics. In the same product.
- Logs. Documented next to the metrics.
- Service discovery. Automatic.
- Dashboards and alerts. Prebuilt dashboards and customizable alerts.
- Standard plan. $3.60/host/month with 7 days of monitoring retention.
Why choose Sematext for Redis monitoring?
It's the cheapest hosted collector here. Ten hosts is about $36/month on Standard, against $150/month on Datadog Infrastructure Pro before APM and logs.
It's hosted. You don't operate Prometheus, though you give up Prometheus's control over retention and rules.
Logs sit next to Redis metrics. ManageEngine is weaker here, and Datadog is stronger only if you already send everything there.
How much does Sematext cost?
- Standard: $3.60 per host per month, 7 days of monitoring retention
Confirm current pricing on Sematext's site. Ten Redis hosts on Standard cost about $36/month. Seven days of retention may be too short for capacity planning or monthly incident review, so price the retention you actually need.
Where Sematext falls short
The published Redis integration lists memory, keyspace hits and misses, evictions, connected clients, commands processed, replica count, and master last-IO age. Persistence status, blocked and rejected clients, commandstats, and slow log aren't on that page. Sematext's own Redis roundup mentions slow-log features, so confirm what actually lands in the trial.
Prometheus gives more control over what you scrape, and Datadog has stronger trace correlation. You'd still want Redis Insight as the GUI, and Hyperping if you want on-call and a status page outside the collector.
Is Sematext right for you?
Choose Sematext if you want a dedicated hosted integration with metrics, logs, and alerts at a lower published host price. Skip it if you already live in Datadog, or if you wanted to own the Prometheus backend.
Netdata: Best for per-second Redis and host visibility
Netdata's Redis collector adds Redis to an open-source agent known for per-second infrastructure charts and automatic discovery.
| Best for | Starting price | Main limitation |
|---|---|---|
| Immediate local and host-level visibility | Free open-source agent | Central retention and team features depend on the chosen deployment |
Who Netdata is built for
Operators watching a live incident, where a one-minute average hides a brief CPU or connection spike. It suits people who want the agent on the box, auto-discovery, and Redis plus the host in one view.
Notable features
- Per-second charts. For both the host and Redis.
- Auto-discovery. Less manual exporter setup than Prometheus.
- Redis collector. Charts plus slowlog fields.
- Host resources. CPU, memory, disk, network, and containers.
- Open-source agent. Runs locally.
- Netdata Cloud. Centralized views, collaboration, longer retention, and enterprise controls.
Why choose Netdata for Redis monitoring?
Per-second charts catch short spikes. Prometheus scrape intervals and Datadog rollups can hide a spike Netdata will draw.
The agent finds Redis. You write less YAML than with redis_exporter and node_exporter if you're starting from a single host.
The agent is free. Cloud, longer retention, and air-gapped controls cost money or setup time.
What users say
G2 reviewers praise the per-second host charts the Redis plugin sits on. From a May 2025 G2 review:
"I've been using Netdata for infrastructure monitoring across multiple servers, and I must say it delivers exceptional real-time visibility into system health. The per-second granularity and wide range of pre-configured metrics make it incredibly valuable for detecting and resolving performance issues quickly."
How much does Netdata cost?
Checked on Netdata's pricing page in September 2026:
- Open-source agent: $0
- Netdata Cloud Community: free for 5 nodes
- Business: $4.50 per node per month ($54/year for one node), with a 14-day Business trial at sign-up
Ten Redis hosts cost $0 in license on the self-hosted agent, or about $45/month on Business if you need a shared view.
Where Netdata falls short
Central retention, HA, and access control depend on how you deploy it. Prometheus is stronger as a standardized metrics platform with long-lived custom alert rules, and Datadog is stronger for traces. Redis Insight still covers keys, and Hyperping covers on-call and the customer-facing status page.
Is Netdata right for you?
Choose Netdata if per-second host and Redis charts matter more than a large APM product. Skip it if you needed a year of PromQL rules and a multi-team Grafana org on day one.
ManageEngine Applications Manager: Best for on-premises and hybrid IT operations
ManageEngine Applications Manager monitors Redis beside servers, containers, applications, databases, and cloud services from software deployed on Windows or Linux.
| Best for | Starting price | Main limitation |
|---|---|---|
| IT groups managing mixed on-premises and cloud systems | Free for 5 monitors; Pro from $945/year | Interface and setup are heavier than focused tools |
Who ManageEngine is built for
IT operations groups that can't send monitoring data to a SaaS platform and already think in monitors, service desks, and mixed estates. A five-person startup that wanted redis_exporter and Grafana will find it heavy.
Notable features
- Redis plus the host. Redis next to the supporting server or container.
- Redis metrics. Memory, fragmentation, hit ratio, blocked clients, evictions, and persistence.
- Dependency maps. Redis appears in the application dependency view.
- Alerts. Email, SMS, Slack, PagerDuty, or connected service-desk workflows.
- On-premises install. Windows or Linux.
- Free edition. 5 monitors.
- Professional. $945/year for 25 monitors and one user.
Why choose ManageEngine for Redis monitoring?
The data stays on your side of the firewall. Datadog and Sematext send data to SaaS, and Prometheus stays on-prem only if you operate it yourself. ManageEngine is packaged on-prem software.
Redis sits next to the rest of the estate. Servers, containers, apps, and databases share one console, which suits an IT ops department more than a Redis specialist.
There's a real free tier. Five monitors is enough to trial it. Professional is $945/year for 25 monitors and one user, about $78.75/month.
What users say
Reviewers talk about database and middleware templates, and complain about licensing. From a June 2026 G2 review:
"No dislikes as such with this product but licensing module is complex with multiple options to select from."
How much does ManageEngine cost?
- Free: 5 monitors
- Professional: $945/year for 25 monitors and one user, with custom dashboards, thresholds, and remote monitoring
Ten Redis instances on Professional is about $78.75/month if each instance is one monitor. Confirm how standalone instances, cluster nodes, and supporting hosts are counted. Licensing depends on monitor count, edition, and users.
Where ManageEngine falls short
More configuration and a heavier interface than Redis Insight, Sematext, or Netdata. Correlation between Redis metrics and Redis logs is limited. Datadog and Sematext are easier SaaS choices, and Prometheus fits people already standardized on open metrics. Redis Insight still covers keys.
Is ManageEngine right for you?
Choose ManageEngine if you need Redis inside an on-premises IT monitoring suite. Skip it if you wanted a focused Redis collector or a GUI.
Hyperping: Best for Redis host health and outside-in availability
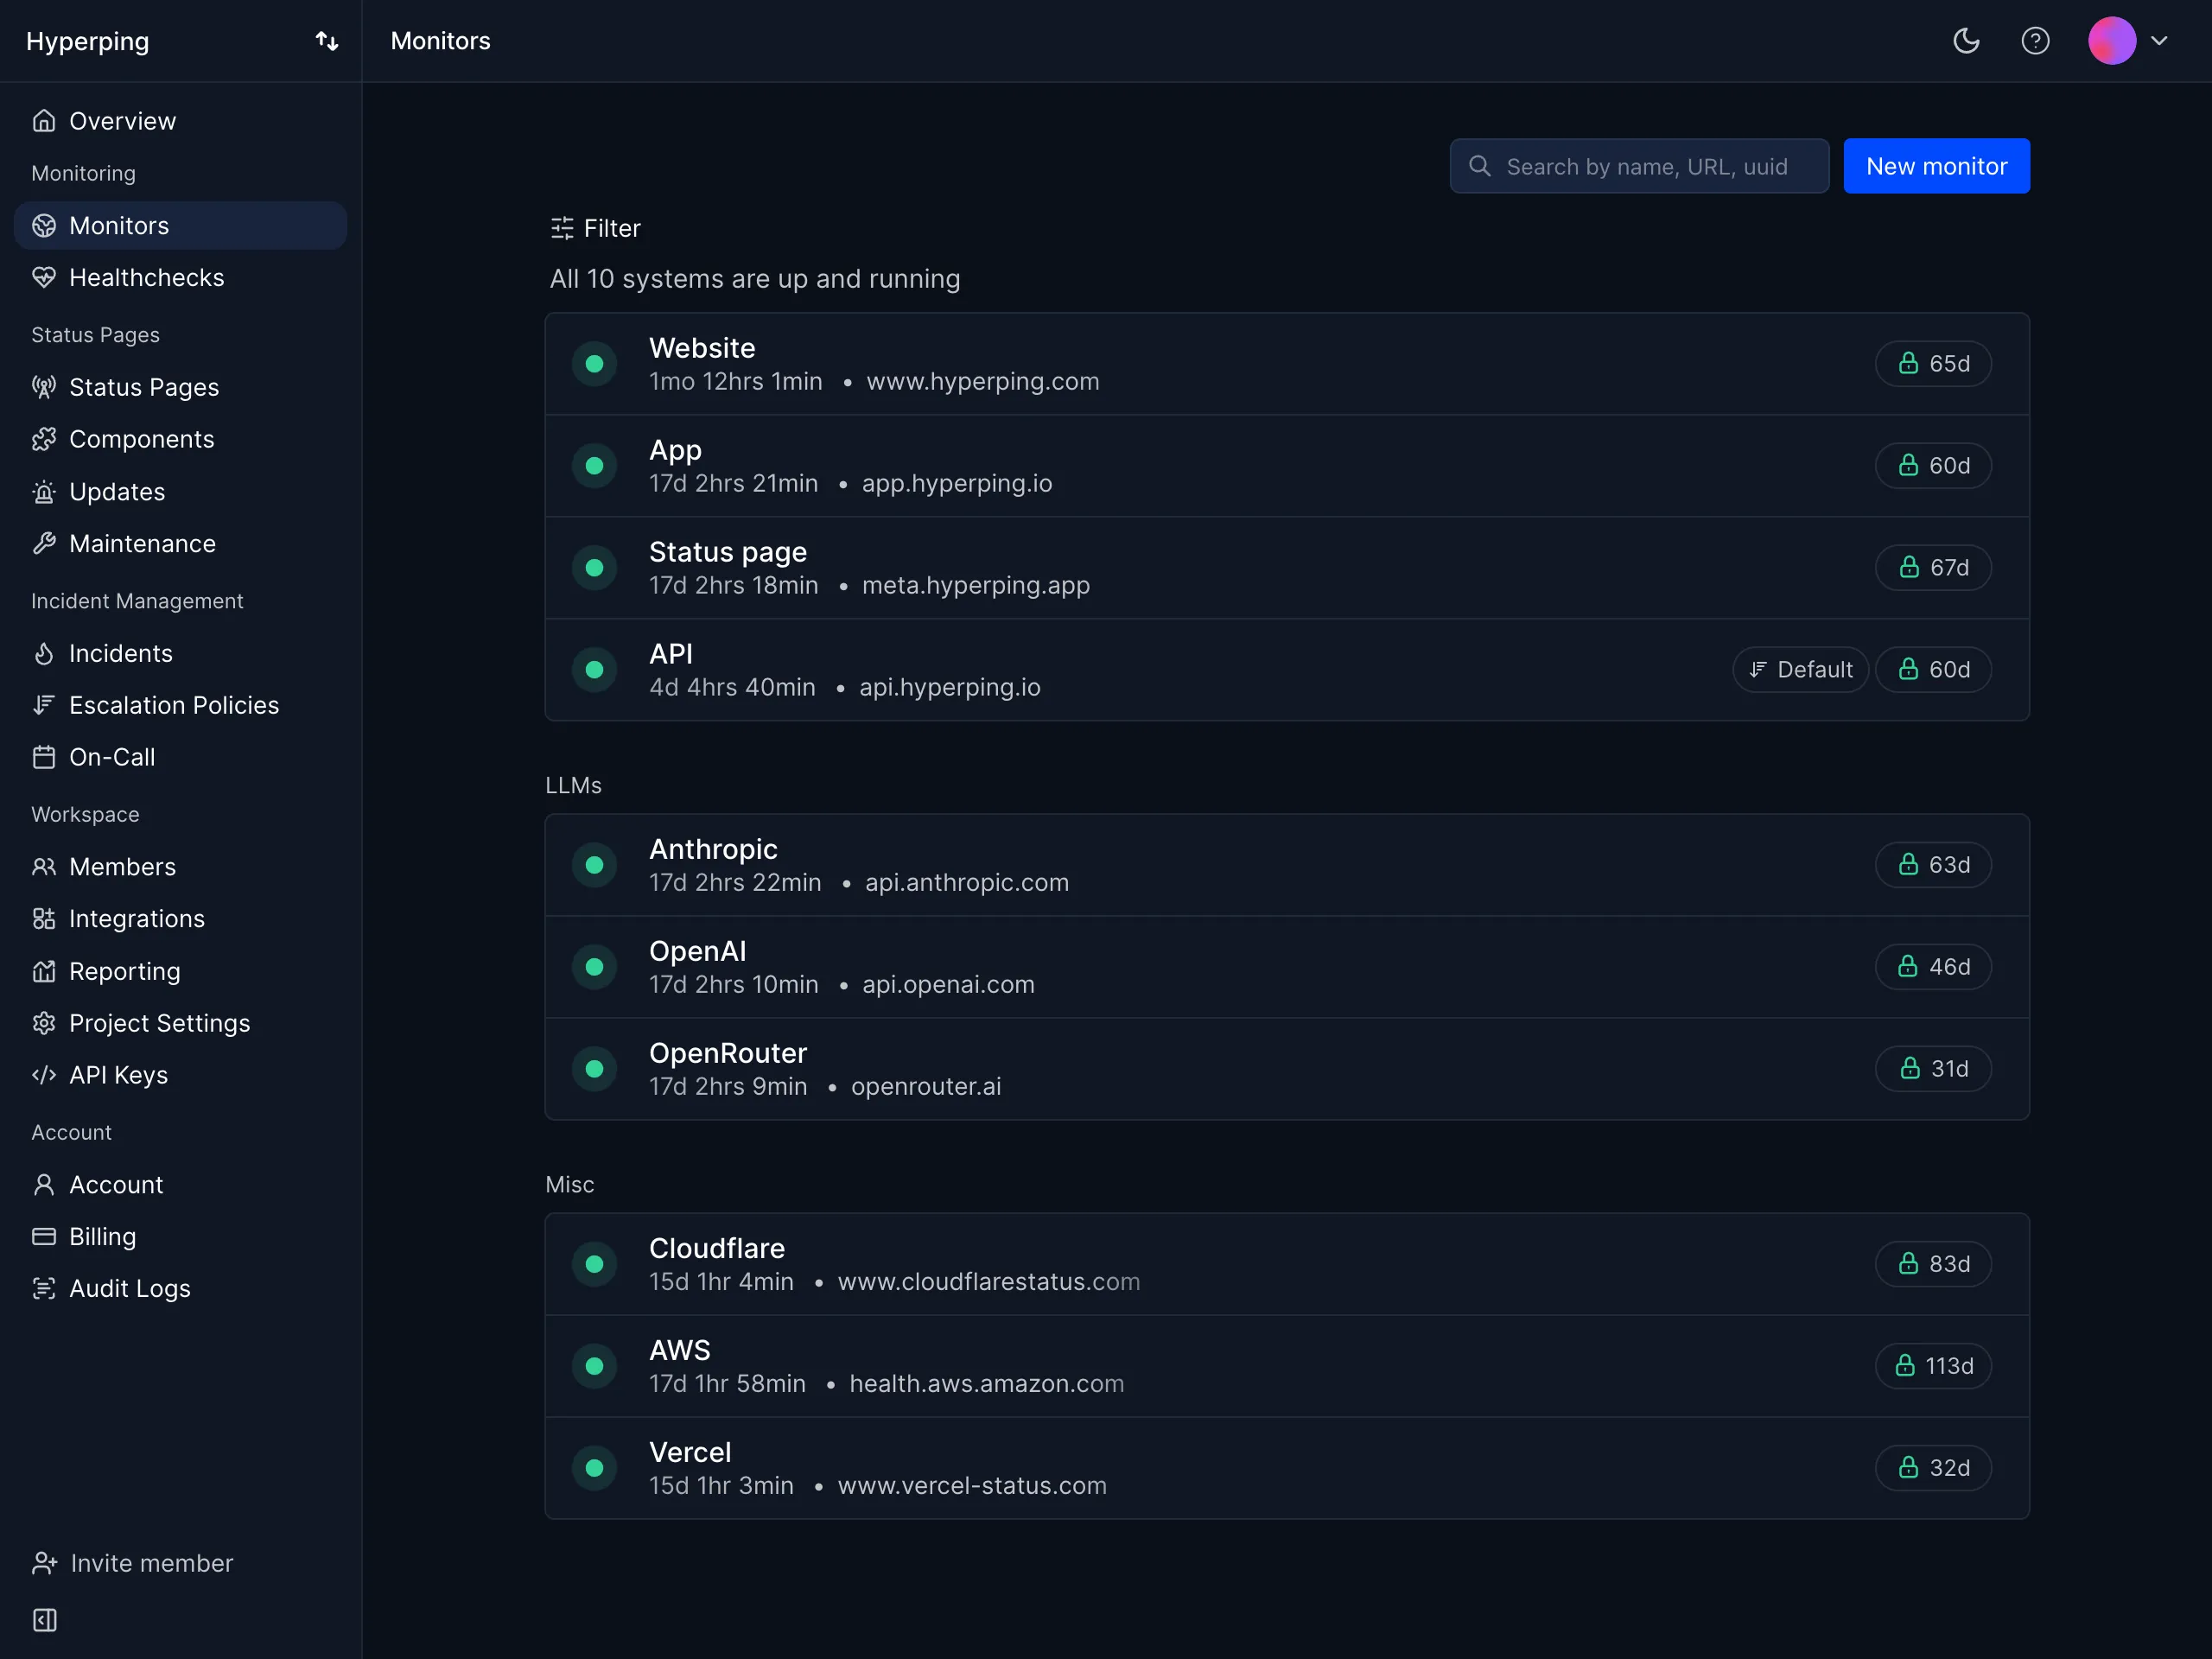
Hyperping monitors the Linux/macOS host Redis runs on and can check the dependency path from outside. I built it around the path from a failed check to a person and then to the customer. It doesn't collect Redis INFO.
| Best for | Starting price | Main limitation |
|---|---|---|
| Host health, dependency availability, and incident response beside a Redis collector | $24/mo | No Redis INFO or per-process metrics |
Who Hyperping is built for
People who already have (or will have) a Redis collector, and still want host CPU/RAM/disk, an outside check on the app path, and on-call plus a status page. It fits self-hosted Redis on a Linux or macOS VM you control. It doesn't fit ElastiCache, and it doesn't replace Datadog's Redis integration.
Alma already runs Datadog and keeps Hyperping as a second opinion from outside the cluster.
Notable features
- Server agent. CPU and load, RAM, filesystem space, disk I/O, and network, collected every 30 seconds on Linux/macOS.
- Host alerts. Threshold alerts on host metrics, on Essentials and above.
- TCP checks. A reachable Redis port, if you intentionally expose a protected endpoint.
- Health endpoint. The safer pattern: an internal
PINGor read/write behind/health/redis. - On-call and escalation. Slack, SMS, or phone, routed to the current rotation.
- Status pages. Linked to the same monitors.
- No Redis INFO. Evictions, hit ratio, replication, and slow log stay with the collector.
Why choose Hyperping for Redis monitoring?
The host is a different failure than Redis. Redis INFO won't tell you the data mount filled up, and the server agent will. Pair it with redis_exporter or Datadog for the Redis fields.
You don't have to expose 6379. An authenticated health endpoint on the application network does a lightweight Redis check internally. Hyperping watches that path from outside.
On-call and a status page are in the same plan. Prometheus needs someone to own Alertmanager, and Datadog On-Call is a separate product. Hyperping Essentials includes on-call, escalation, a status page, and 5 server agents.
What users say
Alma's SRE, Fabrice Gregoire:
"Hyperping's reputation in our company is that it's more reactive than Datadog. We usually get notifications from Hyperping before Datadog."
"Datadog charges per check. You have a package, that's better. Pay per use is annoying and expensive."
DynaPictures on its status page:
"We made our Hyperping status page publicly available and it became a crucial part of our sales pitches."
How much does Hyperping cost?
- Free: 20 monitors, 5-minute checks, 1 hosted status page, 1 server agent with 2-day history
- Essentials: $24/month ($29 monthly) for 50 monitors, 30-second checks, 5 server agents with 7-day history, 1 status page, 3 browser checks, 3 seats, on-call and escalation
- Pro: $74/month ($89 monthly) for 250 monitors, 20 server agents with 14-day history, 3 status pages, 10 seats
- Business: $249/month ($299 monthly) for 1,000 monitors, 20-second checks, 100 server agents with 30-day history, 10 status pages, 20 seats
Extra server agents are $2/month on Essentials and Pro, and $1.50/month on Business. Ten Redis machines on Essentials cost about $34/month: $24 for the plan and $10 for five agents beyond the included five. Redis metrics still need a separate collector, so that's the host and availability part of the bill.
Where Hyperping falls short
The agent collects host-level metrics, not redis-server CPU or RSS, and the documented metrics don't include per-process data or swap. INFO, SLOWLOG, replication offsets, hit ratio, and evictions stay with Prometheus, Datadog, Sematext, or Netdata.
You can't install the agent on ElastiCache or Azure Managed Redis, so use provider-native metrics there. Public probes can't reach a private Redis endpoint, and a TCP handshake alone doesn't mean Redis can execute commands.
If Datadog or Netdata already covers the host, Hyperping's remaining job is the independent external check and customer communication.
Is Hyperping right for you?
Choose Hyperping if you want self-hosted Redis machine health, external detection, and incident response alongside a Redis collector. Skip it as your only Redis monitor, and skip the host agent on managed cache nodes.
Recommendations by buyer type
| Buyer or situation | Recommended tool | Reason |
|---|---|---|
| Kubernetes or Prometheus already in place | Prometheus + redis_exporter + Grafana | Current open-source collector; Redis Insight for investigation |
| Need to inspect keys, TTLs, and the slow log | Redis Insight | Official GUI; add Prometheus or SaaS alerts for production |
| Already on Datadog | Datadog | Redis metrics next to traces and logs; about $150/mo for ten hosts |
| Want hosted Redis metrics without Datadog's host price | Sematext | About $36/mo for ten hosts on Standard |
| Live incident on a single host | Netdata | Per-second Redis and infrastructure charts |
| Self-hosted Redis, collector already chosen, no host or on-call | Hyperping | Linux/macOS host health, dependency check, on-call; keep the collector |
| IT department that must stay on-premises | ManageEngine Applications Manager | Self-hosted software; Redis Insight for direct inspection |
| ElastiCache, Azure Managed Redis, or Memorystore | Provider-native monitoring | No extra agent; remote redis_exporter where the service permits it |
| Need a customer-facing incident path | Hyperping plus an internal collector | Outside-in health endpoint plus INFO from Prometheus, Datadog, or Sematext |
Other credible options
Provider-native monitoring is the baseline on managed Redis because you can't install an agent on the cache node. CloudWatch covers ElastiCache, Azure Monitor covers Azure Managed Redis, and Google Cloud Monitoring covers Memorystore. Redis Cloud and Redis Software have their own metrics and Prometheus paths. Hyperping's host agent applies to machines you control, but its external check can still watch an application health endpoint that tests managed Redis internally.
Open-source metrics and command-line tools
| Tool | Main strength | Main limitation | Good for |
|---|---|---|---|
| Prometheus + redis_exporter | Current standard collector for Redis and Valkey | You operate storage, rules and Alertmanager | Prometheus and Kubernetes users (see above) |
| Grafana OSS or Cloud | Common Redis dashboard layer | Direct Redis datasource plugin was last updated in 2023 | Anyone running the Prometheus stack |
| redis-cli and INFO | Built-in source of truth | No history, alerts, or dashboard | Quick checks during an incident |
| redis-stat | Lightweight CLI and tiny web dashboard | Manual upkeep and limited fleet support | One or two small instances |
| Percona PMM | Open-source multi-database monitoring | Thin independent Redis evidence | People already running PMM |
| Elastic, Metricbeat, or OTel Redis | Dashboards, rules and SLOs inside Elastic | Requires Elasticsearch and Kibana | People already running Elastic |
| Netdata | Per-second charts and auto-discovery | Full centralized setup depends on deployment | Per-second host and Redis charts (see above) |
| Nagios or Icinga plugins | Fits established on-premises monitoring | Plugin selection and time-series depth require work | Existing Nagios or Icinga setups |
Redis GUIs
| Tool | Main strength | Main limitation | Good for |
|---|---|---|---|
| Redis Insight | Official browser, profiler, slow log and memory analysis | Limited historical alerting | Key and slow-log debugging (see above) |
| Another Redis Desktop Manager | Free GUI with Cluster, Sentinel, SSH and SSL | No production alerting | Developers who want a free desktop GUI |
| Tiny RDM | Free GUI with Valkey and KeyDB support | GUI only | Valkey and KeyDB users who want a GUI |
| Redimo | Native GUI with worker and queue views | Paid and thin independent reviews | People debugging workers and queues |
SaaS observability products
| Tool | Main strength | Main limitation | Good for |
|---|---|---|---|
| Datadog Redis | 50+ metrics, service check and APM/log correlation | Host and product-level cost | Existing Datadog users (see above) |
| New Relic Redis | INFO and CONFIG metrics beside APM | Docs list Redis support only through version 7.0 | Existing New Relic users |
| Dynatrace Redis | Auto-discovery and full-stack problem correlation | Deployment restrictions and memory-based pricing | Existing Dynatrace users |
| Sematext Redis | Dedicated hosted integration at a low host price | 7-day Standard retention; small published INFO catalog | Low-cost hosted metrics (see above) |
| CubeAPM | Self-hosted OpenTelemetry platform at $0.15/GB | Self-hosted operations; thin third-party Redis evidence | People who want self-hosted OpenTelemetry |
| Atatus | Memory, fragmentation, evictions and hit rate | Thin current third-party Redis evidence | People who want APM with Redis charts |
| Scout APM | Application-side Redis latency in traces | Doesn't replace server monitoring | Seeing Redis latency from the app side |
| AppDynamics | Enterprise APM and Redis Software integration path | Heavyweight and limited Redis-specific evidence | Existing AppDynamics users |
IT operations suites
| Tool | Main strength | Main limitation | Good for |
|---|---|---|---|
| ManageEngine Applications Manager | On-premises Redis, host and dependency monitoring | Heavier setup and interface | On-premises IT operations (see above) |
| Site24x7 Redis plugin | Redis and host metrics inside a broad SaaS suite | Plugin setup and add-on pricing | People already on Site24x7 |
| SolarWinds Observability, DPM, or former AppOptics | Redis and application monitoring in the SolarWinds product line | Product names and packaging have changed | Existing SolarWinds users |
| Paessler PRTG | Custom sensors inside a network monitoring product | Network-first and plugin-dependent | Existing PRTG users |
| eG Innovations | Hybrid discovery and root-cause analysis | Custom enterprise price and thin Redis docs | Large companies with hybrid estates |
| OpsDash | Prebuilt Redis dashboard and low server price | Dated integrations and no anomaly detection | A few servers on a small budget |
Provider-native monitoring
| Tool | Main strength | Main limitation | Good for |
|---|---|---|---|
| Amazon CloudWatch for ElastiCache | No agent and AWS host metrics | Managed-service command restrictions | Anyone on ElastiCache |
| Azure Monitor | No agent for Azure Redis services | INFO ceiling and product migration | Anyone on Azure Managed Redis |
| Redis Cloud and Redis Software metrics | Official cluster, node, shard and proxy metrics | Only for Redis managed or enterprise products | Redis Cloud and Redis Software users |
Microsoft has published a retirement path for older Azure Cache for Redis SKUs in favor of Azure Managed Redis. Confirm which service and metric namespace will remain current before investing in dashboards.
Host health and outside-in availability companions
| Tool | Main strength | Main limitation | Good for |
|---|---|---|---|
| Hyperping | Linux/macOS host metrics, TCP or health endpoint checks, on-call and status pages | No Redis INFO or per-process metrics; agent can't run on managed cache nodes | Host health and on-call next to a collector (see above) |
| Better Stack | Redis log ingestion plus incident response | Doesn't collect Redis metrics directly | Redis logs plus incident response |
| UptimeRobot and similar port monitors | Low-cost port checks | Port availability isn't Redis health | A cheap port check |
LoadFocus is a load-testing and API-monitoring product, and PagerDuty and Slack route alerts, so none of them collect Redis metrics.
How to test Redis monitoring tools
All seven shortlisted options have a free tier, free software, or a trial:
- Prometheus + redis_exporter + Grafana OSS: free software
- Redis Insight: free
- Datadog: 14-day trial
- Sematext: 14-day free trial, no credit card required
- Netdata: free open-source agent
- ManageEngine Applications Manager: free for 5 monitors
- Hyperping: free tier (20 monitors, 1 server agent) and a 14-day trial on paid plans
Use a disposable Redis or Valkey instance. Don't evaluate these on a green PING. Don't run an unbounded MONITOR session or a destructive memory test against production.
- Set a low
maxmemoryand load disposable keys until the policy evicts data or rejects writes. Confirm the dashboard separates evictions from expirations. - Generate hits and misses in known proportions. Verify the hit-ratio formula and whether it shows raw counters beside the ratio.
- Run a command that exceeds the slow-log threshold. Check whether the tool captures the command, duration, node, and timestamp without exposing sensitive values.
- Block a client and approach
maxclients. Confirm that blocked clients and rejected connections produce separate alerts. - Break a replica link or pause a replica. Measure how quickly the tool reports link state, lag, and resynchronization.
- Force an RDB or AOF failure on a disposable host. Confirm persistence alerts distinguish a failed write from a failed background rewrite.
- Restart one node in a cluster. Check whether the dashboard identifies the node and role instead of hiding it in a cluster average. Then exhaust the application connection pool while Redis stays healthy, so you see whether APM or client metrics catch what INFO can't.
- Ignore an alert. Verify routing, acknowledgement, escalation, and the customer-facing path. Then price the real node count, exporters, host agents, users, retention, logs, and traces.
For Hyperping's host agent, also test a host-resource threshold on a disposable Linux/macOS machine. Verify that the alert identifies host pressure without presenting it as Redis-specific memory usage. A Redis eviction alert must come from your Redis collector.
Related reading
- Hyperping TCP monitoring: how external port checks work, including Redis on 6379
- Hyperping server monitoring: CPU, memory, disk and network metrics for Redis hosts
- Server agent metrics collected: supported host metrics and collection limits
- Choosing the right uptime checks: where TCP and health endpoints fit
- Hyperping pricing: current monitor, server-agent, on-call and status-page limits
FAQ
What are the best Redis monitoring tools? ▼
The best Redis monitoring tools are Prometheus with redis_exporter and Grafana for open-source metrics and alerts, Redis Insight for interactive inspection, Datadog for Redis metrics connected to APM and logs, Sematext for a lower-cost hosted Redis integration, Netdata for per-second infrastructure monitoring, ManageEngine Applications Manager for on-premises IT operations, and Hyperping for host health, outside-in availability, and incident response.
What Redis metrics should I monitor? ▼
Monitor used memory against maxmemory, allocator fragmentation, evicted keys, hit and miss ratio, operations per second, blocked and rejected clients, main-thread CPU, slow commands, latency percentiles, replication link health, full resyncs, and RDB or AOF persistence failures. Cluster deployments also need per-node and per-shard metrics because an average can hide one hot shard.
Is Redis Insight enough for production monitoring? ▼
Redis Insight is useful for browsing keys, viewing the slow log, profiling commands, and inspecting cluster topology. It doesn't give you production alerting or long-term history, so pair it with Prometheus, Datadog, Sematext, Netdata, or another time-series monitoring product.
How does Prometheus monitor Redis? ▼
Prometheus usually scrapes oliver006/redis_exporter, which connects to Redis or Valkey and converts INFO and related signals into Prometheus metrics. Grafana provides dashboards and Alertmanager routes alerts. The software is free, but you operate the exporter, Prometheus storage, dashboards, retention, and high availability.
Can Hyperping monitor Redis? ▼
Hyperping monitors the host Redis runs on through a Linux/macOS agent that collects CPU, memory, disk, and network metrics. It can also check a reachable TCP endpoint or an application health endpoint that verifies Redis internally. The agent doesn't collect Redis INFO metrics or per-process Redis CPU and memory, so pair it with a Redis collector for evictions, hit ratio, replication, and the slow log. You can't install the host agent on managed cache nodes such as ElastiCache.
Is it safe to leave the Redis MONITOR command running? ▼
No. MONITOR streams every command processed by Redis and is meant for short debugging sessions. Redis documentation reports that one MONITOR client reduced throughput by more than 50 percent in its published benchmark. Use a timeout, capture only what you need, and use INFO, SLOWLOG, or latency metrics for continuous monitoring.

