The best log management tools are Hyperping for logs attached to the incident your uptime or log alert opened, Better Stack for low per-GB log prices, Datadog for logs next to APM and infrastructure, Grafana Cloud Logs for Loki and LogQL, Axiom for high log volume on a small bill, New Relic for 100 GB a month free, SigNoz for OpenTelemetry with a self-hosted option, and Sentry Logs for logs next to the errors you already track.
I analyzed 35 products and shortlisted eight. Every tool below collects logs from your apps and servers, lets you search and tail them, and alerts on a log pattern. Observability suites, cloud-provider logging, and self-hosted log stores are further down.
Prices were checked in October 2026. The thing that changes the shortlist most is what happens after a log alert fires. Hyperping includes on-call in the plan. Better Stack, Datadog, and Grafana Cloud sell paging per person on top of log pricing. Axiom, New Relic, SigNoz, and Sentry send the alert to PagerDuty or Slack, and you buy on-call somewhere else.
| Tool | Best for | Starting price | Main limitation |
|---|---|---|---|
| Hyperping | Logs on the incident, with on-call included | $24/mo with 5 GB | Beta; 30-day maximum; no traces |
| Better Stack | Cheap logs per GB | Free 3 GB; $0.15/GB in the US | On-call costs $29 per responder |
| Datadog | Logs next to APM and infrastructure | $0.10/GB plus indexing | Billed on ingest and again on indexing |
| Grafana Cloud Logs | Loki without running it | Free 50 GB; Pro $19/mo | LogQL and label design take time |
| Axiom | High log volume on a small bill | Free 500 GB; $25/mo | No on-call; query compute is metered |
| New Relic | A big free tier with APM | Free 100 GB; $0.40/GB after | Full logs UI needs a paid seat per person |
| SigNoz | OpenTelemetry logs, traces, and metrics | $49/mo; free self-hosted | Weak alerting; heavy to self-host |
| Sentry Logs | Logs next to errors and traces | Free 5 GB; $26/mo | 30-day cap; basic search |
Why trust this guide
I'm Léo, founder of Hyperping. Yes, that means I have a stake in one of these tools. But I've watched teams pick competitors when they were the better fit, and I'm not going to pretend otherwise. My goal isn't to convince you Hyperping is always the answer. It's to help you understand which tool actually solves your problem.
I went through pricing pages, docs, G2 reviews, Reddit, Hacker News, and GitHub issues for every tool on the list, in October 2026.
What is log management?
Log management collects log lines from your apps, servers, and platforms into one place, keeps them for a set number of days, and lets you search, tail, and alert on them. A useful setup takes logs from wherever your code runs (OpenTelemetry, syslog, Vercel or Heroku drains, cloud services), keeps them long enough to answer last week's question, and pages someone when errors spike or a service goes quiet.
What it should catch:
- Errors spike after a deploy and nobody looks until a customer writes in.
- A worker stops logging because it crashed, and nothing else notices.
- An uptime check fails and the on-call person has to hunt through three dashboards for the log lines.
- Someone leaves debug logging on and the bill jumps.
- A customer asks what happened three weeks ago and the logs are gone.
| Tool type | What it collects | What it answers | Where it misses |
|---|---|---|---|
| Log management | Every line your code writes | What happened, in order | Doesn't follow one request across services |
| Error tracking | Exceptions with stack traces | Which bug, how often, since when | Lines that aren't exceptions |
| APM and tracing | Spans per request | Which service made it slow | Context outside the request |
| Uptime monitoring | Checks from outside | Can customers reach it right now | Why it failed |
| SIEM | Security events | Was this an attack | Day-to-day debugging |
Hyperping puts logs next to uptime, incidents, and on-call. Datadog, New Relic, and SigNoz put logs next to traces and metrics. Sentry puts them next to errors. Axiom and Grafana Cloud are mostly about storing and querying a lot of logs cheaply. Those are different purchases even when the log explorer looks the same.
What should a log management tool catch?
Errors spiked after a deploy and nobody noticed
Every tool on the shortlist can alert on a count of error lines. The difference is where the alert goes. A Hyperping log alert opens an incident and runs the escalation policy you already use for uptime. Better Stack does the same once you pay for responders. Axiom, New Relic, SigNoz, and Sentry send it to Slack or PagerDuty, and Datadog only alerts on logs you've paid to index.
A service went quiet and no alert fired
Silence is the failure most log tools are worst at, because there's no error line to match. Hyperping has silence rules on log sources, Axiom and SigNoz have no-data alerts, and Datadog uses a "below 1" condition. On Grafana Cloud you write a LogQL metric query for it.
The uptime check was red and I had to go find the logs
When a monitor fails at 3 a.m., the on-call person wants the log lines from just before. Hyperping attaches them to the incident, from 15 minutes before the start to 5 minutes after. Sentry links logs to the error and the trace. Everywhere else you open the explorer and set the time range yourself.
Someone left debug logging on and the bill doubled
Vendors bill logs by the GB ingested, by the GB stored, by the million events indexed, by query compute, or by seat. A burst of debug logs hits each of those differently. Datadog has exclusion filters and daily quotas. Grafana's Adaptive Logs drops patterns nobody queries. Axiom stops queries and monitors at your spending limit, and Sentry drops new data when the pay-as-you-go budget runs out. New Relic's free tier stops ingest at 100 GB.
I needed a log from three months ago
Hyperping and Sentry stop at 30 days. New Relic goes to 120 days with Data Plus, SigNoz to a year, Datadog Flex Logs to 15 months, and Axiom keeps data for as long as you set, on cheap storage that stays searchable.
Log management capability comparison
The biggest split is whether the tool also pages people, or only stores and searches logs.
| Capability | Hyperping | Better Stack | Datadog | Grafana Cloud | Axiom | New Relic | SigNoz | Sentry Logs |
|---|---|---|---|---|---|---|---|---|
| Ingest | OTel, HTTP, syslog, Vercel, Heroku, CloudWatch, Vector | OTel, Vector, syslog, eBPF collector | Agent, OTel, 1,000+ integrations | Alloy, OTel, Loki API | OTel, HTTP, syslog, Vercel, Splunk and Elastic endpoints | Agents, OTel, Fluent Bit, syslog | OTel, Fluent Bit, Logstash | Sentry SDKs, OTel, Vercel |
| Query | Search and filters | SQL and a query builder | Facets and full text | LogQL | APL, a piped language | NRQL or Lucene | Query builder and SQL | Text and attribute search |
| Live tail | Yes | Yes | Yes, including unindexed logs | Yes | Yes | Yes, with a core seat | Yes | Yes, pauses above 100 logs/s |
| Silence alerts | Yes | Yes | Yes | With a LogQL query | Yes | Yes | Yes | Not documented |
| Longest retention | 30 days | Set per source | 30 days indexed, 15 months on Flex | 30 days on Pro, more through support | Any length | 120 days with Data Plus | 1 year | 30 days |
| Logs shown on the incident | Yes, automatically | Alert opens an incident | With Incident Management | No | No | No | Link to related logs | Linked to errors and traces |
| On-call built in | Yes, in the plan | Per responder | Per seat | Grafana IRM, per user | No | No | No | No |
| Status pages | Yes | Yes | With Incident Management | No | No | No | No | No |
| Traces and APM | No | Yes | Yes | Yes, with Tempo | Yes | Yes | Yes | Yes |
| Self-hosted option | No | No | No | Loki | No | No | Yes | Yes |
Log management pricing compared
Vendors bill logs by GB ingested, GB retained, events indexed, query time, or seats, so the same 50 GB costs very different amounts.
| Tool | Free plan | First paid plan | What it includes | Billed by | Watch out for |
|---|---|---|---|---|---|
| Hyperping | No logs on Free | Essentials, $24/mo ($29 monthly) | 5 GB of logs, 30-day search, 50 monitors, on-call, 3 seats | Plan, then $0.25/GB over the allowance | Not on EU-only accounts |
| Better Stack | 3 GB of logs kept 3 days | Pay as you go, or Nano at $38/mo (US) | Nano: 40 GB each of logs, traces, and metrics, 30 days | GB ingested plus GB-month retained, by region | Paging needs $29 responder licenses |
| Datadog | None for logs | $0.10/GB ingested | Live tail and archiving | GB ingested plus million events indexed | 30-day indexing is $2.50 per million events |
| Grafana Cloud | 50 GB, 14 days, 3 users | Pro, $19/mo | 50 GB with 30-day retention | Four usage meters plus $8 per extra user | Retention changes go through support |
| Axiom | 500 GB, 30 days, 1 user | Axiom Cloud, $25/mo | 1 TB ingest, 100 GB-hours of query compute | GB ingested plus query compute | Queries and monitors stop at the spending limit |
| New Relic | 100 GB, 1 full user | $0.40/GB after 100 GB | 30-day log retention | GB ingested plus users | Live tail and logs in context need a $49 core seat |
| SigNoz | Self-hosted only | Teams, $49/mo | $49 of usage; logs $0.40/GB at 30 days | GB ingested, priced by retention | Every GB costs more as retention gets longer |
| Sentry Logs | 5 GB, 1 user | Team, $26/mo | 5 GB of logs, 14-day search | Plan, then $0.50/GB pay as you go | 30-day search needs Business at $80/mo |
What 50 GB of logs a month costs
Take five engineers sending 50 GB of logs a month, searchable for 30 days, with an alert on error spikes that pages whoever is on call. This is my estimate from public pricing.
| Tool | Plan that covers it | Monthly cost | Paging |
|---|---|---|---|
| Axiom | Axiom Cloud | $25 | Not included; add PagerDuty or similar |
| Grafana Cloud | Pro, plus 2 users over the 3 included | $35 | $75 with Grafana IRM for 5 people |
| SigNoz | Teams | $49 | Not included |
| Hyperping | Essentials, 2 extra seats, 45 GB over | $54.25 | Included |
| Sentry Logs | Business, 45 GB over at $0.50 (annual) | $102.50 | Not included |
| Datadog | 50M events indexed for 30 days (annual) | $130 | $230 with On-Call for 5 seats |
| New Relic | 1 full user and 4 core users | $206 | Not included |
| Better Stack | Pay as you go, US region | $11.50 | $156.50 with 5 responders (annual) |
Better Stack is the cheapest way to store and search the logs, and Axiom is close behind with far more headroom: its $25 plan takes up to 1 TB. Both get more expensive once paging enters the picture. Better Stack charges per responder, and Axiom needs a second vendor. Hyperping is the cheapest of the tools that page someone without a separate bill, and while logs are in beta, ingestion is free until metered billing starts. Datadog's number depends on event size: the $130 assumes about 1 KB per line, and smaller lines mean more events and a bigger bill.
Hyperping: Best for logs on the incident, with on-call included
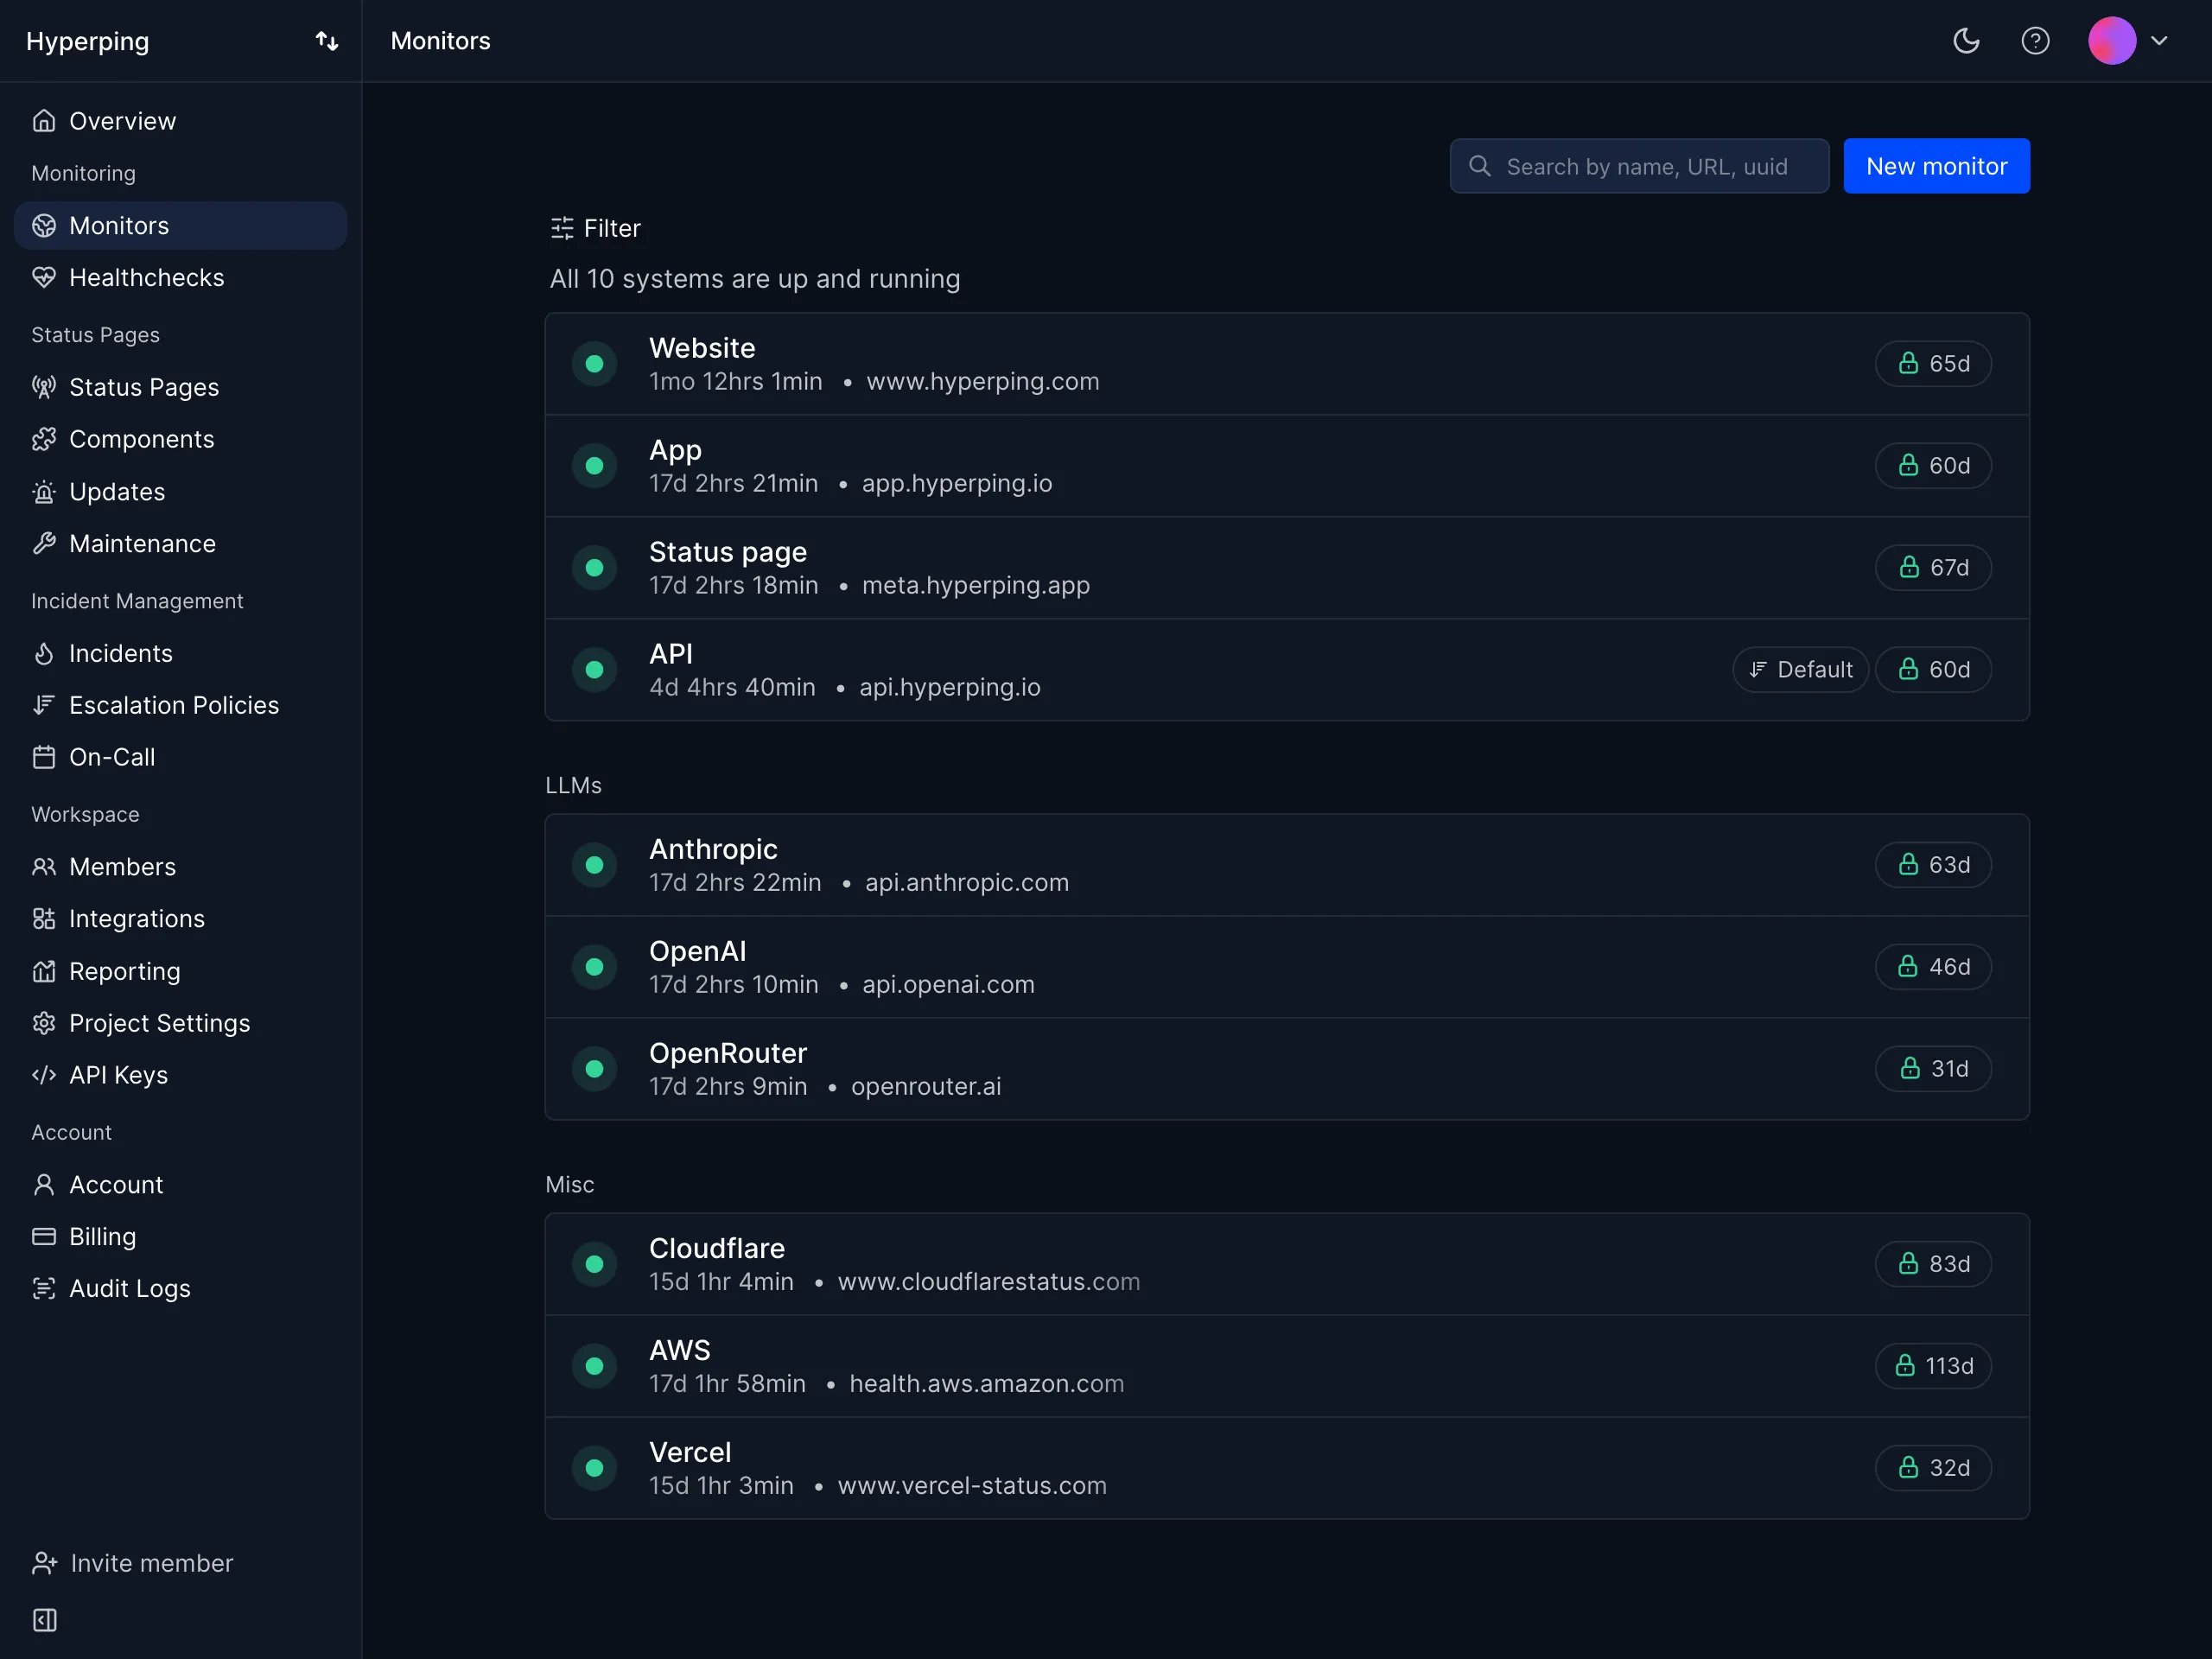
Hyperping log monitoring adds logs to the product that already runs your uptime checks, on-call rotation, and status page. A log alert opens the same kind of incident as a failed monitor, and every incident shows the log lines from just before it started.
| Best for | Starting price | Main limitation |
|---|---|---|
| Logs on the incident, with on-call included | $24/mo with 5 GB | Beta; 30-day maximum; no traces |
Who Hyperping is built for
SaaS teams of roughly 5 to 50 engineers who already page someone when a monitor fails and want the log lines to arrive with the page. Usually that's a few services on Vercel, Heroku, or a handful of servers, sending well under 50 GB a month. If you need traces, a year of retention, or a query language for deep analysis, you'll outgrow it.
Notable features
- Sources. OpenTelemetry SDK or collector, HTTP JSON, syslog over TLS, and drains from Vercel, Heroku, AWS CloudWatch, and Vector. Each source gets its own token and usage stats.
- Explorer. Search, filters, live tail, saved views, and export.
- Log alerts. Error-rate and silence rules that open incidents.
- Logs on incidents. A Logs tab on every incident, with lines from 15 minutes before the start to 5 minutes after.
- Retention. 30 days of search on paid plans, with 3, 7, 14, or 30 days set per source.
- On-call. Log alerts use the same escalation policies, rotations, phone calls, and SMS as uptime alerts.
- AI and MCP. Ask Hyperping and the MCP server can search logs, summarize errors, and pull the logs for an outage.
Why choose Hyperping for log management?
The logs are already on the incident. When a checkout monitor fails, the incident shows the log lines from the 15 minutes before. Everywhere else on this list, the on-call person opens a second tool and sets the time range by hand.
Paging is in the plan. Better Stack charges $29 per responder for phone and SMS paging, and Datadog charges per On-Call seat. Axiom, New Relic, SigNoz, and Sentry need PagerDuty on top. Hyperping Essentials includes on-call, escalation, and phone alerts at $24/month.
One bill with no seat or query fees for logs. Logs are billed by the GB over your plan's allowance, and searches, dashboards, and AI questions don't change the invoice. Rejected lines are never billed.
What users say
Alma runs Datadog and keeps Hyperping as an outside check. Their SRE, Fabrice Gregoire:
"Hyperping's reputation in our company is that it's more reactive than Datadog. We usually get notifications from Hyperping before Datadog."
How much does Hyperping cost?
- Free: 20 monitors, 1 status page. No logs
- Essentials: $24/month ($29 monthly) with 5 GB of logs, 50 monitors, on-call, 1 status page, 3 seats
- Pro: $74/month ($89 monthly) with 20 GB of logs, 250 monitors, 3 status pages, 10 seats
- Business: $249/month ($299 monthly) with 50 GB of logs, 1,000 monitors, 10 status pages, 20 seats
- Logs over the allowance: $0.25 per uncompressed GB, once metered billing starts. Logs are free during the beta
Five engineers sending 50 GB a month come to $54.25 on Essentials with two extra seats, or $96.50 on Pro, where all five seats are included.
Where Hyperping falls short
Search stops at 30 days, so Axiom, SigNoz, or Datadog Flex Logs are better for long retention. There are no traces or APM, which SigNoz, Datadog, and New Relic cover. At high volume, Axiom's 1 TB for $25 and Better Stack's $0.10 to $0.15 per GB cost less than $0.25 per GB. Logs aren't on the Free plan or on EU-only accounts, and as a beta there are no third-party reviews of the log product yet.
Is Hyperping right for you?
Pick Hyperping if the person who gets paged for a failed monitor should see the logs in the same place, without paying for an on-call tool on top. If logs are mainly for debugging across services, or you send hundreds of GB a month, look at SigNoz or Axiom.
Better Stack: Best for cheap logs per GB
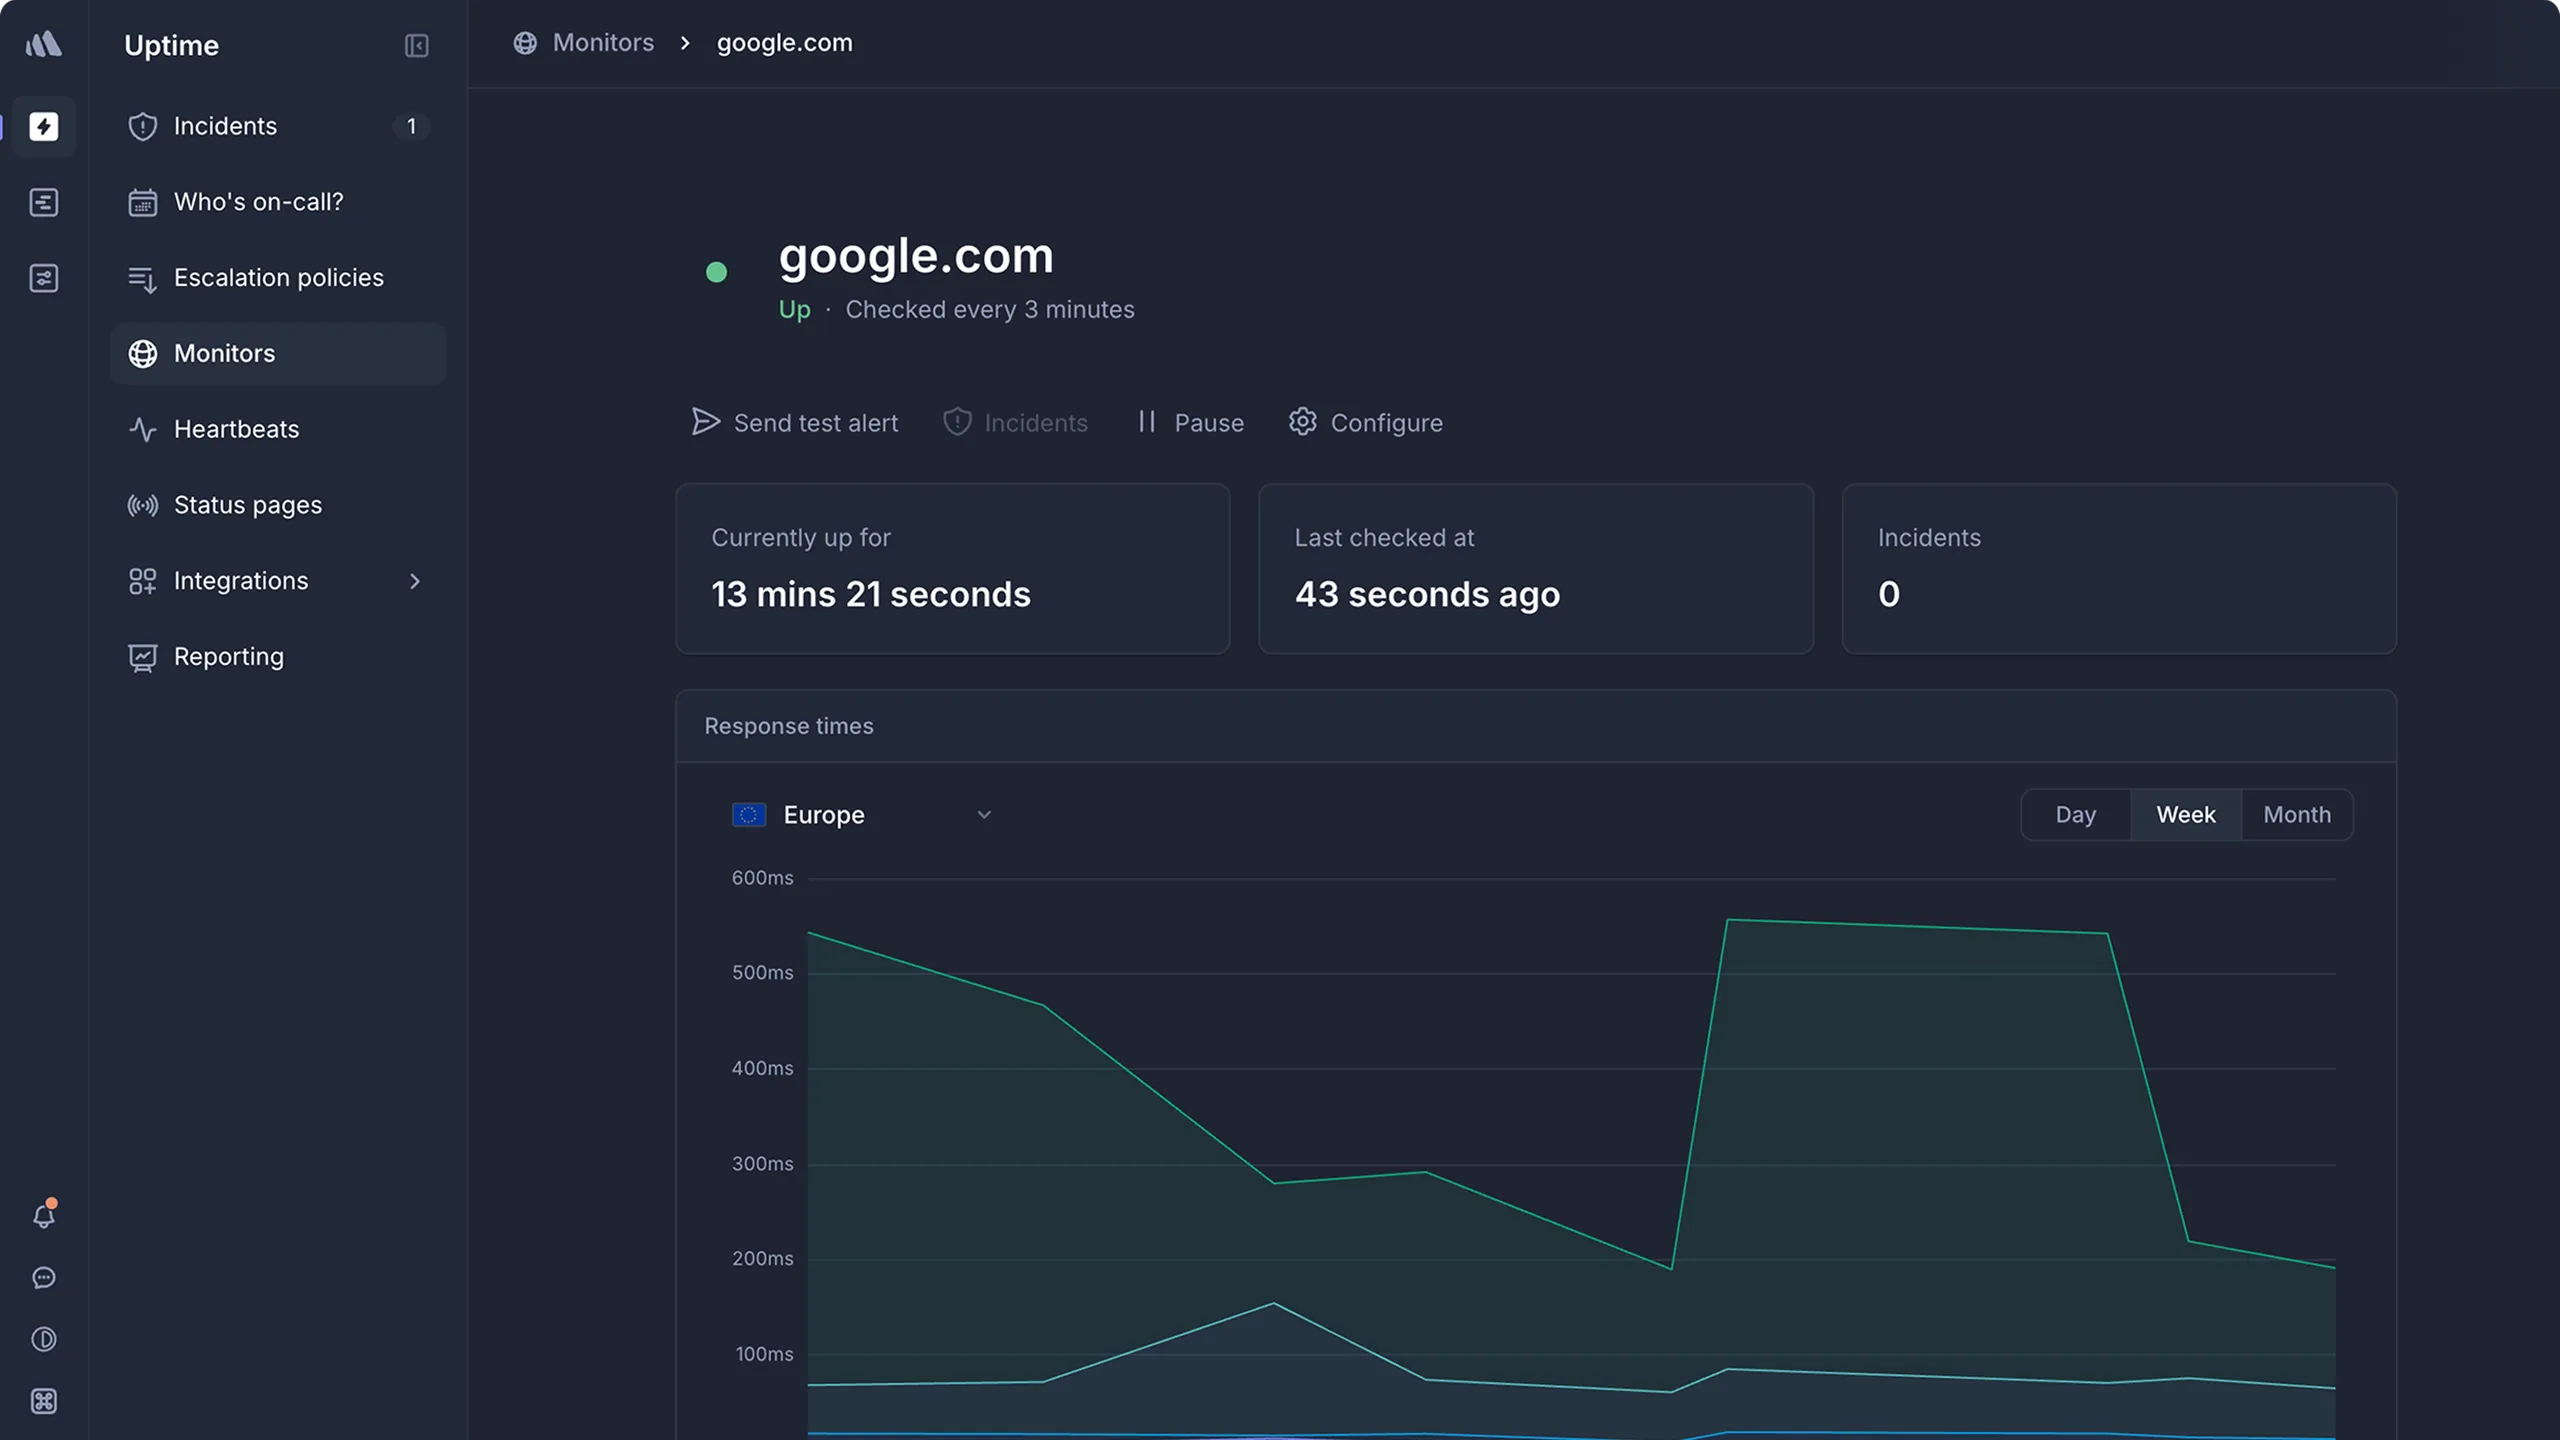
Better Stack sells logs, traces, metrics, uptime, on-call, and status pages from one vendor, with log prices that undercut most of the list. It's also the company that wrote the guide this one started from.
| Best for | Starting price | Main limitation |
|---|---|---|
| Cheap logs per GB | Free 3 GB; $0.15/GB in the US | On-call costs $29 per responder |
Who Better Stack is built for
Developer-led startups moving off Datadog or CloudWatch who want logs, uptime, and incidents from one vendor and are comfortable with SQL. European teams get the lowest prices. It isn't HIPAA compliant, which rules it out for some health products.
Notable features
- Ingest. OpenTelemetry, Vector, syslog, an eBPF collector, an HTTP API, Docker, Kubernetes, and SDKs.
- Transforms. VRL and JavaScript before storage.
- Query. SQL, a live tail query language, and a drag-and-drop builder.
- Log alerts. Threshold, percentage change, and anomaly alerts on a log chart, each opening an incident.
- Retention. Set per source, with S3 archiving or your own bucket.
- Regions. Europe, US, and Singapore, each priced differently.
- AI. An AI SRE billed by token, and an MCP server.
Why choose Better Stack for log management?
The per-GB price is low. In Europe, 50 GB kept for 30 days costs about $7.50 a month: $0.10 per GB to ingest and $0.05 per GB-month to keep. In the US it's about $11.50. Hyperping's overage is $0.25 per GB.
Logs and incidents come from one vendor. Like Hyperping, a Better Stack log alert opens an incident that can page someone and update a status page.
Telemetry seats are free. Anyone on the team can search logs without a license. You only pay per person when they need to be paged.
What users say
Reviewers praise having logs and alerting in one place. From an August 2026 G2 review:
"I love using Better Stack for logging, telemetry, and alerting. It's been great for unifying data from our multiple services."
How much does Better Stack cost?
US prices; Europe is about a third cheaper:
- Free: 3 GB of logs kept 3 days, plus 10 monitors and a status page
- Pay as you go: $0.15/GB ingested plus $0.08/GB-month retained
- Nano: $38/month yearly ($45 monthly) with 40 GB each of logs, traces, and metrics, 30-day retention
- Responder license: $29/month yearly ($34 monthly) per person who gets paged
Fifty GB a month costs about $11.50 in the US, or $156.50 with five people on call.
Where Better Stack falls short
On-call gets expensive quickly, because each person on the rotation needs a responder license, while Hyperping includes seats in the plan. Several G2 reviewers say the SQL workflow has a learning curve, and one reports log pages taking two to five minutes to load. Bundles charge for traces and metrics you may not send. For long retention at volume, Axiom is cheaper, and for logs next to deep APM, Datadog goes further.
Is Better Stack right for you?
Pick Better Stack if you want the lowest log bill from a vendor that also does incidents, and only one or two people need phone paging. If the whole team rotates on call, price the responder licenses first.
Datadog: Best for logs next to APM and infrastructure

Datadog Log Management puts logs in the same product as infrastructure metrics, APM, and security, so you can go from a slow trace to its log lines in one click. You pay to ingest every log and again for each log you want to search and alert on.
| Best for | Starting price | Main limitation |
|---|---|---|
| Logs next to APM and infrastructure | $0.10/GB plus indexing | Billed on ingest and again on indexing |
Who Datadog is built for
Teams already paying for Datadog infrastructure or APM, with someone who watches the bill and sets exclusion filters. A five-person team that wants every log searchable for a month will pay more here than anywhere else on the list.
Notable features
- Ingest. The Datadog Agent, 1,000+ integrations, cloud forwarders, OpenTelemetry, and Vercel drains.
- Log Explorer. Faceted and full-text search, patterns, and live tail across every ingested log, indexed or not.
- Indexes and filters. Choose which logs get indexed, with exclusion filters and daily quotas.
- Archives. Send everything to your own S3, GCS, or Azure bucket, then rehydrate or search it later.
- Flex Logs. Cheaper storage for 3 to 15 months, without monitors.
- Monitors. Alerts on indexed logs, including a "below 1" condition for silence.
- On-call. Datadog On-Call pages a team from any monitor, at $20 per seat on an annual plan.
Why choose Datadog for log management?
A log line is one click from the trace. When logs, APM, and infrastructure share tags, you can go from a slow request to its trace to the log lines and the host metrics without changing tools.
You decide what to pay to search. Archive everything for $0.10 per GB and index only what you alert on. Rehydrate old logs when an investigation needs them.
It covers the most sources. If it runs in your stack, there's probably a Datadog integration for its logs.
What users say
The cost of indexing comes up again and again, even from people who like the product. From a November 2025 Hacker News comment:
"Datadog is really good at identifying anomalies, but the cost for logs is so high there's a non-trivial amount of savings in sampling and minimizing logging."
How much does Datadog cost?
Annual contract prices:
- Ingest: $0.10 per GB, including live tail and archiving
- Indexing: per million events, $1.06 for 3 days, $1.27 for 7 days, $1.70 for 15 days, $2.50 for 30 days
- Flex Logs Starter: $0.60 per million events for 3 to 15 months
- Rehydration: $0.10 per compressed GB scanned, plus indexing
- On-Call: $20 per seat per month
Fifty GB indexed for 30 days is about $130 a month on an annual contract, or $230 with On-Call for five people.
Where Datadog falls short
There's no free tier for logs, and usage above an annual commitment is billed at 50% more. Monitors only run on indexed logs, so cheap Flex storage can't alert. The UI is dense, and reviewers mention a learning curve. Hyperping and Better Stack are cheaper for logs attached to incidents, and Axiom is cheaper for keeping everything searchable.
Is Datadog right for you?
Pick Datadog if you already use it for APM and want logs in the same place. If logs would be the first Datadog product you buy, start with something cheaper.
Grafana Cloud Logs: Best for Loki without running it
Grafana Cloud Logs is hosted Loki. It indexes labels rather than full text, which keeps storage cheap, and you query it with LogQL in the same Grafana you may already use for metrics.
| Best for | Starting price | Main limitation |
|---|---|---|
| Loki without running it | Free 50 GB; Pro $19/mo | LogQL and label design take time |
Who Grafana Cloud Logs is built for
Teams already running Prometheus, Grafana dashboards, or Kubernetes, with someone willing to design labels and learn LogQL. It's also the easiest exit to self-hosting, since Loki is open source.
Notable features
- Ingest. Grafana Alloy, the Loki push API, and OpenTelemetry. Promtail reached end of life in March 2026.
- LogQL. Filters, parsers, and metric queries over log streams.
- Logs Drilldown. A point-and-click view for people who don't write LogQL.
- Adaptive Logs. Finds log patterns nobody queries and drops them before you pay to store them.
- Grafana Assistant. Writes LogQL and runs investigations.
- Self-hosted Loki. AGPLv3, on S3-compatible storage.
Why choose Grafana Cloud for log management?
Small teams can stay on the free tier. Fifty GB a month with 14-day retention and three users, with no card and no expiry.
Pro is cheap at small volume. The $19 platform fee includes 50 GB with 30-day retention.
You can leave and keep the stack. If the cloud bill grows, self-hosted Loki runs the same queries.
What users say
LogQL comes up as the price of entry. From a September 2026 G2 review:
"The learning curve for LogQL is undeniably steep."
How much does Grafana Cloud cost?
- Free: 50 GB a month, 14-day retention, 3 users
- Pro: $19/month with 50 GB and 30-day retention. Beyond that, $0.05/GB processed, $0.40/GB written, and $0.10/GB for each extra 30 days
- Users: $8/month for each active user past 3
- Grafana IRM: on-call, billed per user
- Enterprise: $25,000 a year minimum
Fifty GB a month for five people is about $35, or $75 with Grafana IRM for paging.
Where Grafana Cloud falls short
Each stream allows 15 labels, so request IDs and other high-cardinality fields have to go elsewhere. Long time ranges are slow to query, and alert rules need a LogQL metric query. Retention changes go through support, and there's no self-serve archive. Hyperping and Better Stack put log alerts straight onto an incident, and Axiom is simpler for searching high-cardinality fields.
Is Grafana Cloud right for you?
Pick Grafana Cloud if your team already lives in Grafana and wants logs next to its Prometheus metrics. If nobody wants to learn LogQL, it'll sit unused.
Axiom: Best for high log volume on a small bill
Axiom stores logs on compressed, tiered storage and bills you separately for ingest and for query time. The result is a lot of searchable data for very little money, as long as queries stay reasonable.
| Best for | Starting price | Main limitation |
|---|---|---|
| High log volume on a small bill | Free 500 GB; $25/mo | No on-call; query compute is metered |
Who Axiom is built for
Developers and small platform teams with a lot of logs, often on Vercel or AWS Lambda, who already have PagerDuty or similar for paging. It's cloud only, with no self-hosted version.
Notable features
- Ingest. OpenTelemetry, HTTP, syslog over TLS, Vector, Fluent Bit, Heroku, Cloudflare, Netlify, CloudWatch, and Elasticsearch, Splunk, and Loki-compatible endpoints.
- Vercel. A marketplace integration that sets up the drain and a ready-made dashboard.
- APL. A piped query language, with a builder and plain-English query generation.
- Monitors. Threshold, match, and anomaly monitors, plus alerts when data stops arriving.
- Retention. Any number of days, or forever, on storage that gets cheaper as data ages and stays searchable.
- AI. An MCP server and Spotlight, which shows how failing events differ from normal ones.
Why choose Axiom for log management?
1 TB a month for $25. The paid plan includes 1 TB of ingest, then $0.12 per GB. At 50 GB you won't leave the base price.
Keep logs as long as you want. Retention is set per dataset with no 30-day ceiling, and old data stays searchable without a rehydration step.
No seat fees. Everyone on the paid plan can search.
What users say
People mostly bring up the price. From a September 2025 Hacker News comment:
"Axiom wants $60/m if you send them a terabyte of logs, which is basically nothing compared to the cost of developers trying to debug issues without detailed logs."
How much does Axiom cost?
- Personal: free, 500 GB a month, 30-day retention, 1 user, 3 monitors
- Axiom Cloud: $25/month with 1 TB of ingest and 100 GB-hours of query compute, then $0.12/GB and $0.20 per GB-hour
- Add-ons: SSO $100/month, RBAC $50/month
Fifty GB a month for five people fits in the $25 base.
Where Axiom falls short
There's no on-call, incidents, or status page, so a log alert goes to PagerDuty and the log lines don't travel with it. Hyperping and Better Stack cover that. Query compute is a second meter, and at the spending limit queries and monitors stop. The free plan is one user, SSO costs $100 a month, and there's little independent review signal.
Is Axiom right for you?
Pick Axiom if you send a lot of logs and want them searchable for months without a big bill. Plan for paging separately.
New Relic: Best for a big free tier with APM
New Relic gives every account 100 GB of data a month free, shared across logs, APM, and infrastructure. Past that, the bill is mostly about who on the team needs a paid seat.
| Best for | Starting price | Main limitation |
|---|---|---|
| A big free tier with APM | Free 100 GB; $0.40/GB after | Full logs UI needs a paid seat per person |
Who New Relic is built for
Teams already on New Relic APM, or planning to be, where one or two people do most of the digging and everyone else only views dashboards. Basic users are free and can search logs and run queries.
Notable features
- Ingest. APM and infrastructure agents, Fluentd, Fluent Bit, Logstash, Kubernetes, AWS, Azure, the Log API, syslog, and OpenTelemetry.
- Query. Lucene-style search or NRQL, with joins.
- Logs in context. Log lines linked to APM traces and errors.
- Live tail, patterns, and parsing. In the Logs UI, for core and full users.
- Alerts. Any log query can become an NRQL alert, including baselines and loss of signal.
- Long retention. Data Plus raises log retention to 120 days. Live Archives keep logs for up to 7 years.
Why choose New Relic for log management?
100 GB a month costs nothing. For most small SaaS teams, that covers logs and APM together.
There's no indexing fee. Every ingested log is searchable for 30 days at the same price.
Logs link to traces. If you run New Relic APM, a slow transaction links straight to its log lines.
What users say
The pricing model is the recurring complaint. From a March 2026 G2 review:
"One area that could be improved is the pricing model, especially as telemetry and log ingestion grow. In larger environments it can become difficult to predict costs."
How much does New Relic cost?
- Free: 100 GB a month, 1 full platform user, unlimited basic users
- Data ingest: $0.40/GB after 100 GB, or $0.60/GB with Data Plus
- Core user: $49/month
- Full platform user: $99/month on Standard (first one $10), $349/month on Pro with an annual commitment
Fifty GB a month is free to ingest. With one full user and four core users so everyone can use live tail, it's $206 a month.
Where New Relic falls short
Seats drive the bill, and reviewers report pricing changes and slow dashboards. The free tier stops ingest at 100 GB until you upgrade. Extra retention applies to every data type, not just logs. There's no on-call or status page: Hyperping and Better Stack include those, and SigNoz has no seat fees at all.
Is New Relic right for you?
Pick New Relic if you'll use its APM and only a few people need the full logs UI. If every engineer needs live tail, the seats cost more than most tools on this list.
SigNoz: Best for OpenTelemetry logs, traces, and metrics
SigNoz is an open-source, OpenTelemetry-native tool for logs, traces, and metrics on ClickHouse. You can run it yourself or pay for SigNoz Cloud, priced per GB by how long you keep the data.
| Best for | Starting price | Main limitation |
|---|---|---|
| OpenTelemetry logs, traces, and metrics | $49/mo; free self-hosted | Weak alerting; heavy to self-host |
Who SigNoz is built for
Teams already instrumenting with OpenTelemetry who want logs and traces in one tool, without seat fees, and who like having a self-hosted way out. A team that wants logs next to uptime checks and on-call will need other tools alongside it.
Notable features
- OpenTelemetry first. Plus Fluent Bit, Fluentd, Logstash, HTTP, and 50+ sources.
- Pipelines. Parse and mask personal data in the UI before storage.
- Query builder. Aggregations, percentiles, formulas, and raw ClickHouse SQL.
- Live View. Streams new logs as they arrive.
- Alerts. Error-rate formulas and no-data alerts, with a link to the related logs, sent to PagerDuty, Opsgenie, incident.io, Rootly, and others.
- Self-hosted. Free Community Edition.
Why choose SigNoz for log management?
Logs and traces in one place, with no seat fees. Everyone on the team can search, and a log line links to its trace.
You pick retention per GB. Fifteen days is $0.30 per GB and a year is $1.40, so you pay for exactly the window you need.
You can run it yourself. If cloud costs climb, the same product runs on your own servers.
What users say
Alerting is the weak spot people mention. From a July 2026 Hacker News comment:
"SigNoz has great dashboards and trace and metrics monitoring, but its alerting system isn't great."
How much does SigNoz cost?
- Community Edition: free, self-hosted
- Teams: $49/month minimum, which counts toward usage. Logs cost $0.30/GB at 15 days, $0.40 at 30 days, $0.60 at 90 days, and $1.40 at a year
- Enterprise: from $4,000/month
Fifty GB at 30-day retention is $20 of usage, so the bill is the $49 minimum.
Where SigNoz falls short
Self-hosted users report ClickHouse memory and CPU blowups and upgrades that break. Reviewers call the alerting weak and the docs and UI uneven. Changing retention on Cloud goes through support. There's no on-call, incident, or status page, which Hyperping and Better Stack include. There are no G2 reviews.
Is SigNoz right for you?
Pick SigNoz if you're on OpenTelemetry and want logs and traces together without paying per seat. If you plan to self-host, budget someone's time for ClickHouse.
Sentry Logs: Best for logs next to errors and traces
Sentry Logs adds structured logs to Sentry, linked to the errors, traces, and session replays you already collect there. Every plan, including the free one, includes 5 GB a month.
| Best for | Starting price | Main limitation |
|---|---|---|
| Logs next to errors and traces | Free 5 GB; $26/mo | 30-day cap; basic search |
Who Sentry Logs is built for
Developers already using Sentry for errors who want application logs in the same place, at modest volume, and rarely look further back than a few weeks. It's a weak fit for syslog from servers or for an audit trail.
Notable features
- Ingest. Sentry SDKs with logging turned on, an OpenTelemetry endpoint, and drains from Vercel, Cloudflare, Heroku, and Supabase.
- Linked context. Logs connect to the error, the trace, and the replay.
- Search. Text and attribute search.
- Live tail. Pauses above 100 logs a second or after 10 minutes.
- Log alerts. Metric monitors on log queries, routed to Slack or PagerDuty on Team and above.
- Self-hosted. Logs run on self-hosted Sentry too.
Why choose Sentry Logs for log management?
It's already in your app. If the Sentry SDK is installed, turning on logs is a config change.
The context is linked. An error shows the log lines around it, and a log line links to its trace.
No seat fees. Team and Business include unlimited users.
What users say
People who've tried it call it early. From an April 2026 Hacker News comment:
"However, sentry logs is pretty green, slow, and doesn't do much."
How much does Sentry Logs cost?
- Developer: free, 1 user, 5 GB of logs, 7-day search, email alerts
- Team: $26/month yearly ($29 monthly) with 5 GB of logs and 14-day search
- Business: $80/month yearly ($89 monthly) with 5 GB of logs and 30-day search
- Logs over 5 GB: $0.50/GB from a pay-as-you-go budget
Fifty GB with 30-day search needs Business: $80 plus 45 GB at $0.50, for $102.50 a month.
Where Sentry Logs falls short
Retention stops at 30 days on every plan, including Enterprise. Search is basic next to a dedicated log tool, and live tail is unreliable according to several reviewers. When the pay-as-you-go budget runs out, new data is dropped for the rest of the month. There's no on-call, which Hyperping includes, and $0.50 per GB is the highest overage rate on the list.
Is Sentry Logs right for you?
Pick Sentry Logs if your team already lives in Sentry and logs are for debugging application errors. For server logs, paging, or more than a few weeks of history, add a dedicated tool.
Head-to-head
Hyperping vs Better Stack
Both put log alerts on an incident that can page someone and update a status page. Better Stack's logs are cheaper per GB ($0.15 in the US against Hyperping's $0.25), and it adds traces and SQL. Hyperping includes on-call seats in the plan and attaches the log lines to every incident automatically, where Better Stack charges $29 per responder. Pick Better Stack if one person gets paged and you send a lot of logs. Pick Hyperping if the whole team rotates on call.
Datadog vs New Relic
Both put logs next to APM. Datadog charges for ingest and again per million indexed events, with unlimited users. New Relic gives you 100 GB free with no indexing fee, then charges per user. Datadog is cheaper for a big team with a modest number of indexed logs. New Relic is cheaper for a small team, as long as only a few people need paid seats.
Grafana Cloud vs SigNoz
Both have a self-hosted way out. Grafana Cloud is cheaper at 50 GB ($35 against $49) and fits teams already on Prometheus and Grafana, but LogQL and label limits take work. SigNoz is built on OpenTelemetry, keeps logs and traces together on ClickHouse, and searches high-cardinality fields more easily. Pick Grafana if you already use Grafana, and SigNoz if you're starting from OpenTelemetry.
Axiom vs Better Stack
Both are cheap for raw log volume. Axiom's $25 plan takes up to 1 TB and keeps data as long as you want, but has no on-call. Better Stack's logs cost less than $25 up to roughly 100 GB in the US and 160 GB in Europe, and it includes incidents and status pages, with paging per responder. Pick Axiom for volume and long retention, Better Stack if you want the alert to open an incident in the same tool.
Do I need a log tool or an observability platform?
A log tool (Hyperping, Better Stack, Axiom, Grafana Cloud) stores and searches log lines and alerts on them. An observability platform (Datadog, New Relic, SigNoz) adds traces and metrics so you can follow one request across services. If you run a monolith or a few services, logs plus uptime checks answer most questions. Once you're debugging calls between a dozen services, you'll want traces.
Which one should you pick?
| Buyer or situation | Recommended tool | Reason |
|---|---|---|
| The person paged for a failed monitor should see the logs | Hyperping | Logs on every incident, on-call included |
| Lowest log bill, one or two people on call | Better Stack | $0.10 to $0.15/GB ingest |
| Already on Datadog APM | Datadog | Logs one click from traces |
| Already on Grafana and Prometheus | Grafana Cloud Logs | 50 GB free, LogQL, self-hosted Loki |
| Hundreds of GB a month, kept for months | Axiom | 1 TB for $25, any retention |
| Small team, mostly free, plans to use APM | New Relic | 100 GB a month free |
| OpenTelemetry everywhere, no seat fees | SigNoz | Logs and traces on ClickHouse |
| Already on Sentry, logs for app debugging | Sentry Logs | 5 GB free, linked to errors |
| Logs from a single cloud and nothing else | CloudWatch or Google Cloud Logging | Already turned on, listed below |
If you're spending under $50 a month, Axiom, Grafana Cloud, and SigNoz all cover 50 GB, and Better Stack covers it for about $12 if nobody needs phone paging. Those prices don't include an on-call tool, which is where PagerDuty or Better Stack's responder licenses add up for a team of five.
What you already run decides a lot. If you're on Sentry, try its logs before buying anything. If Datadog or New Relic already runs your APM, adding logs there is easier than linking two tools. If your monitors, on-call, and status page are on Hyperping, adding logs there keeps the alert, the logs, and the page in one incident.
Other credible options
Observability suites
| Tool | Main strength | Main limitation | Good for |
|---|---|---|---|
| Dynatrace | AI root cause across logs and traces | No free tier, annual commitment | Large enterprises |
| Splunk | Search over messy, unstructured data | Quote-only, among the priciest | Security and compliance teams |
| Sumo Logic | Free ingest, billed by scans | Hard query language, slow long searches | Teams that search rarely |
| Coralogix | Routes logs by priority to cut cost | Steep learning curve, no free tier | Cost-conscious mid-size teams |
| Honeycomb | High-cardinality queries on events | Billed per event, traces come first | Teams debugging with traces |
| Elastic Cloud | Full-text search and Logstash pipelines | Tuning takes engineering time | Teams that know Elasticsearch |
| LogicMonitor | Logs next to infrastructure metrics | No public price | IT teams already on LogicMonitor |
| Site24x7 AppLogs | Logs inside a cheap monitoring suite | Confusing add-on billing | Zoho and Site24x7 customers |
Hosted log search
| Tool | Main strength | Main limitation | Good for |
|---|---|---|---|
| Papertrail | Fast setup and live tail | Now $5/GB on SolarWinds Observability | Old Heroku apps |
| Loggly | Free 200 MB a day | Dated UI, daily caps | Very small apps |
| Sematext | Low per-GB prices, OTel and MCP | Reports of downtime and a slow UI | Small teams on a budget |
| Mezmo | Pipeline to filter logs first | No public prices or free plan | Teams cutting volume before storage |
| Logz.io | Managed OpenSearch | Free plan dropped, surprise bills | Teams that want Kibana without running it |
| Dash0 | OpenTelemetry native, no base fee | No free tier, young product | Teams starting on OTel |
| Last9 | No host or user fees | Starts at $1,150/month | Larger platform teams |
| Middleware | Logs, traces, metrics at $0.30/GB | Free plan has come and gone | Small teams watching price |
Cloud provider logging
| Tool | Main strength | Main limitation | Good for |
|---|---|---|---|
| AWS CloudWatch Logs | On by default in AWS | Keeps logs forever unless you set retention | AWS-only stacks |
| Google Cloud Logging | 50 GiB free per project | Awkward queries, slow long searches | GCP-only stacks |
| Azure Monitor Logs | KQL and cheap Basic tier | Analytics logs are expensive | Azure-only stacks |
Open source and self-hosted
| Tool | Main strength | Main limitation | Good for |
|---|---|---|---|
| Graylog | Free with no ingest cap | Complex setup and upgrades | IT and security teams |
| OpenSearch | Apache 2.0 Elasticsearch fork | Cluster tuning is work | Teams already on the ELK pattern |
| ClickStack | ClickHouse plus HyperDX UI | Managed version still in beta | Teams that like ClickHouse |
| VictoriaLogs | Fast, simple to run | High availability means two clusters | Self-hosters on a small budget |
| OpenObserve | One binary for logs, metrics, traces | Clunky UI | Small self-hosted setups |
| Parseable | Parquet on S3, a year of retention | Little user signal | Long retention on object storage |
| Seq | Free for one user, great for .NET | Self-hosted only | .NET and Serilog shops |
| Uptrace | 50 GB free cloud tier | Messy UI | OTel users on a budget |
How to test log management tools
Every tool on the shortlist has a free plan or a trial:
- Hyperping: 14-day trial of paid plans, which is where logs are, no card
- Better Stack: free plan with 3 GB of logs kept 3 days, and a 60-day money-back guarantee on paid plans
- Datadog: 14-day trial with logs, no card
- Grafana Cloud: free tier with no card, plus a 14-day trial with no usage limits
- Axiom: free Personal plan with no card, for one user
- New Relic: free tier with 100 GB a month, no card
- SigNoz: 30-day cloud trial with no card, or self-host for free
- Sentry: 14-day Business trial with no card, then the free Developer plan
A demo dataset won't tell you how the tool pages people. Break things on purpose:
- Send the same logs to every trial. An OpenTelemetry Collector or Vector can fan one source out, so you compare the same lines and the same volume.
- Make a service log errors for two minutes and time how long until someone's phone rings. On Axiom, New Relic, SigNoz, and Sentry, that includes the PagerDuty hop.
- Kill a process that logs every few seconds and check whether a silence or no-data alert fires.
- Open the alert or incident and see whether the log lines are already there, or whether you have to go search for them.
- Turn on debug logging for an hour and watch the usage page. Multiply by a month.
- Search for a request ID from 25 days ago to confirm the retention you're paying for.
- Price your real volume in uncompressed GB, your number of engineers, and whether each one needs a seat or an on-call license.
Give every log alert an owner who can fix the service it watches. An alert nobody owns gets muted within a week.
Related reading
- Log monitoring docs: sources, retention, and log alerts in Hyperping
- Hyperping logs: what's included on each plan
- Hyperping vs Better Stack: the closest all-in-one comparison
- Server monitoring tools: host metrics next to your logs
- Hyperping pricing: log allowances and the per-GB rate
FAQ
What are the best log management tools? ▼
Hyperping for logs attached to the incident your uptime or log alert opened, with on-call included. Better Stack for low per-GB log prices. Datadog for logs next to APM and infrastructure. Grafana Cloud Logs for Loki and LogQL. Axiom for high log volume on a $25 plan. New Relic for 100 GB a month free. SigNoz for OpenTelemetry with a self-hosted option. Sentry Logs for logs next to errors and traces.
What is log management? ▼
Log management collects log lines from your apps, servers, and platforms in one place, keeps them for a set number of days, lets you search and tail them, and alerts when a pattern shows up or a source goes quiet. Error tracking groups exceptions, APM follows requests across services, and uptime monitoring checks from the outside. They're related purchases, but they answer different questions.
How much does log management cost for 50 GB a month? ▼
From public pricing in October 2026, for 5 engineers, 50 GB a month, and 30 days of search: Axiom about $25, Grafana Cloud about $35, SigNoz $49, Hyperping Essentials $54.25 with on-call included, Sentry Business $102.50, Datadog about $130 on an annual contract before paging, and New Relic about $206 with one full and four core users. Better Stack logs cost about $11.50 in the US region, or about $156.50 with five on-call responder licenses.
Is Datadog log management expensive? ▼
It bills twice. Ingest is $0.10 per GB, and every log you want to search or alert on is indexed at $1.70 per million events for 15 days or $2.50 for 30 days on an annual contract. There's no free tier for logs. Teams with high volume usually index a subset and archive the rest.
What's the best free log management tool? ▼
Axiom's free plan takes 500 GB a month with 30-day retention for one user. New Relic gives 100 GB a month with one full user and unlimited basic users. Grafana Cloud gives 50 GB with 14-day retention and 3 users. Self-hosted Loki, SigNoz, Graylog, and OpenSearch cost nothing in licenses but need someone to run them.
Does Hyperping do log management? ▼
Yes, in beta on paid plans. Hyperping ingests logs over OpenTelemetry, HTTP, syslog over TLS, and platform drains like Vercel, Heroku, and CloudWatch. You get search, live tail, saved views, and log alerts that open incidents, and every incident shows the log lines from 15 minutes before it started. Essentials includes 5 GB a month, Pro 20 GB, and Business 50 GB, then $0.25 per GB once metered billing starts. Logs aren't available on the Free plan or on EU-only accounts.
Do I need a log management tool if I already use Sentry? ▼
Maybe not at small volume. Sentry Logs includes 5 GB a month on every plan and links logs to errors and traces. If you need syslog, longer retention, log alerts that page an on-call rotation, or logs from services that don't run a Sentry SDK, add a dedicated log tool.