Hyperping.com changelog
New updates and improvements to hyperping.com.
Have any questions? Please chat with us at hello@hyperping.io or through the in-app chat!
Oct 21, 2024
New Uptime timeline
We've completely redesigned our uptime visualization to provide a more detailed and intuitive timeline. The new graph clearly displays outages and scheduled maintenance windows, helping you:
- Quickly identify patterns in service disruptions
- Better coordinate maintenance windows
- Share clear incident timelines with stakeholders

Monitor Logs (Beta)
Introducing detailed ping-by-ping monitoring data, accessible via /logs on any monitor report. This granular visibility enables you to:
- View complete response headers for non-2xx status codes
- Track response times across global locations
- Debug performance issues with millisecond precision
- Verify service availability from multiple regions
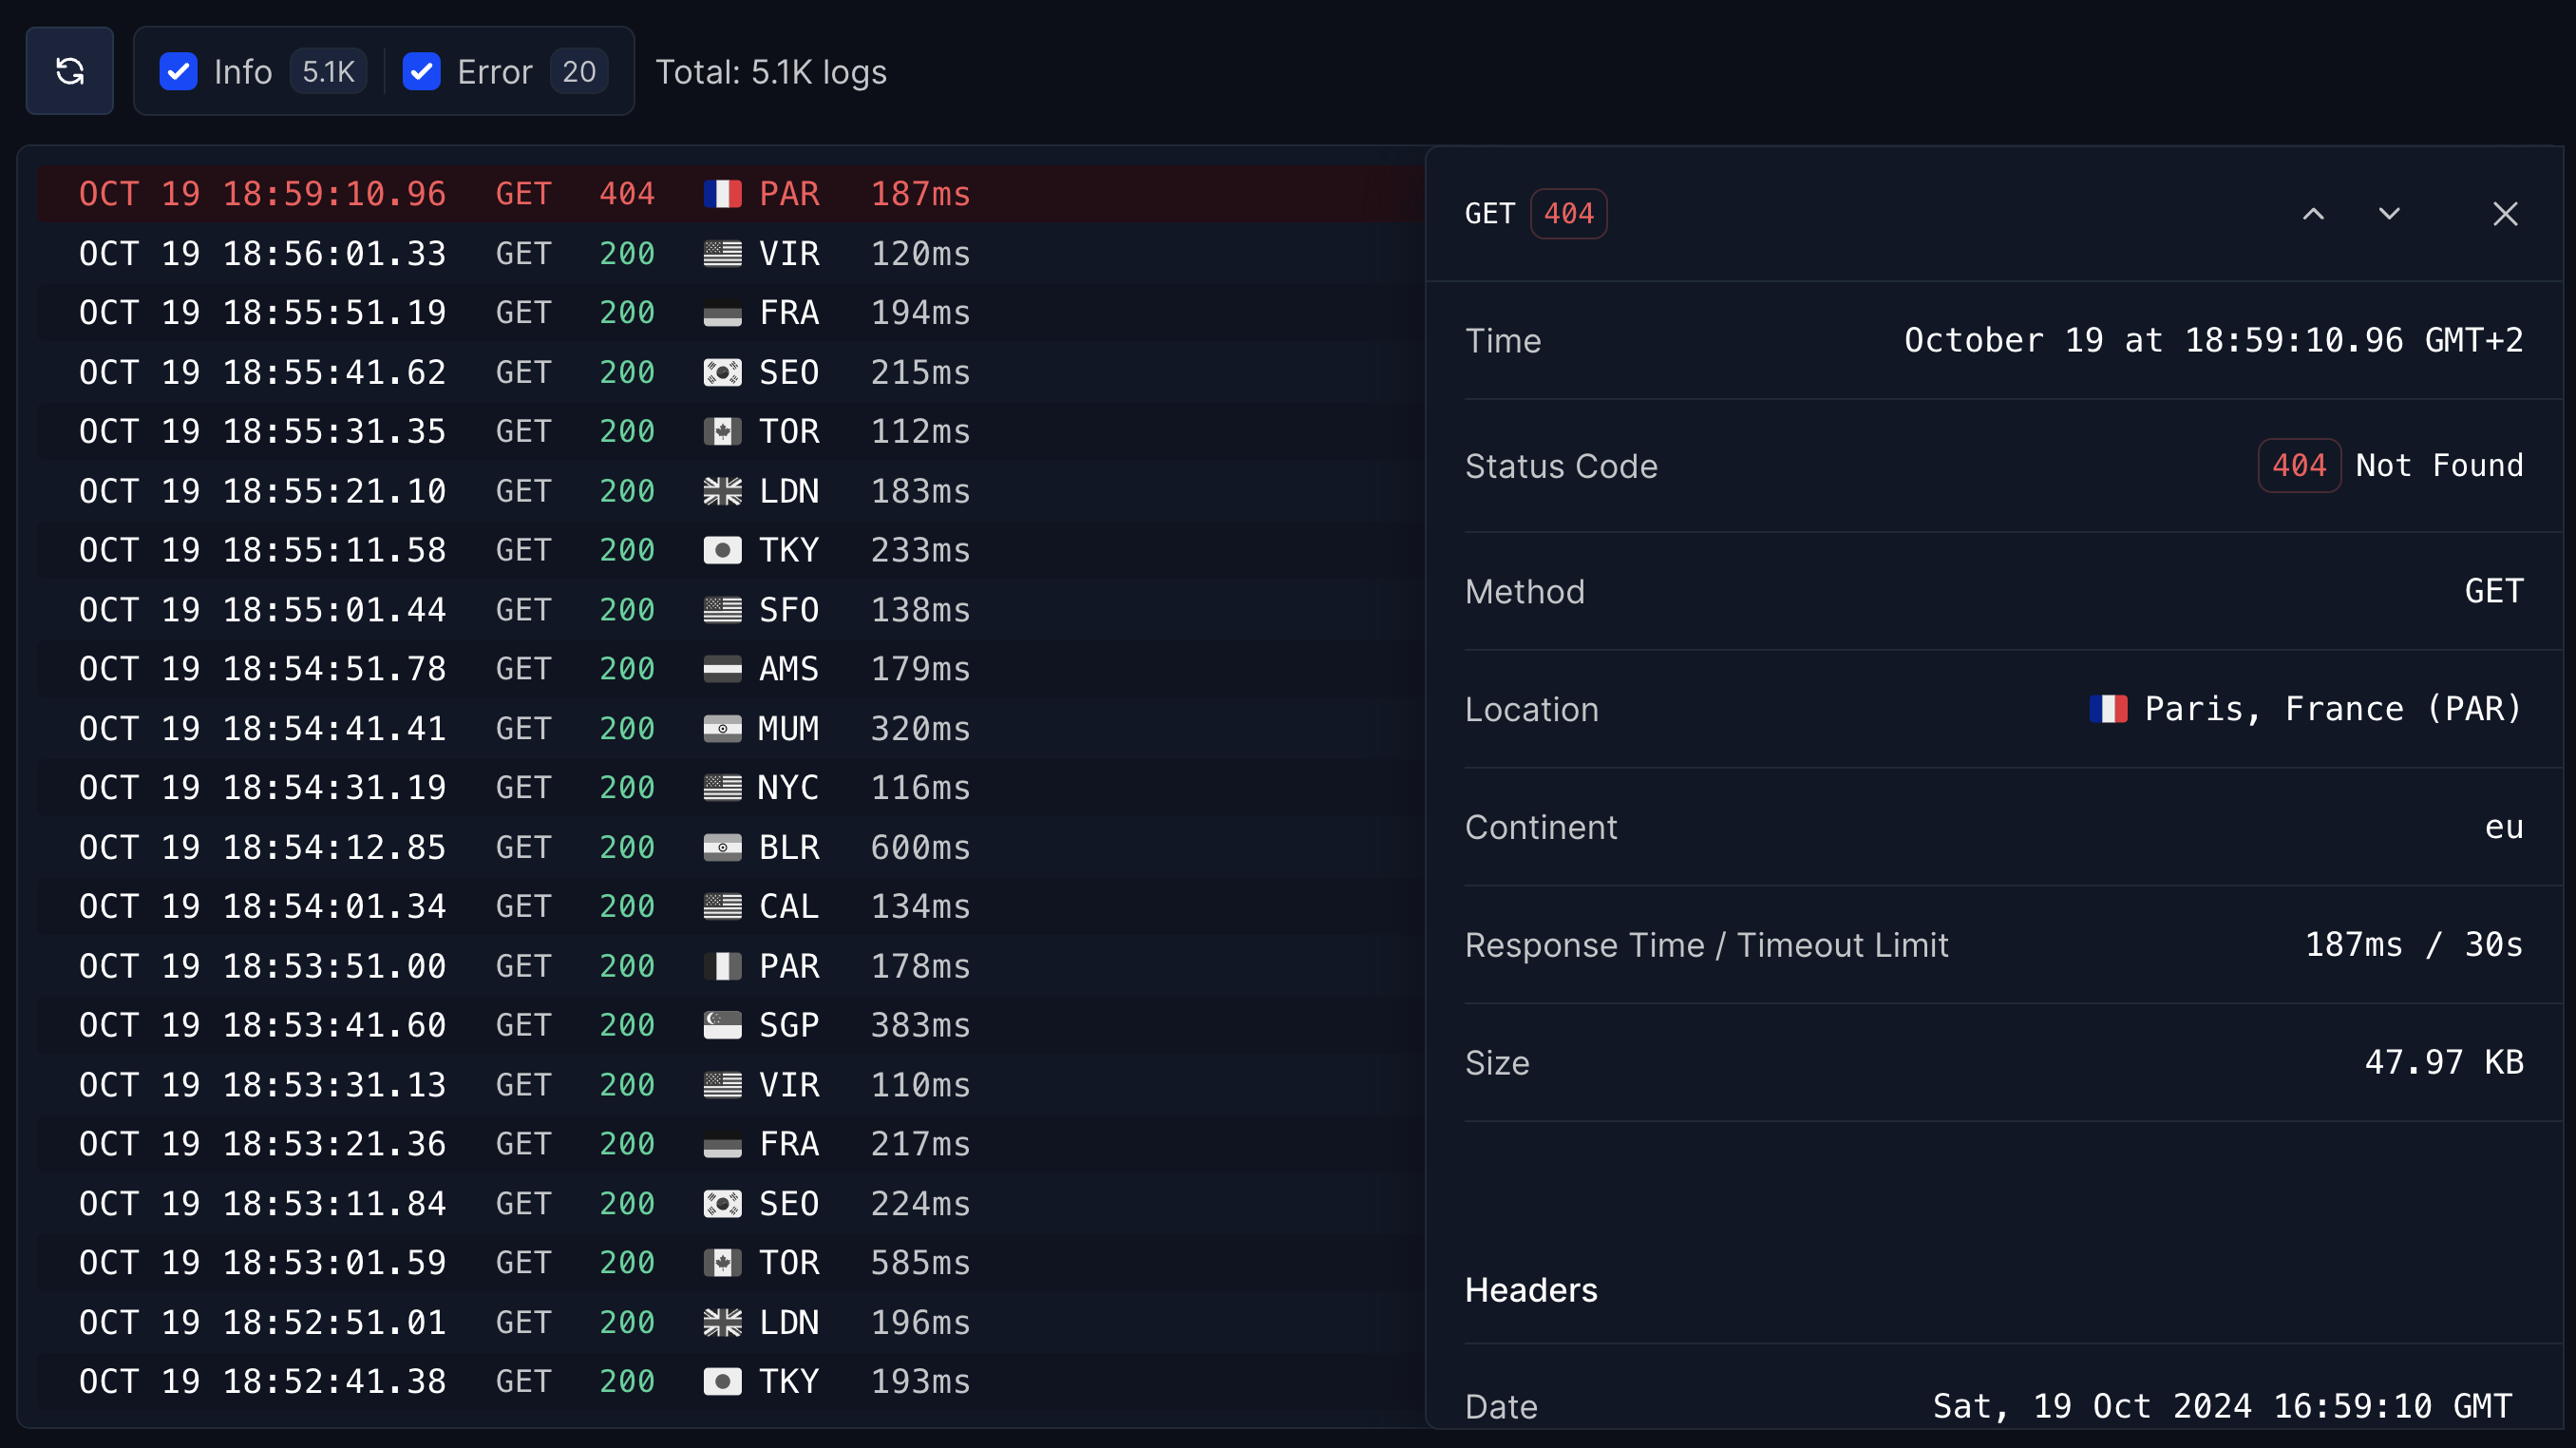
To access logs: Append /logs to any report URL (e.g., https://app.hyperping.io/report/mon_uuid/logs)
April 30, 2024
Phone call alerts
Receive hyperping.io alerts via a phone call during an outage. Can only be enabled using an escalation policy.
Read more: https://hyperping.io/docs/integrations/phonecall
Misc
- Better rotation of continents when pinging
- Monitor reports now show who has created the monitor and when (or via API)
- Monitor reports now show a “Down for” duration during an outage.
- Maintenance windows API updates:
- We added a “status” value that can be either upcoming, inprogress or completed.
- Add ?status=upcoming|inprogress|completed to filter by statuses
April 15, 2024
Escalation policies, new Sections & Subscribers views in status page settings, filters, unlimited channels per integration
Escalation policies
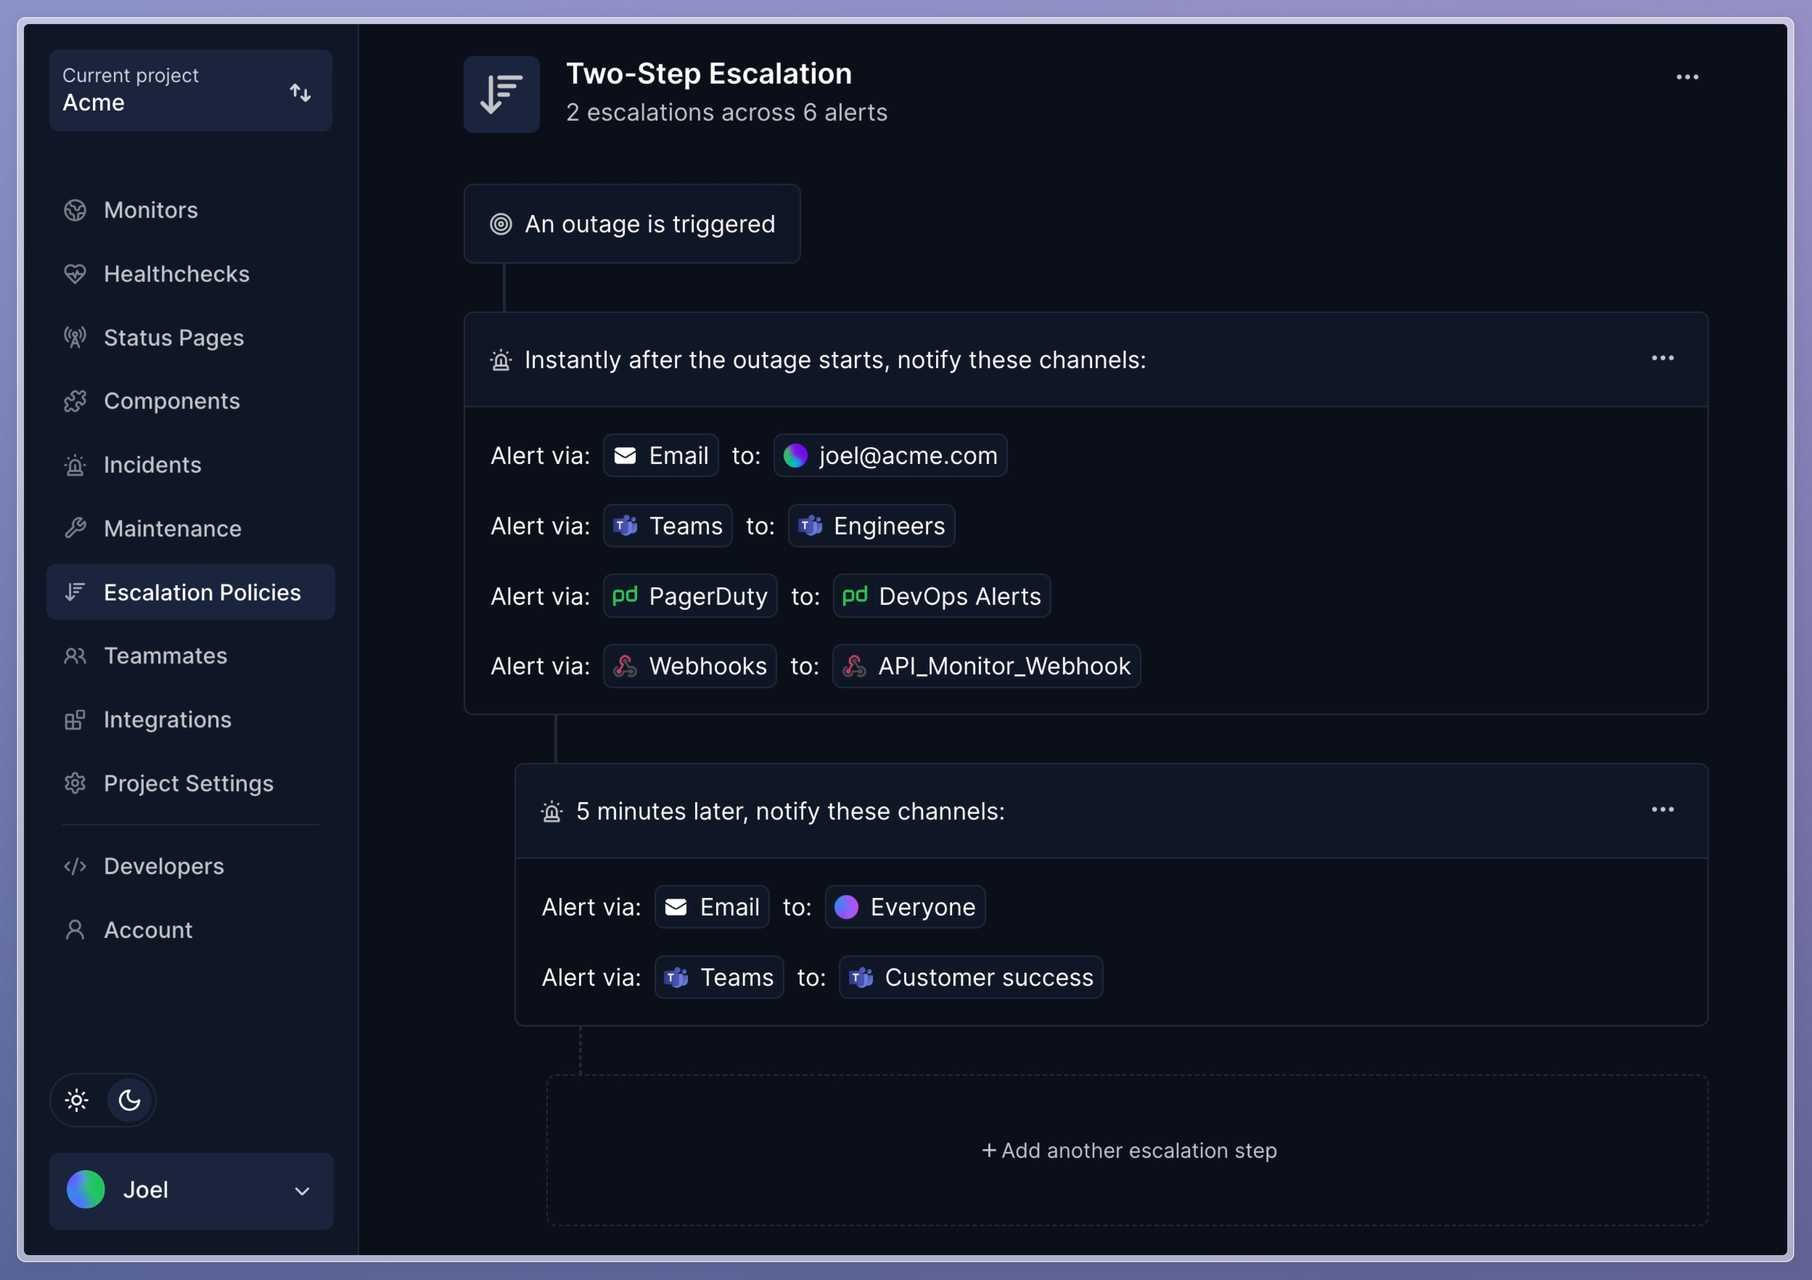
Set rules on how alerts escalade during an incident. It defines the order of channels that will be triggered for alerts. You can then assign one Escalation Policy per monitor. Try it here: https://app.hyperping.io/escalation-policies
Unlimited integration channels
You can now create as many channels per integration or webhook, and configure multiple escalation policies across multiple channels! Before, only one integration per project was possible.
Status page settings
The Sections & Subscribers views have been revamped, making it more intuitive to add monitors to your status page, show/hide uptime and response time graphs. The Subscribers view show you a comprehensive view of all the subscribed users of your status page, a better filtering system and some limit usage.
Filter monitors
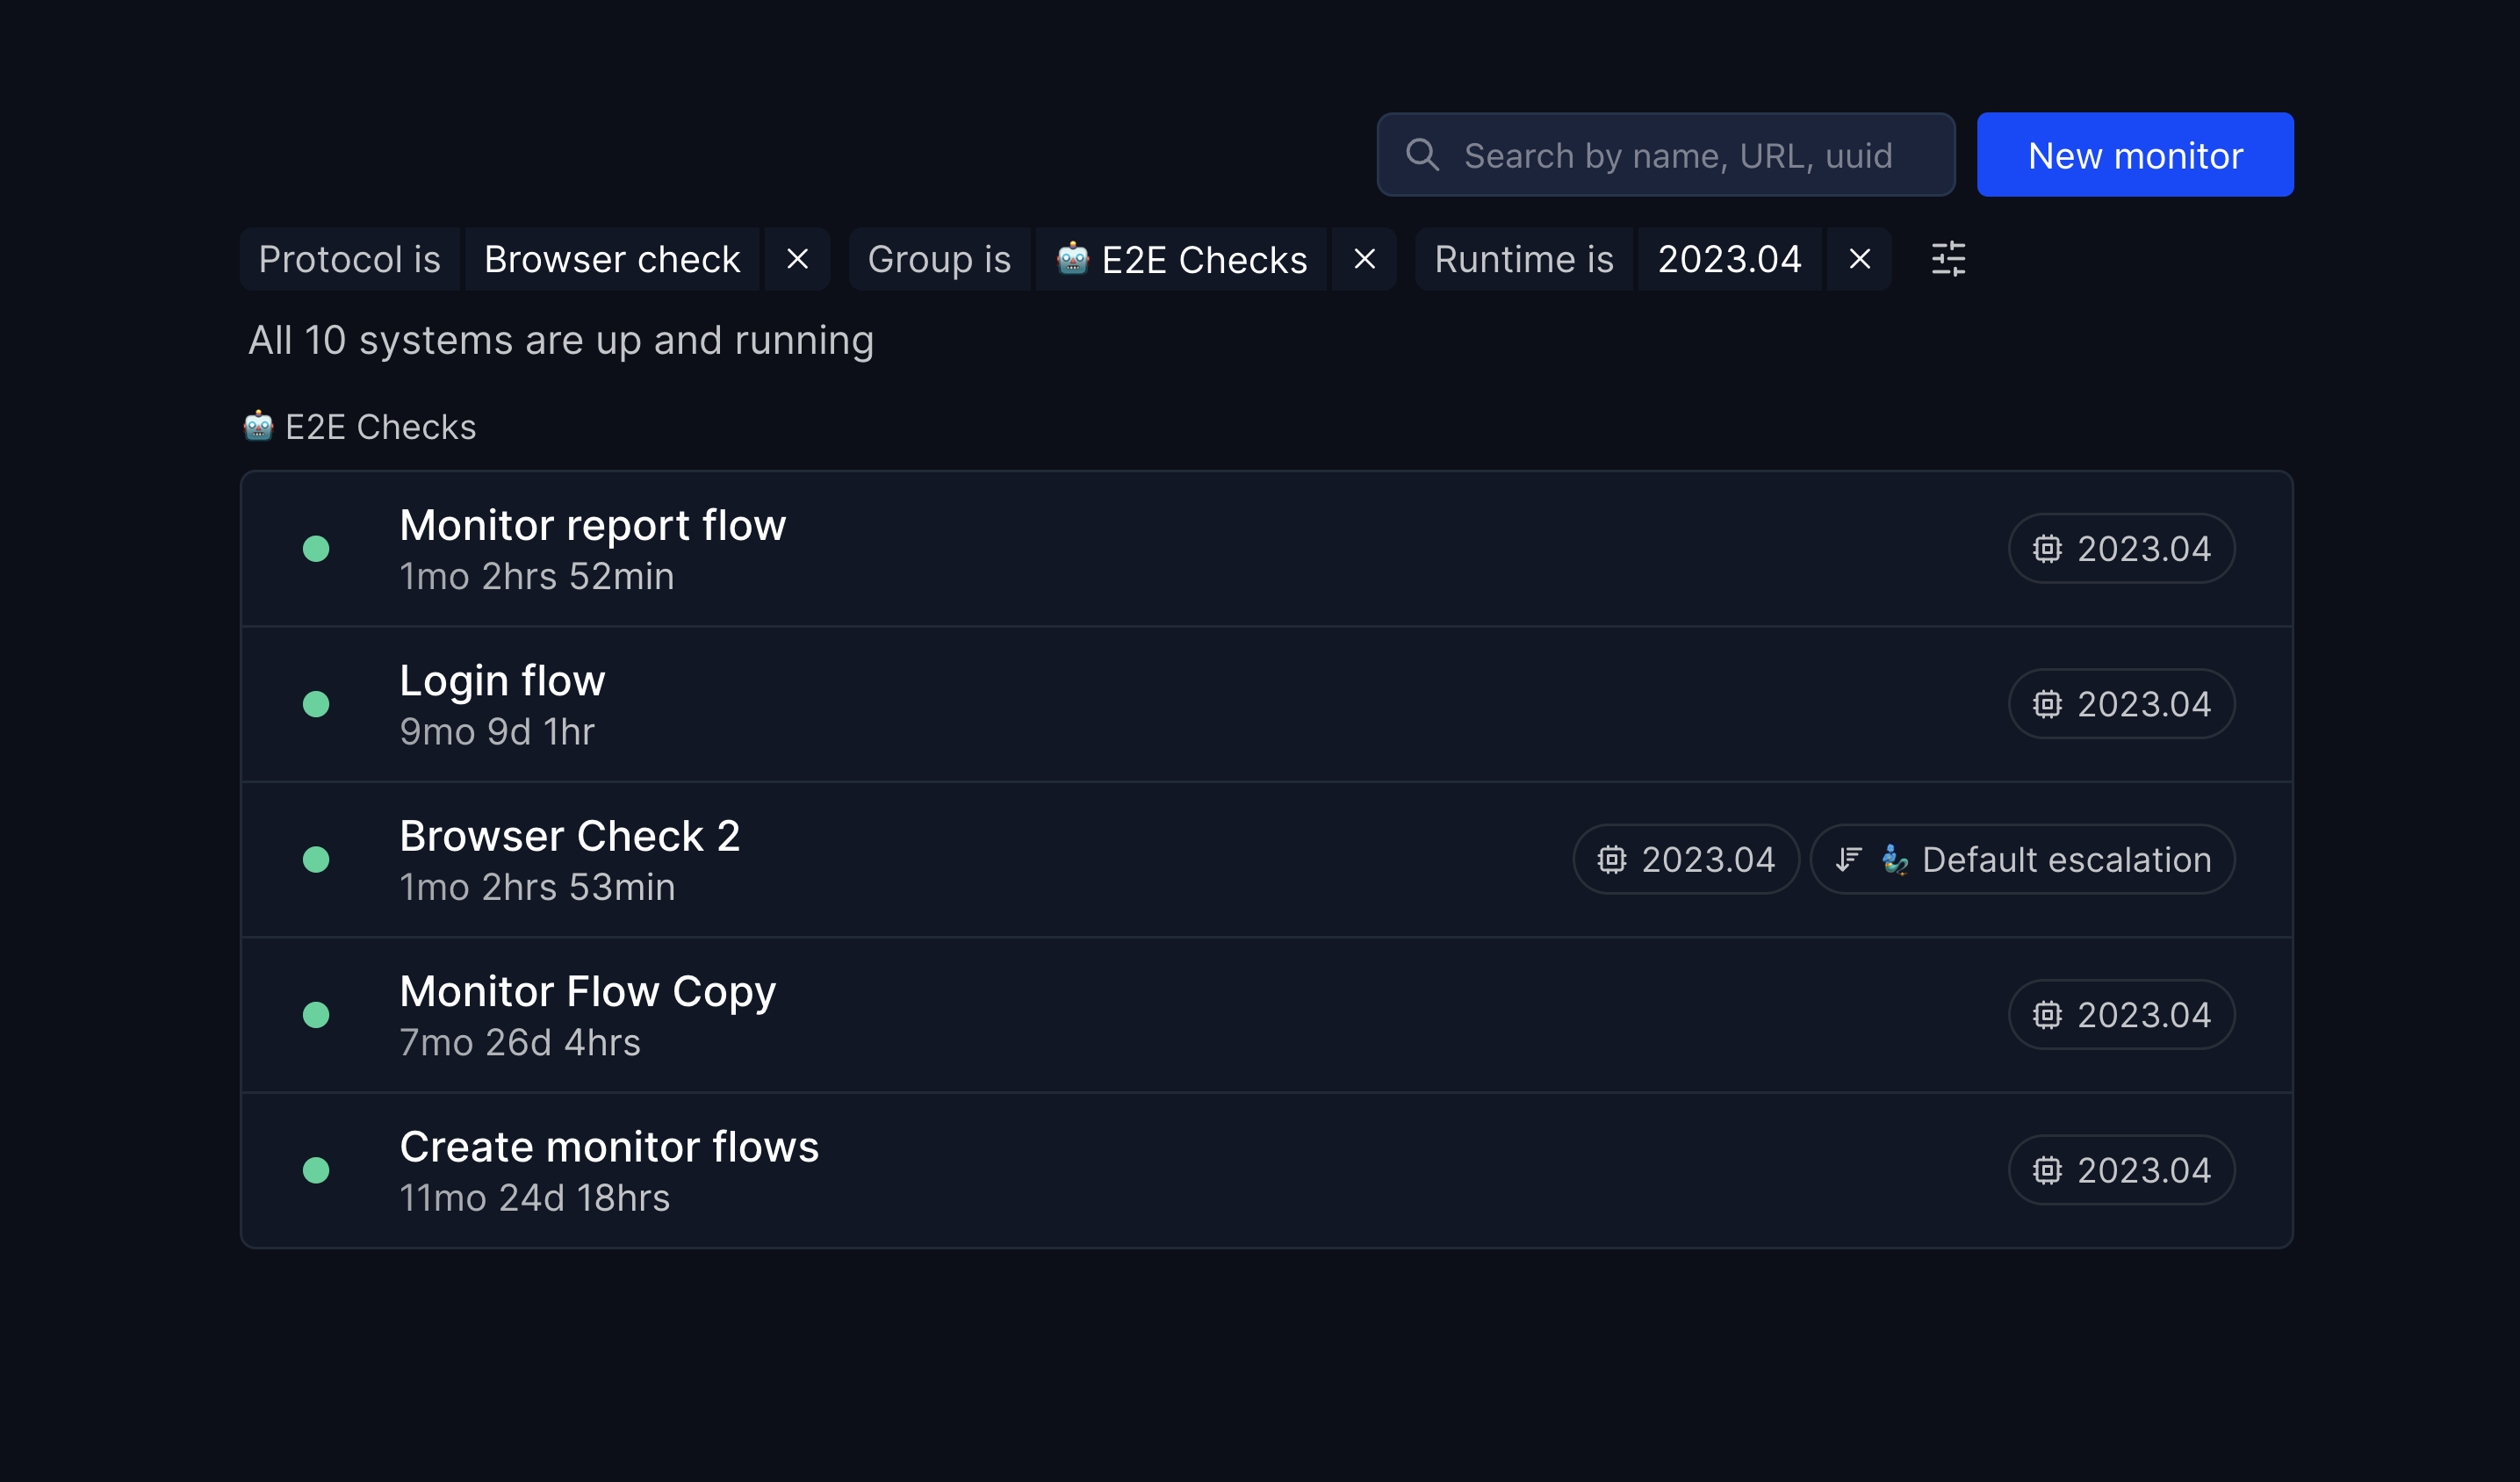
Filter your monitors using their protocol, escalation policy, group or browser check’s runtime. Filters are saved into your browser, so they will remain as you go back to the monitor list or refresh the page!
Misc
- Status page: show a description on hover of a service
- New monitoring region: 🇿🇦 Cape Town, South Africa
- New customer stories:
July 10, 2023
Browser Checks new runtime: @playwright/test & typescript supports
We’re happy to release our latest runtime: 2023.04!
- @playwright/test support
- Typescript support
- Includes playwright video records and traces
- Double check/consecutive fails: you can enable the double check option: upon failure, it will trigger a second attempt to confirm an outage before sending alerts
- Drop support of puppeteer
Misc
- Swapping project keeps the user in the same view
- Pricing/limit/usage: Teammates across multiple projects aren’t counted as different users anymore
Bug fixes
- Fix a bug where searching from the list of monitors would be cancelled after the monitor list updates
- New user story for Maker.io https://hyperping.io/customers/marker
- Fix a bug where maintenances would be shown on uptime bar of every monitor in status pages the day it was scheduled
- Fix a bug where the “Should fail” toggle on the body assertion feature was missing
- Fix a bug where the Discord integration Browser Check UP Alerts would not be sent
- Fix a bug where “Run before saving” for 2021.11 Browser Checks would render a blank page
- Fix a bug where users could not add a 256 or more characters url to monitor
April 24, 2023
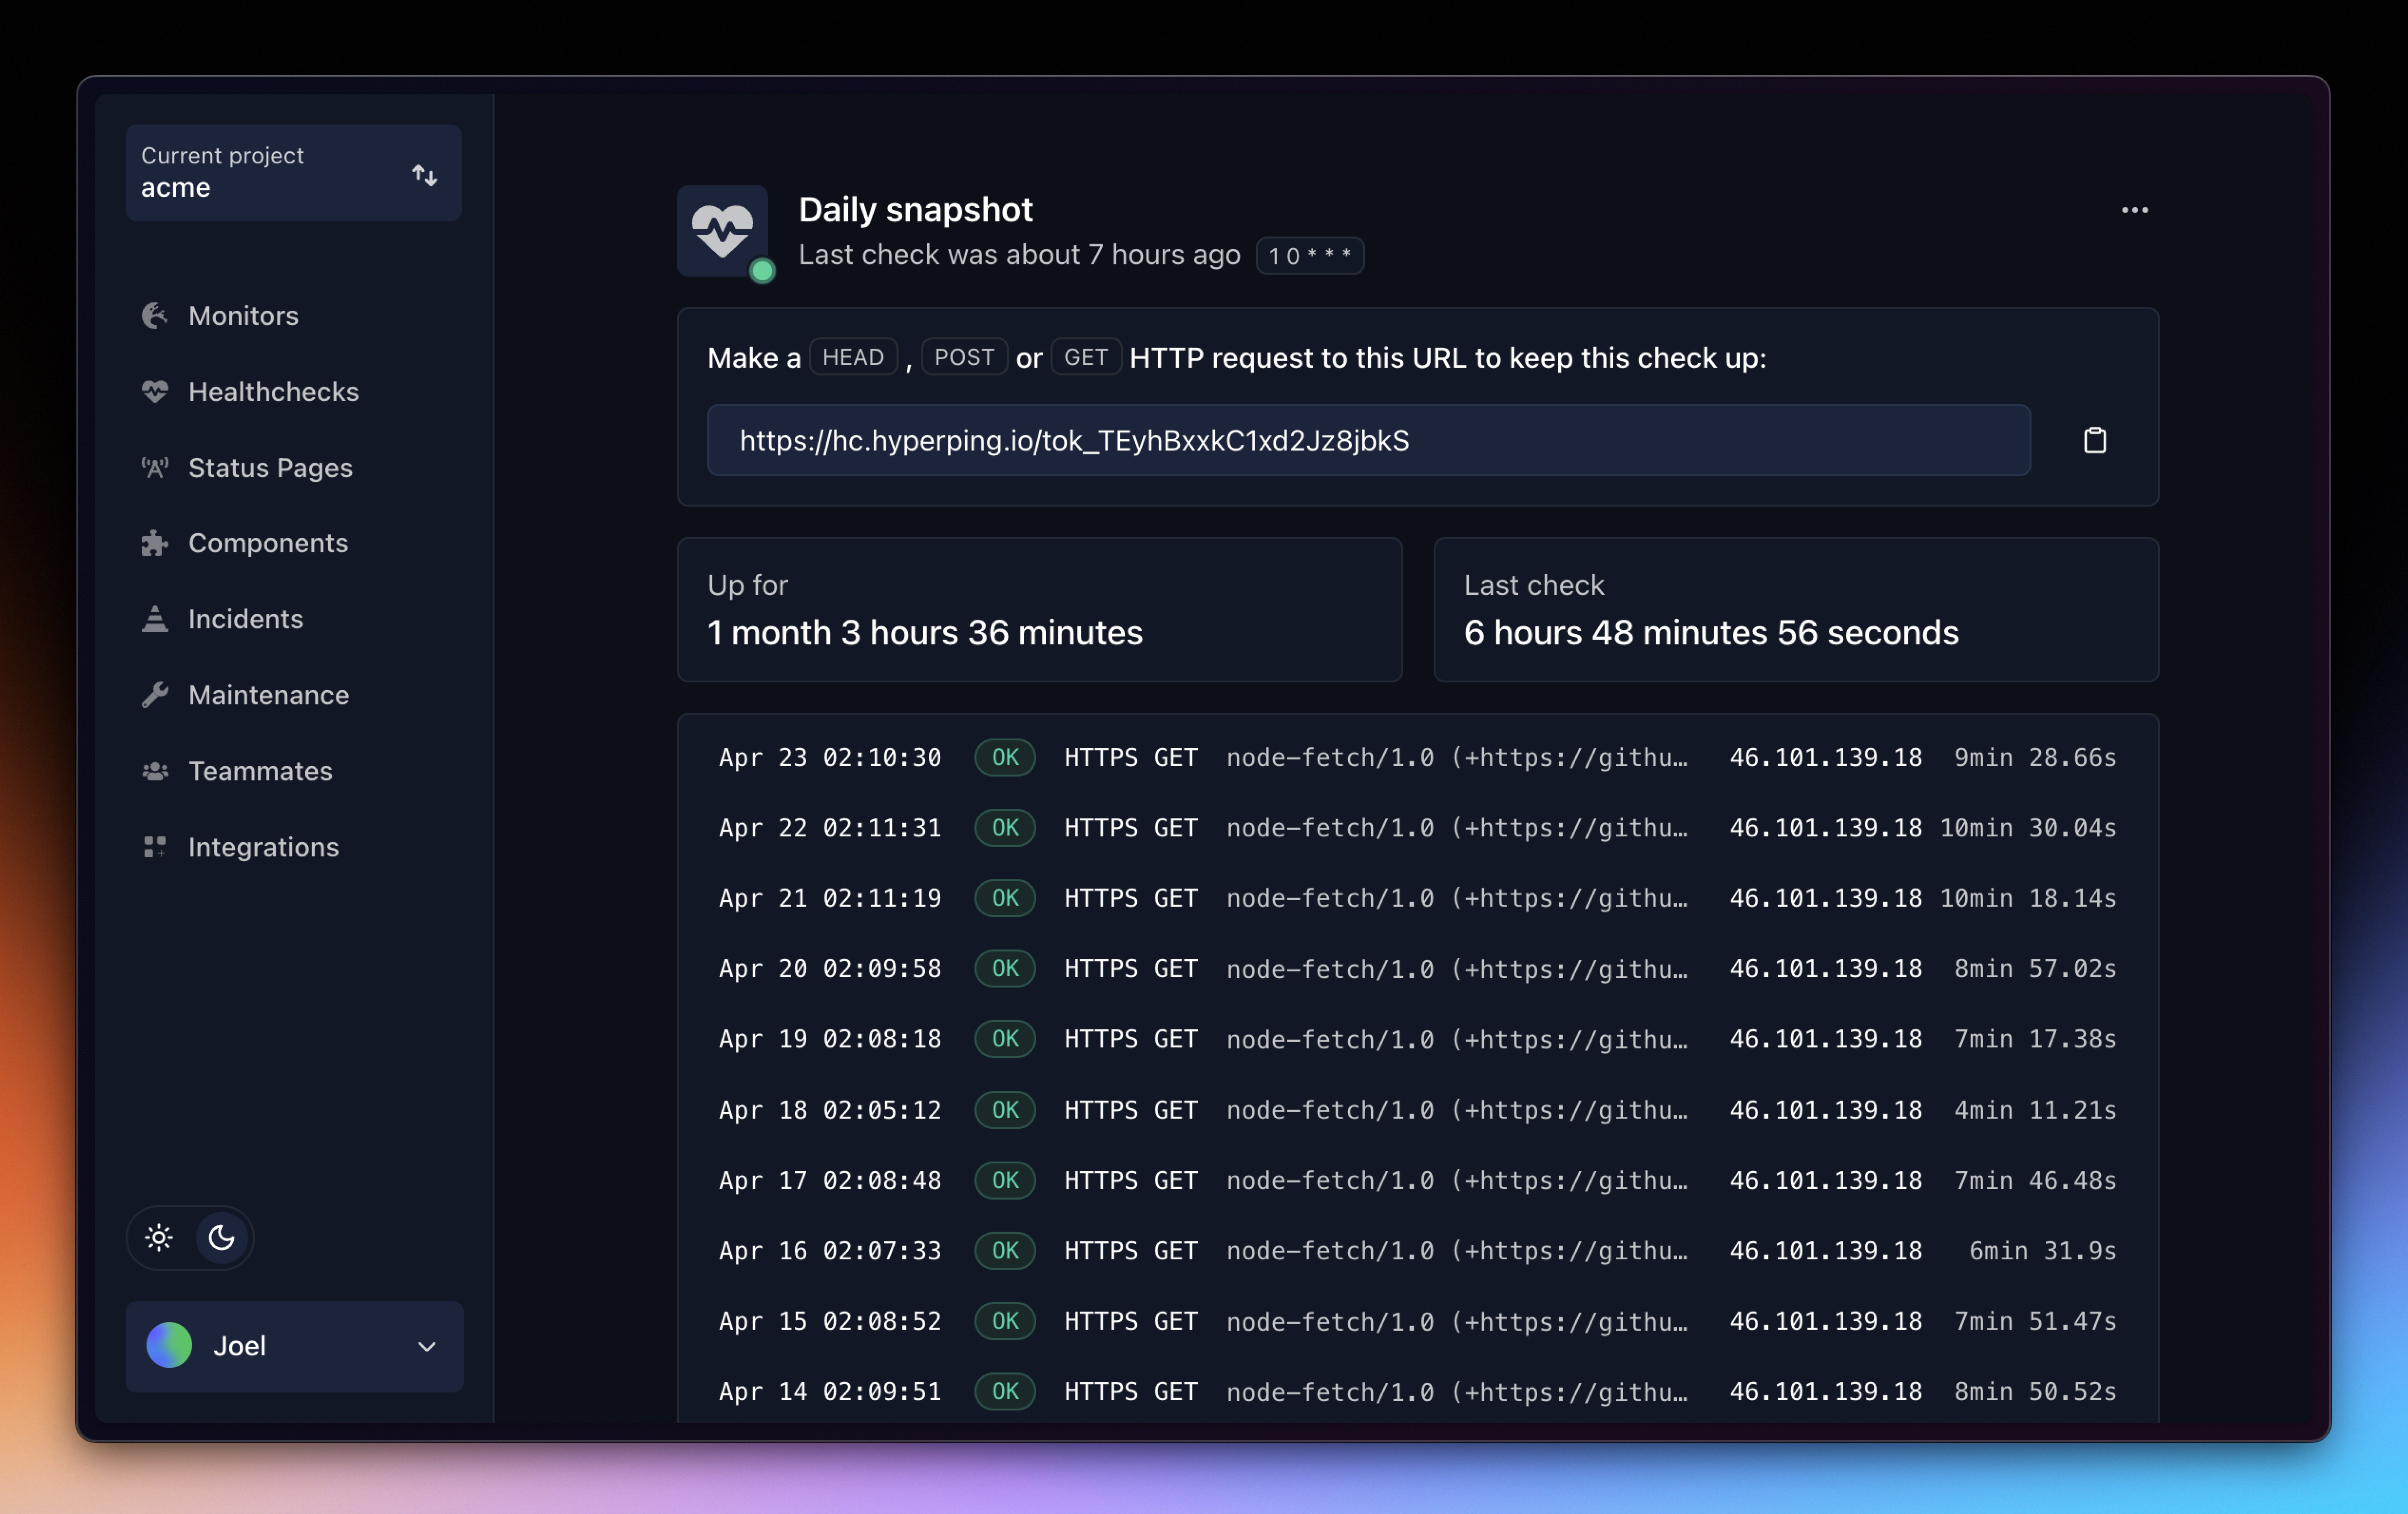
Healthchecks - Cron monitoring
We’re happy to announce our latest feature: Healthchecks!
You can now monitor your cron jobs or other periodic processes. Try now or read the doc.
Notification Channels for Each Monitor
You have the ability to choose the integration alerts for each individual monitor and for each team member separately.
Go to a Monitor Report → Notifications → Edit the channels
Browser Checks and Healthchecks Included in All Integrations
Previously, email and Slack integrations were the only options for healthchecks and browser checks. However, you now have the option to configure other integrations such as PagerDuty, Discord, or Microsoft Teams to receive these notifications as well.
- Improved date picker in report views
- Timelines are now shown next to the dates picker
- New timelines:
Month to date,Quarter to dateandYear to date
- Increased browser check timeout from 60 to 120 seconds
- New customer story by DynaPictures: https://hyperping.io/customers/dynapictures
March 13, 2023
Per continent response time chart
With our new per-continent response time chart, you can easily monitor the performance of your website in specific zones of the world, providing you with valuable insights for optimizing your online presence.
.png)
Redesigned monitors list
We have redesigned our dashboard to improve the visibility of your monitors' statuses, making it easier for you to quickly check which ones are up or down upon entering the page!
.png)
- HTTP breakdown now includes TTFB (Time To First Byte)
- Upon monitor creation, regions are now grouped by continent
- Fix a bug where the calendar would display the wrong day (Mon., Tue., etc) of the week (in report and maintenance views)
February 28, 2023
Dark & light modes
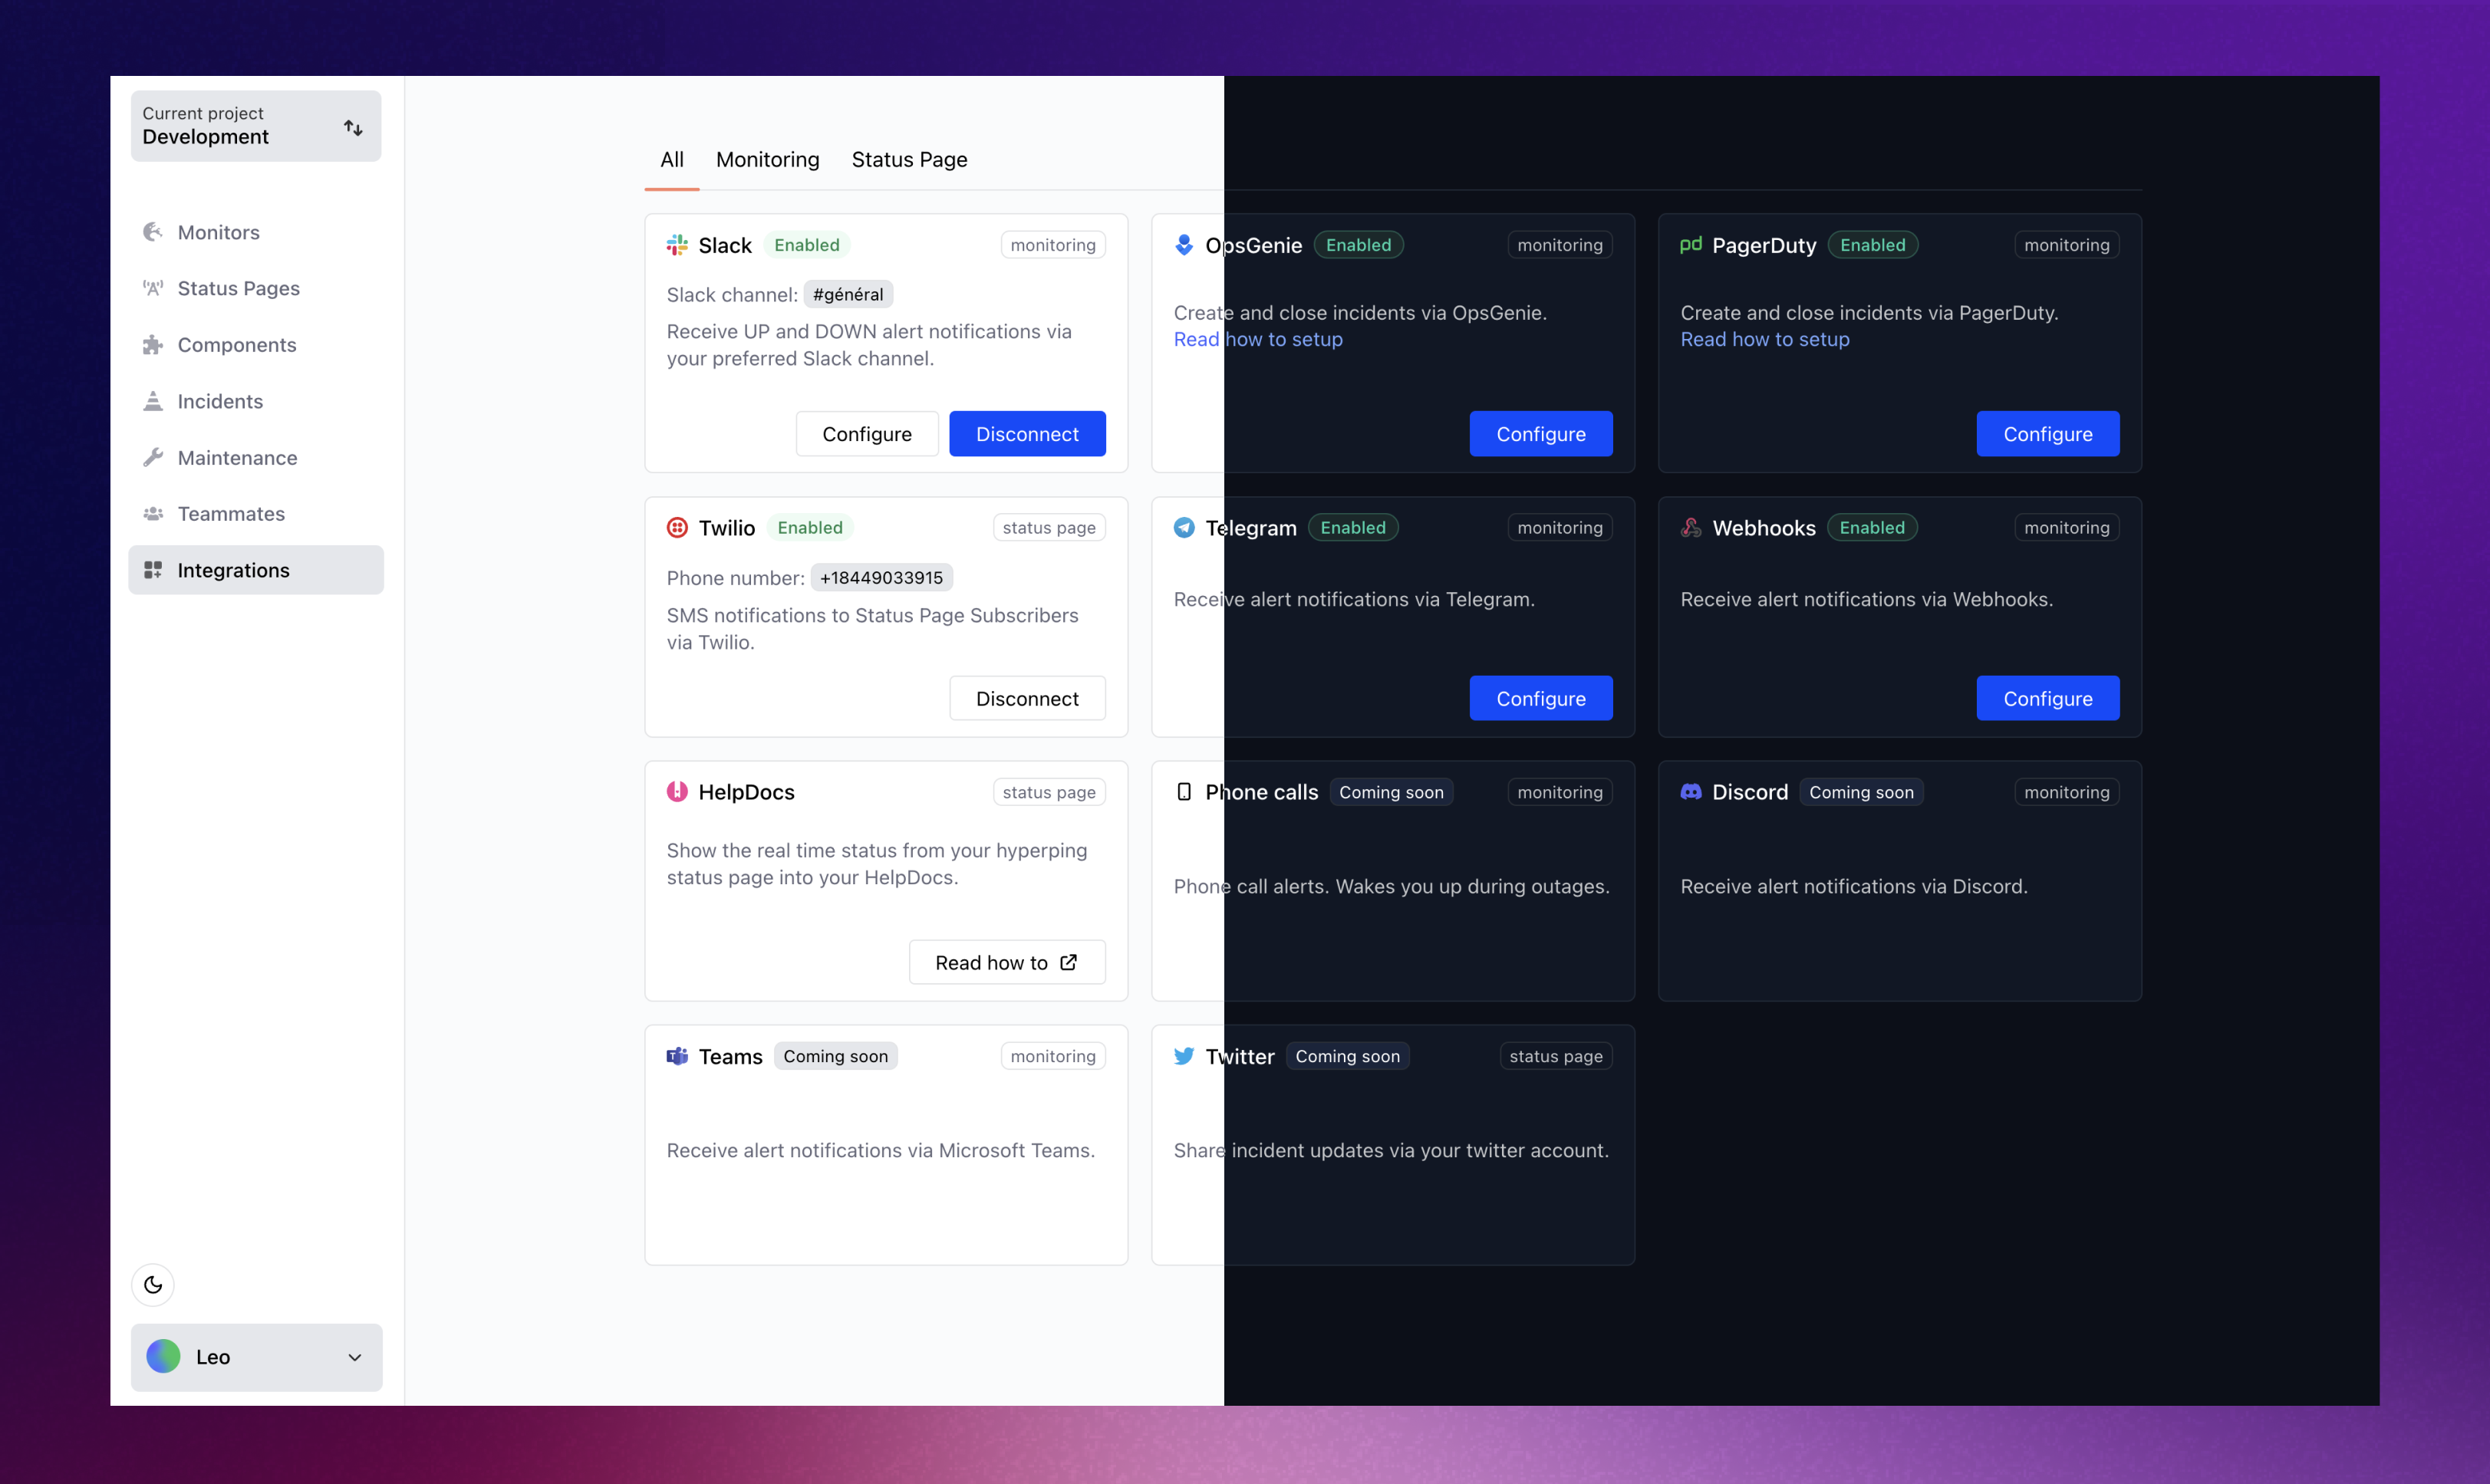
- Dark & light modes 🌓
- Shows the uptime (up for) in the monitors’ list and in the report views
- E.g.
Up for 1 month 16 days 25 minutes
- E.g.
- Revamped views; We improved the consistency of designs across all views
- Technical details: Our app has started with Angularjs and has become a hybrid form using React. We now have moved most of our views over React to iterate faster on new features
- New integration page, with new integrations:
- Discord webhook
- Teams webhook
- Search system & pagination for maintenance windows and incidents
- Refreshed, improved forgot password flow
- Report urls now use the monitor UUID
- Enforced login/session security
- Projects ids now use
proj_1234format rather than V4 uuids
January 20, 2022
REST API for maintenance windows
The first feature we release the REST API for is the maintenance windows! This one has been requested the most, and we’re glad to finally start to support developers to integrate Hyperping into their workflows.
Go to https://app.hyperping.io/project/developers and start building!
You can find the doc in here → API Reference
🇯🇵 Tokyo ping region
We’re happy to add a Tokyo server to our collection! Happy monitoring
IP for your whitelists: 52.69.40.215
Fixes & improvements
- Browser checks can be added to status pages
- Add a Login button to the https://hyperping.io website (Finally!)
- Sign up using Google SSO directly from the website: “Sign up with Google”
- Use
api.hyperping.io/v1instead ofapp.hyperping.io/api/v1 - Slack Incident integration
- Properly lists all public channels for Slack teams with more than 1000 channels
- Sort channels by date of creation
December 6, 2021
Browser check improvements
We are heavily continuing the development of our browser check product thanks to your feedback!
- 2 more server regions: 🇫🇷 Paris and 🇺🇸 New York
- Fix update monitor name
- Select custom check interval
- Select a region to test the code from before saving
- Remove Notifications tab
- Shows "Runs every x minutes" in dashboard view
- Shows a small browser icon whether the browser check uses chromium, webkit or firefox
Update customer details
You can now update your customer details by yourself in our billing section. Your data will be stored by Stripe and will be shown in your invoices. https://app.hyperping.io/settings/billing
Fixes & improvements
- Fix a bug where changing tab in report view would refetch the report data and cause an unnecessary reload
- In report view, move the Check Interval selector from the Notifications to the Settings tab
- Add more interval choices (up to 24 hours) for regular (http, ICMP & Port) protocols
- Revamp Project Selector (top-left)
November 26, 2021
30-second monitoring
⚡️ We are stocked to announce 30-second monitors! This simply means you will now be alerted twice faster than before, and will give you a more accurate representation of your uptime.
All new monitors will have this interval by default. You can set your current monitors in the Notifications tab of a monitor view, under the setting Ping frequency.
Fixes & improvements
upanddownwebhook events now contain amonitorUuidkey to help identify your monitor. See the Doc for more details.
November 15, 2021
Browser checks Beta
Browser checks allow you to monitor critical parts of your services, using Node.js' Puppeteer and Playwright APIs to run headless browsers for end-to-end testing. Supports environment variables.
We are looking for beta users. We would love to help you code your scenarios! Contact us at leo@hyperping.io to get access.
const { webkit } = require('playwright');  // Or 'chromium' or 'firefox'

(async () => {
  const browser = await webkit.launch()
  const context = await browser.newContext()
  const page = await context.newPage()
  await page.goto(process.env.SITE_URL)
  // Assert something
  await browser.close()
})()
Read more about it in our documentation: https://hyperping.io/docs/monitoring/browser-checks
New logo!
Finally a logo we can be proud of!
- prettier, more playful yet professional font
- more lively signal icon
- H → h (uppercase H doesn't look so good)
June 25, 2021
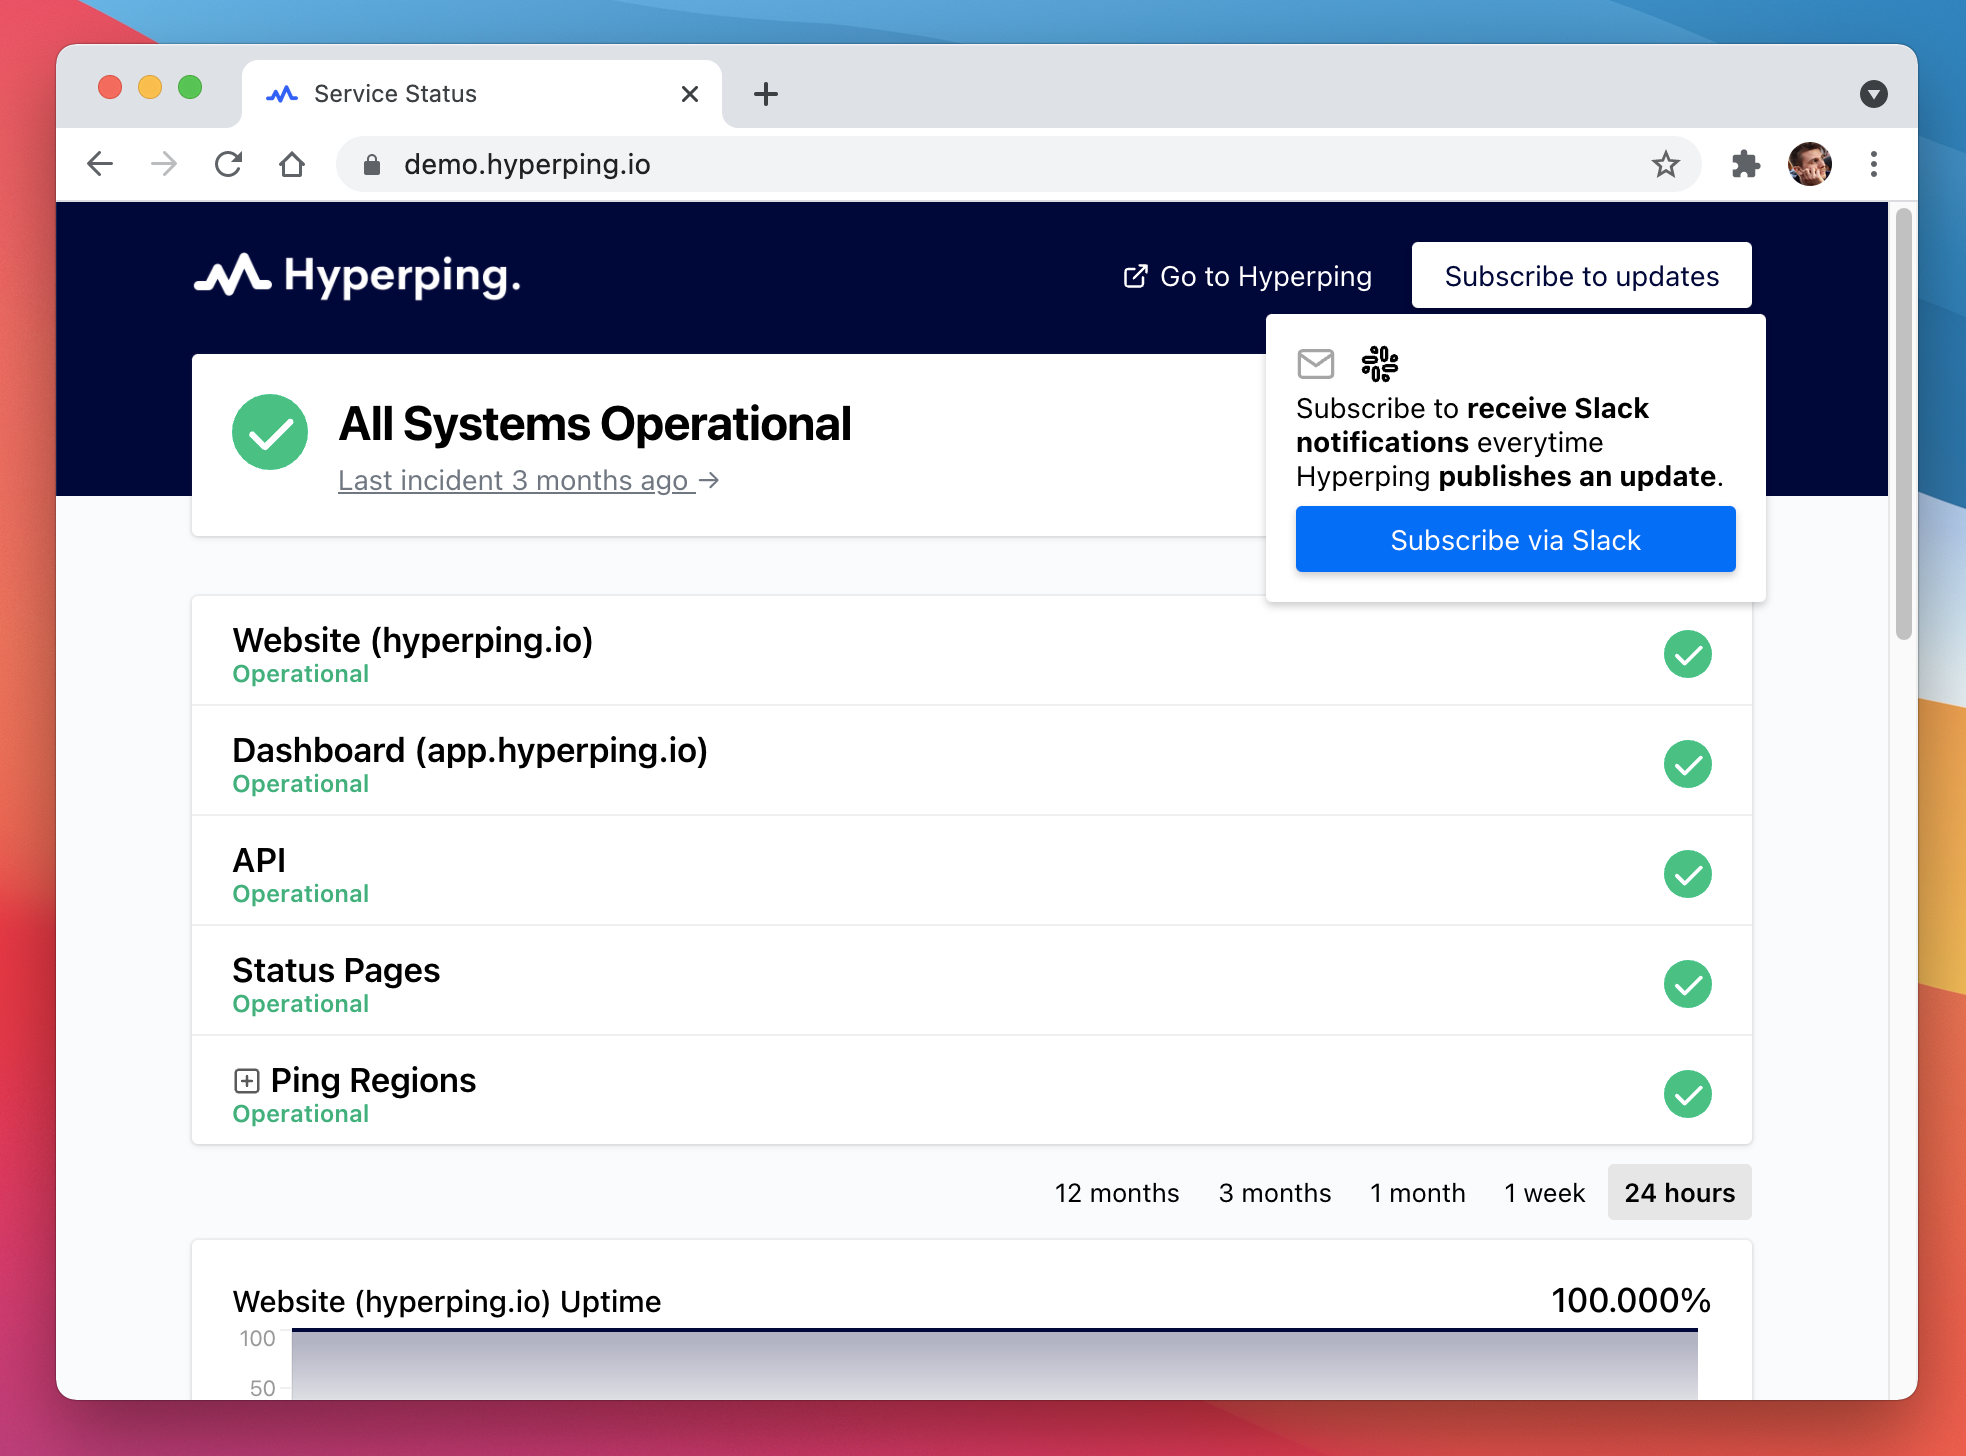
Slack subscription to status pages
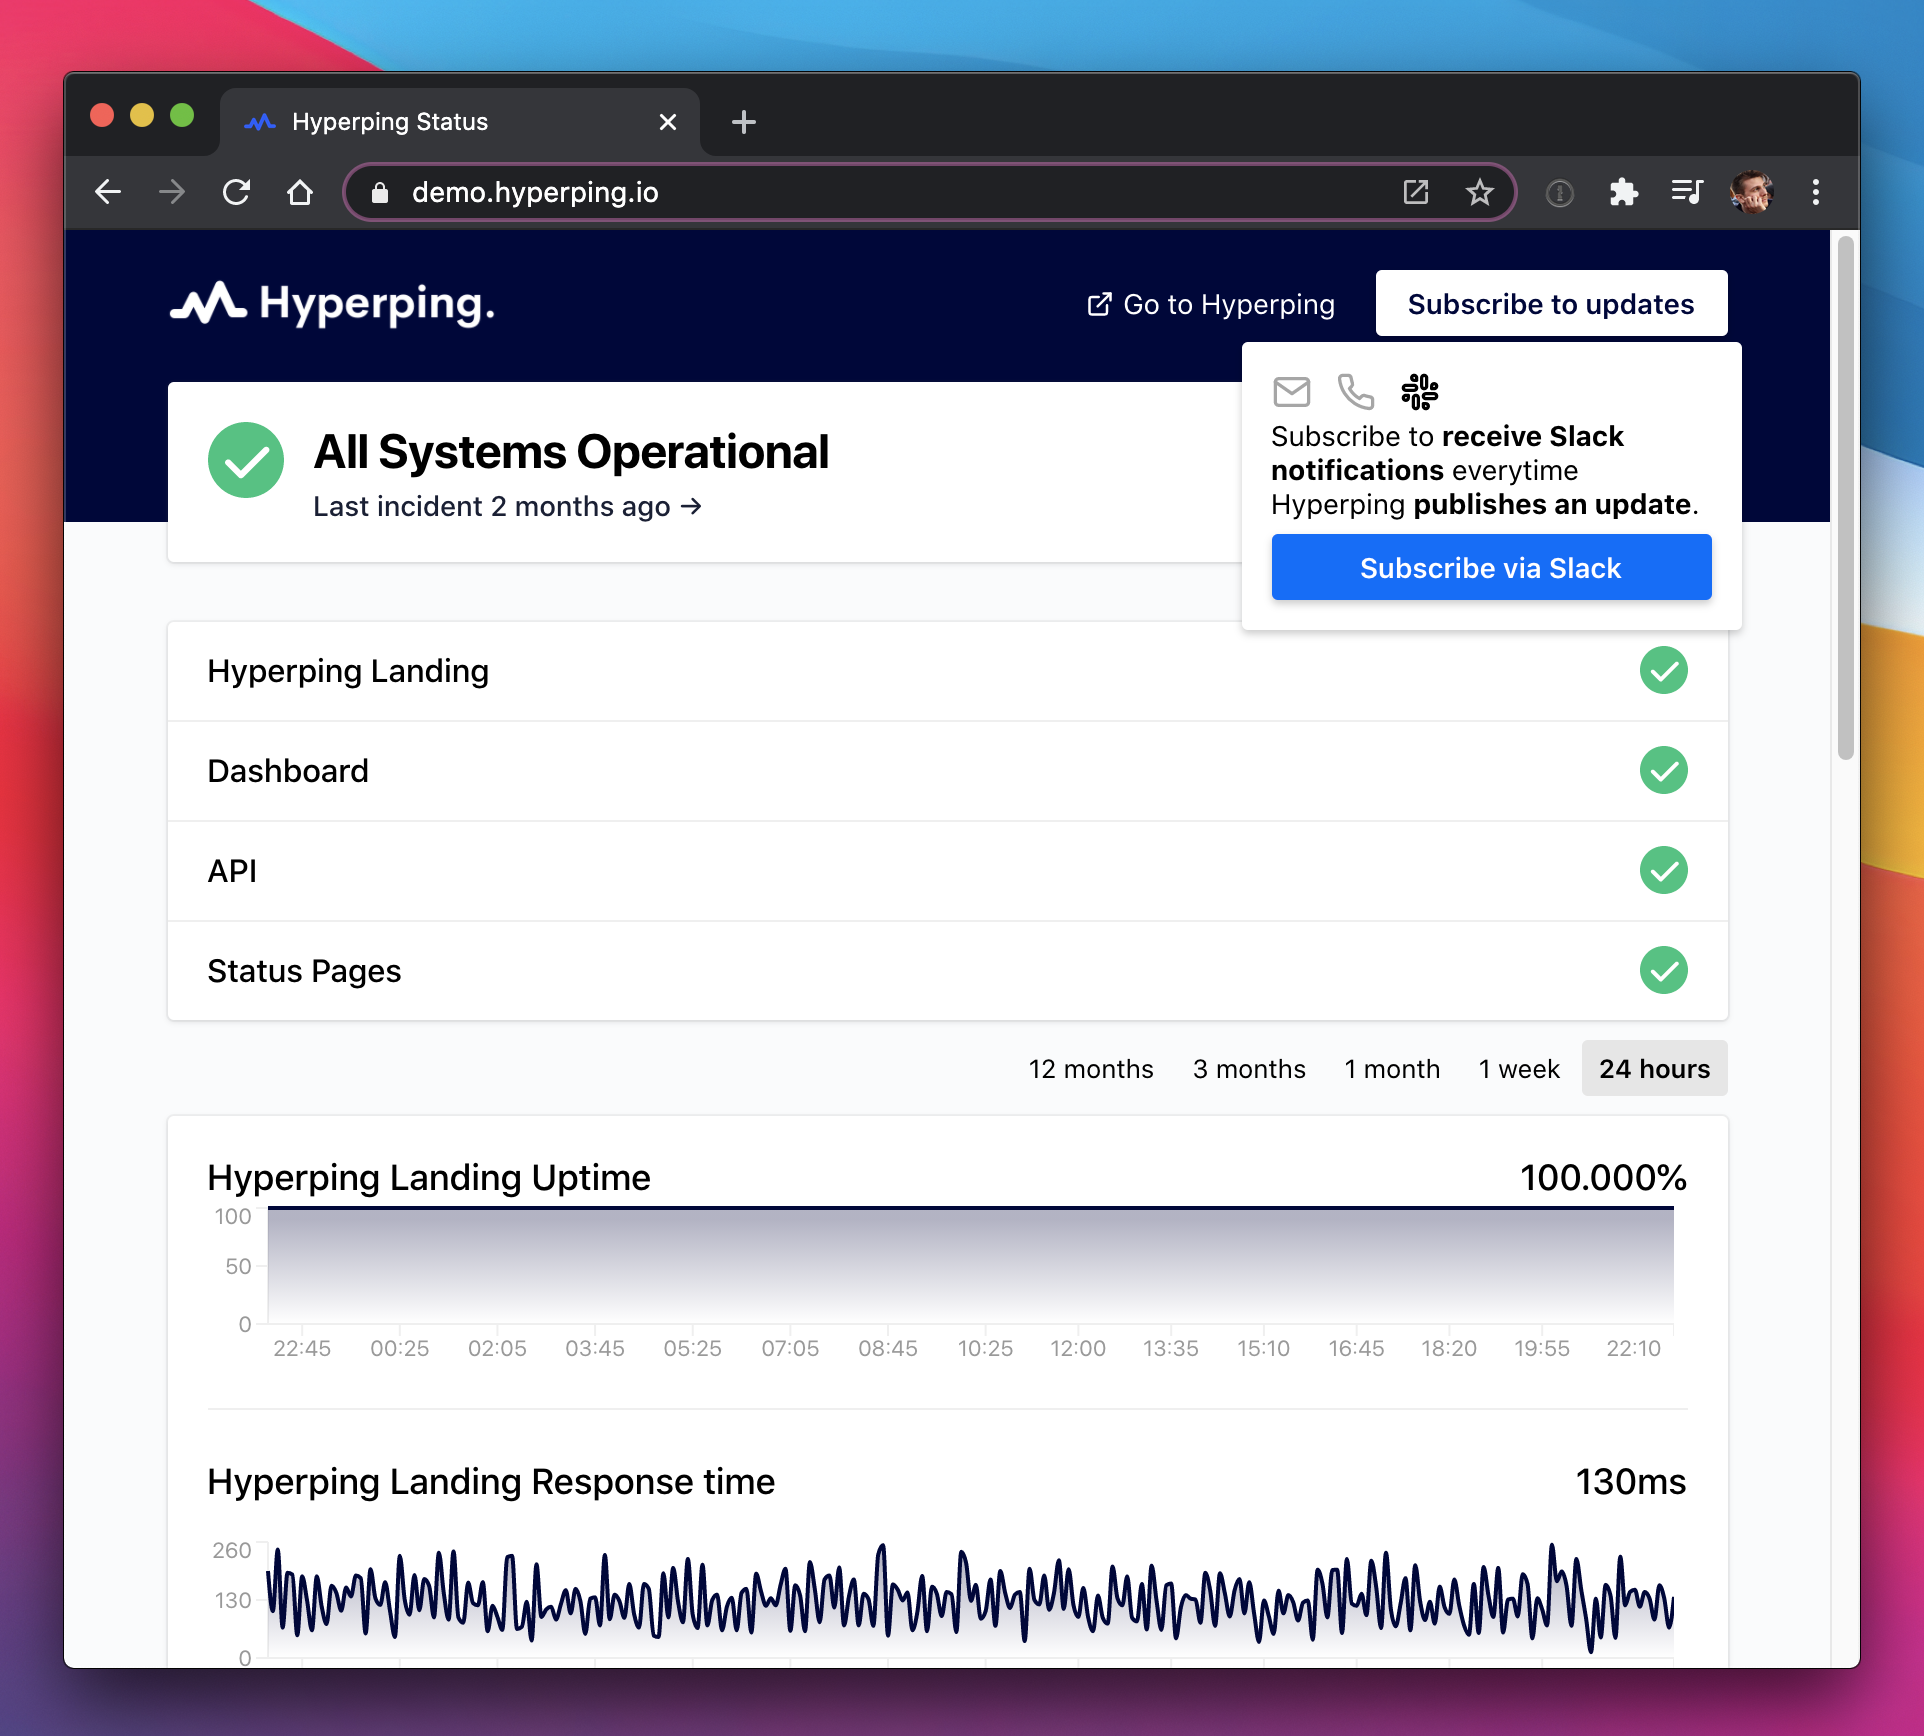
Here it is! Let anyone subscribe to your status page via Slack to receive alerts straight in their Slack channel of their choice every time you publish a new incident!
Activate it in your status page settings
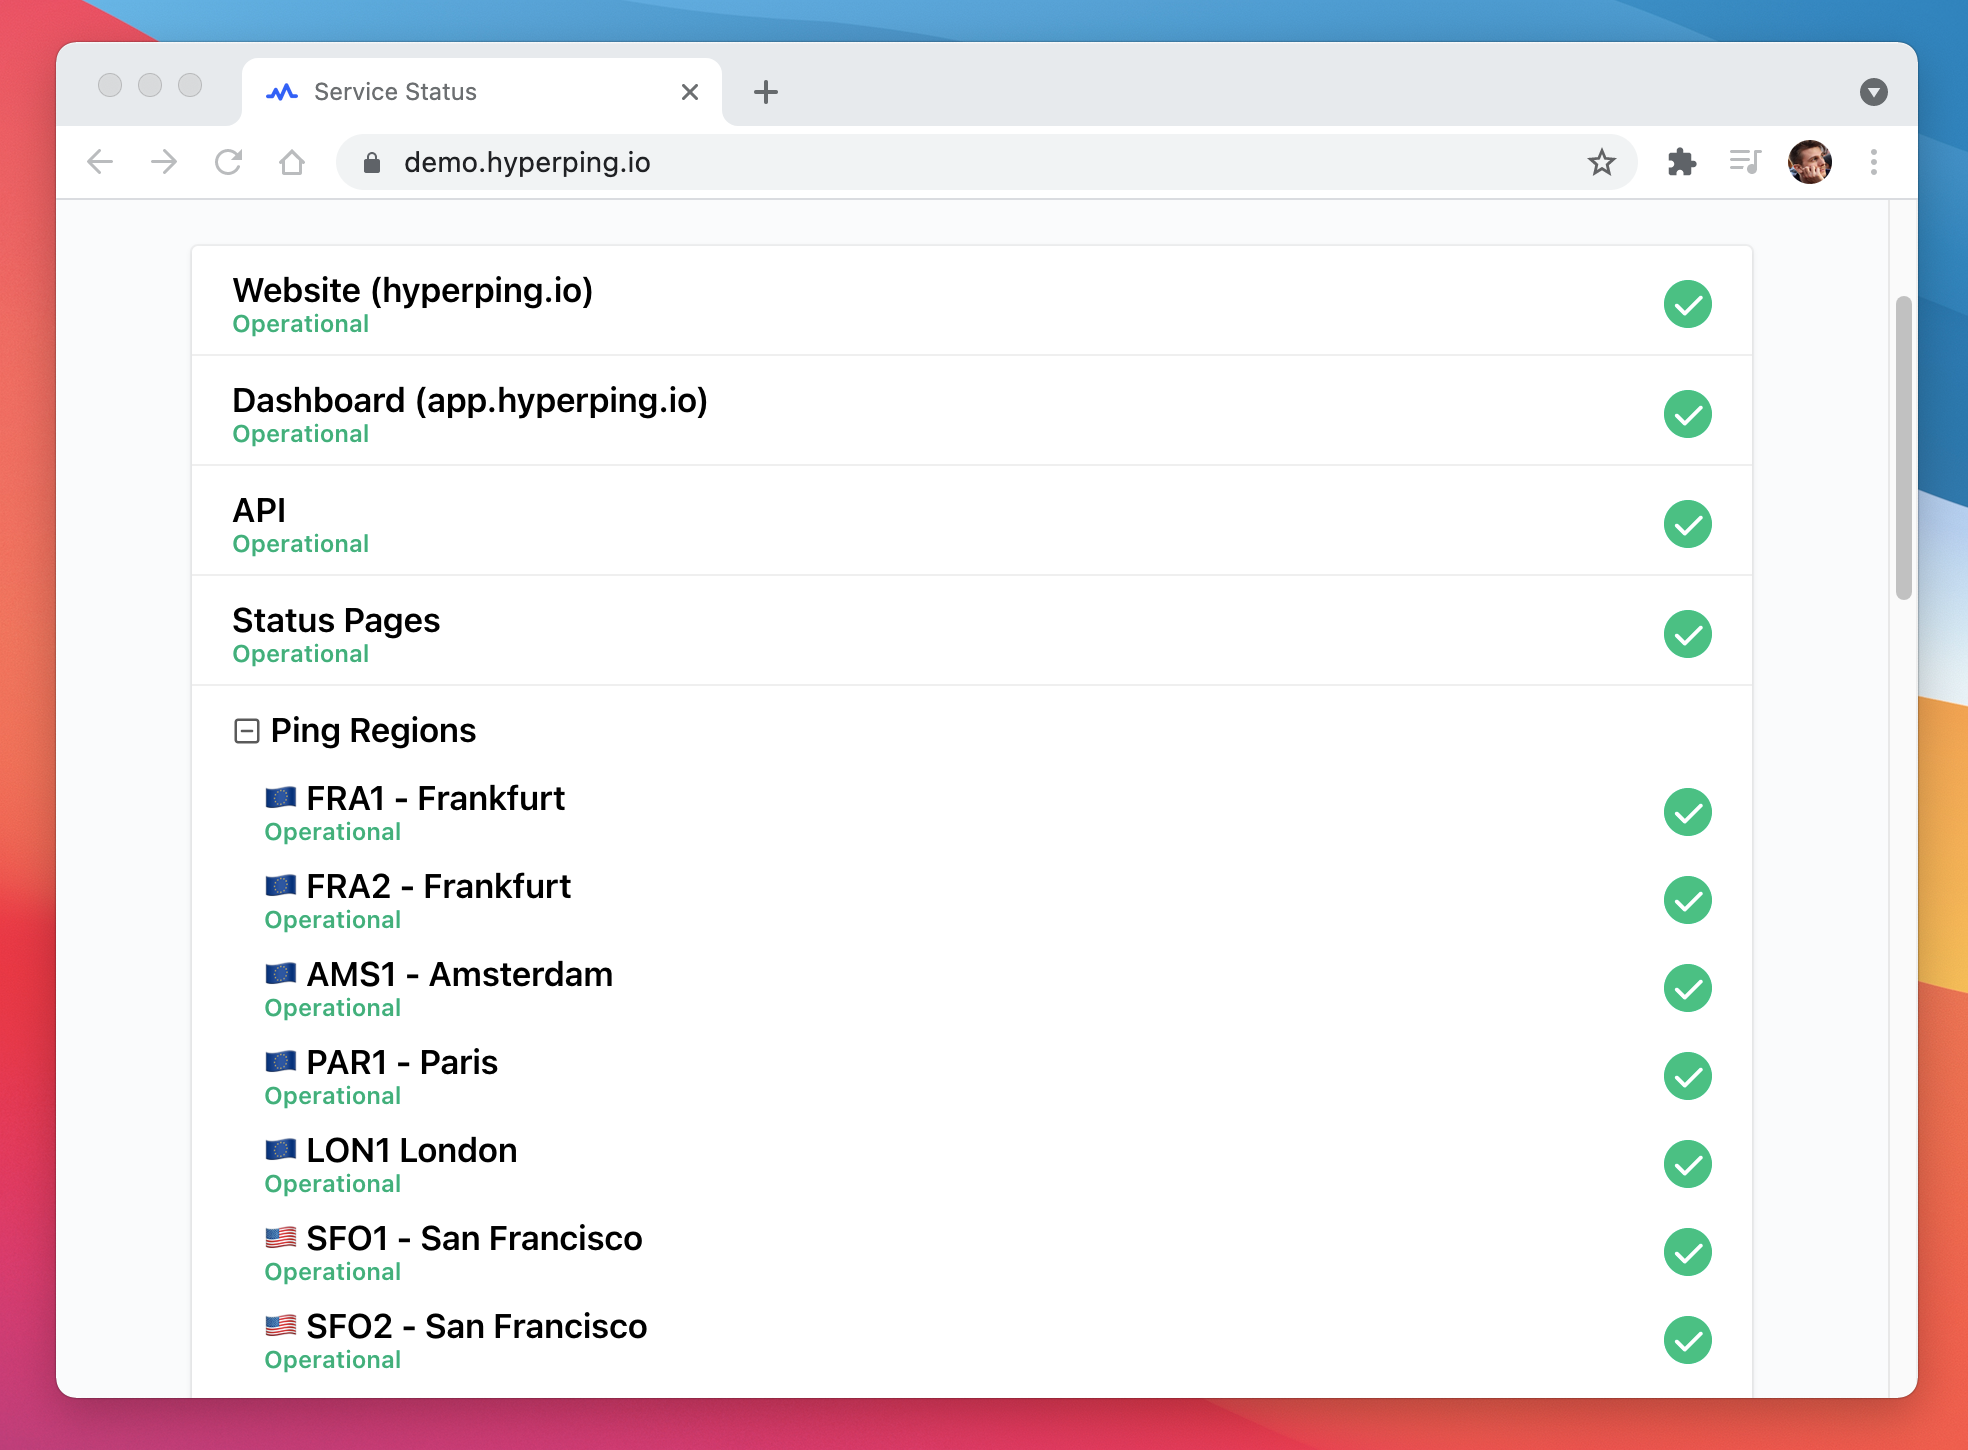
Grouped services in status pages
Group relevant services together to keep your status page clean!
Manual components
Create components that aren't monitors to be added to your status page.
During an incident creation, you can manually set your components to 3 different statuses:
- ✅ Available
- ⚠️ Degraded performance
- ❌ Outage
- Paste on another page, and select Paste & sync in the dropdown that appears
- Your content is synced! Any changes you make will update every Synced Block.
February 22, 2021
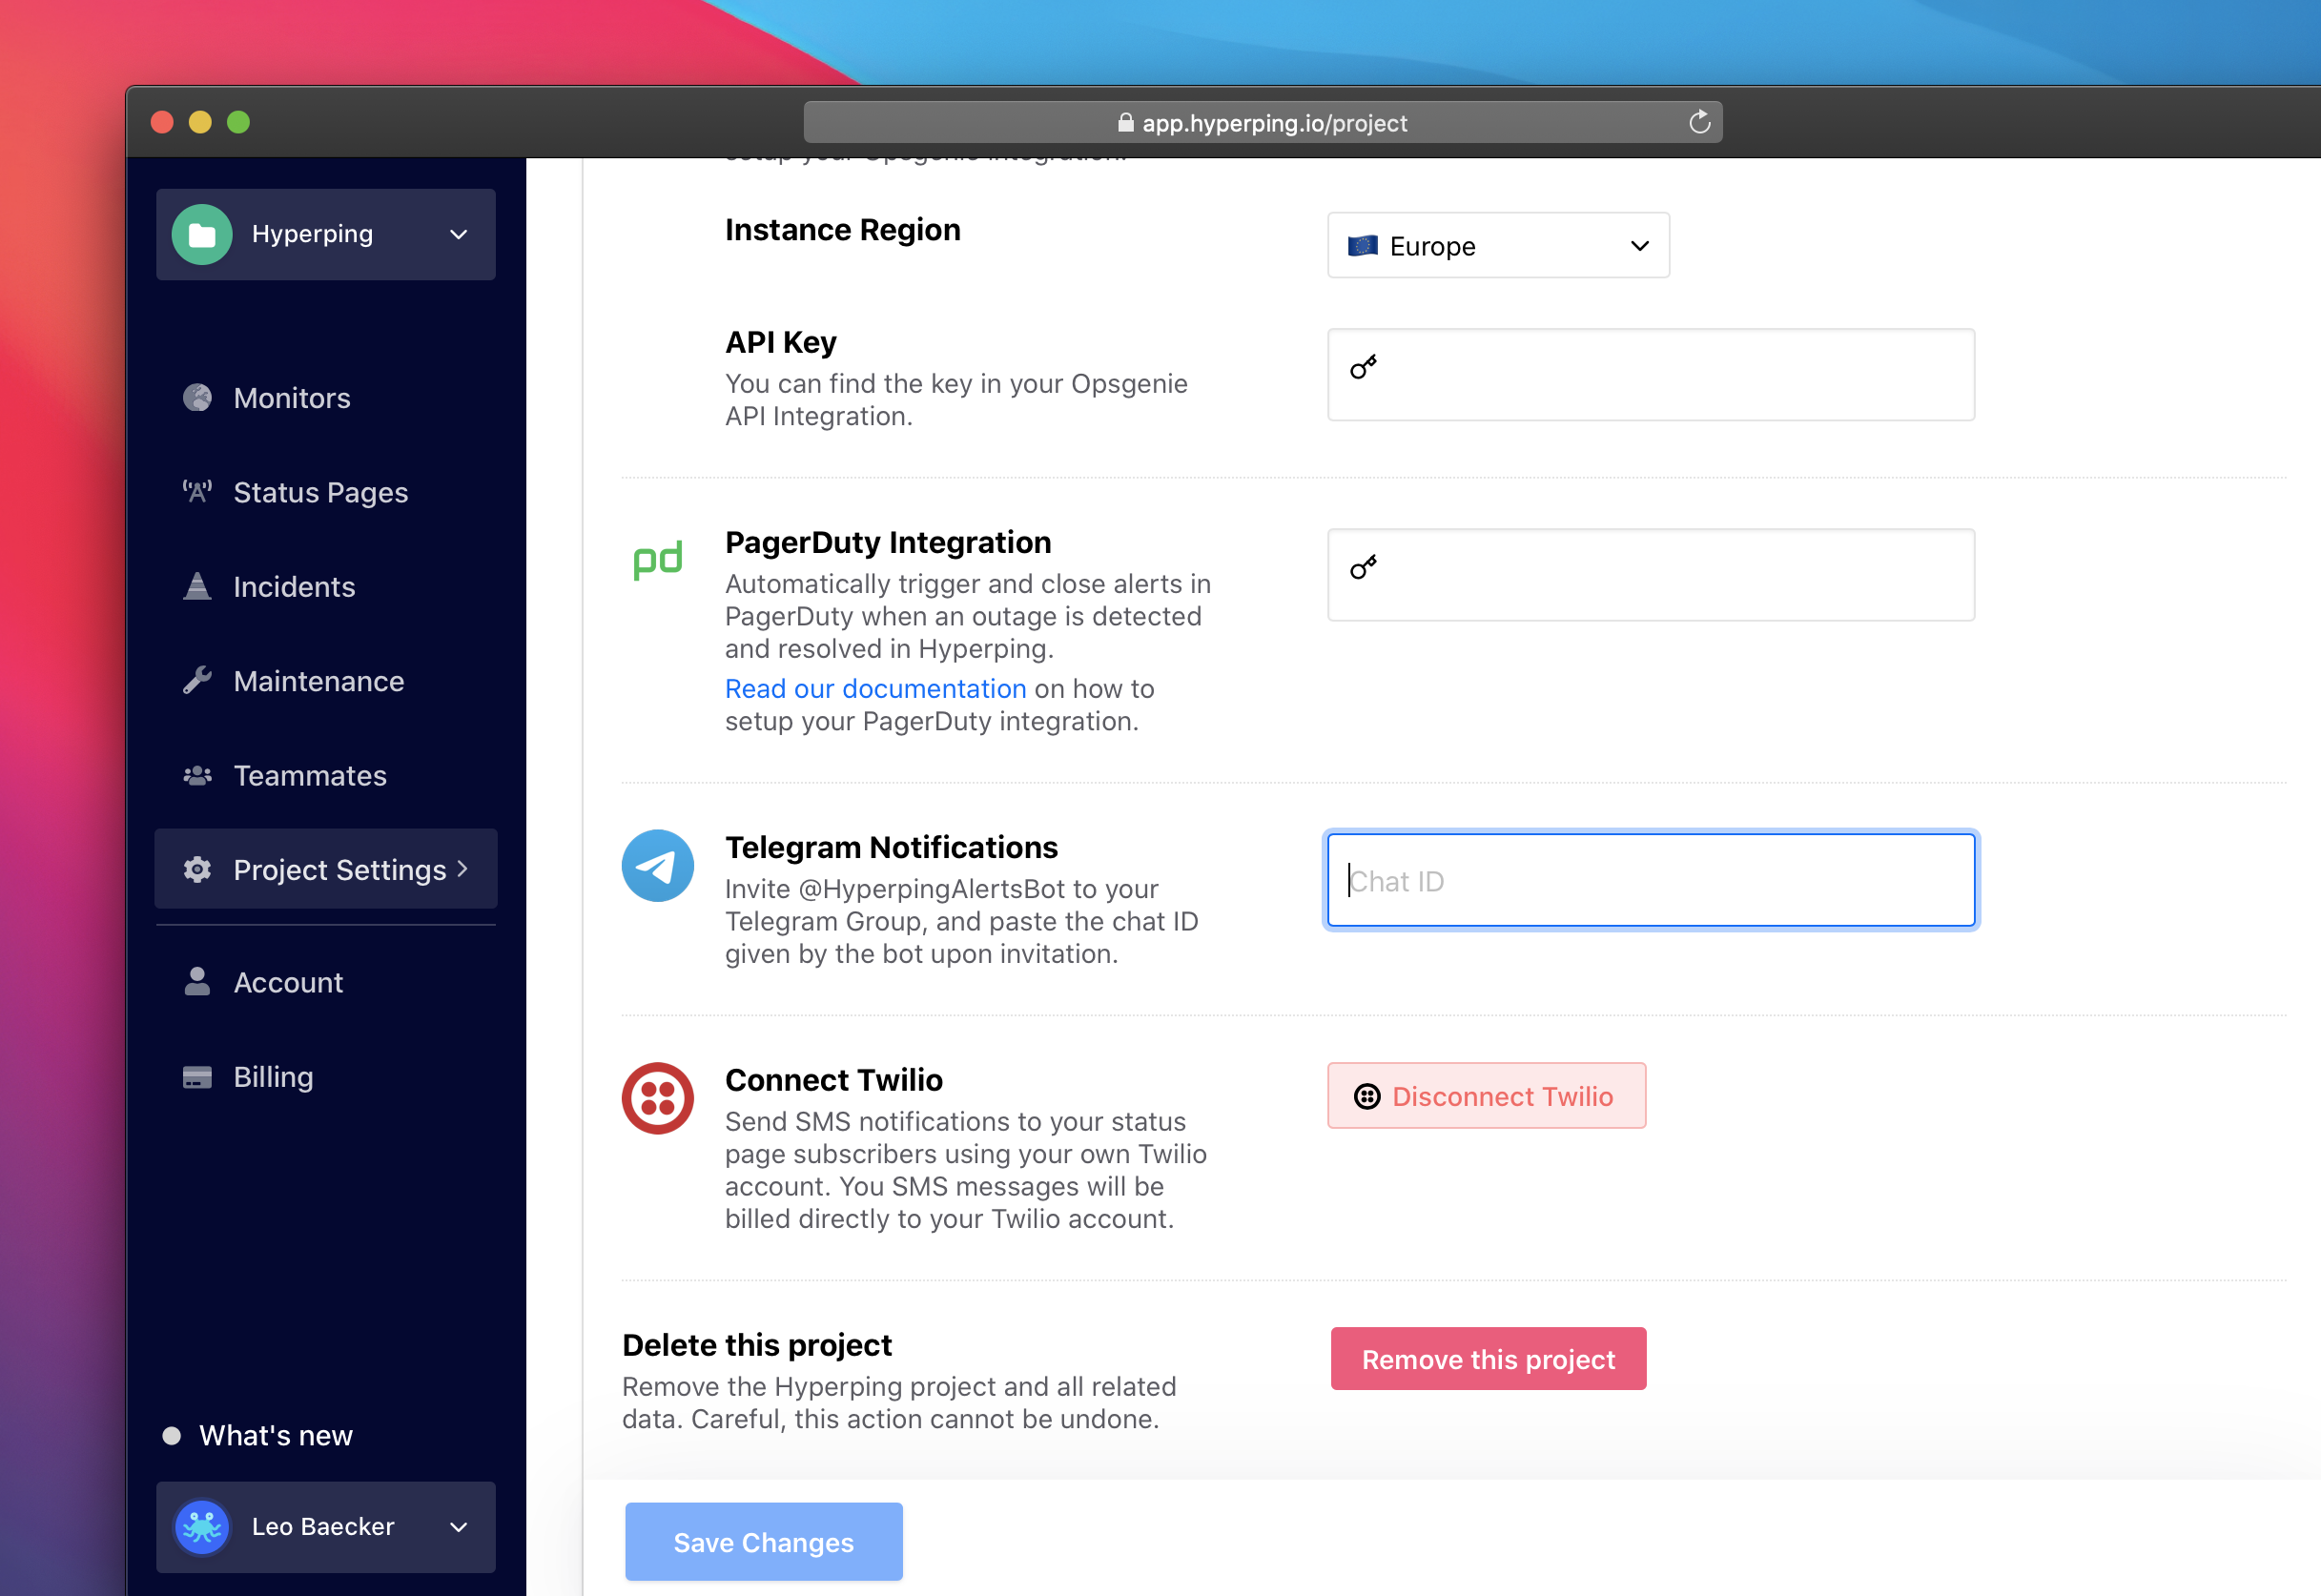
Telegram Alert Notifications
Receive DOWN & UP alerts to the Telegram Group or Channel of your choice at a project level!
February 1, 2021
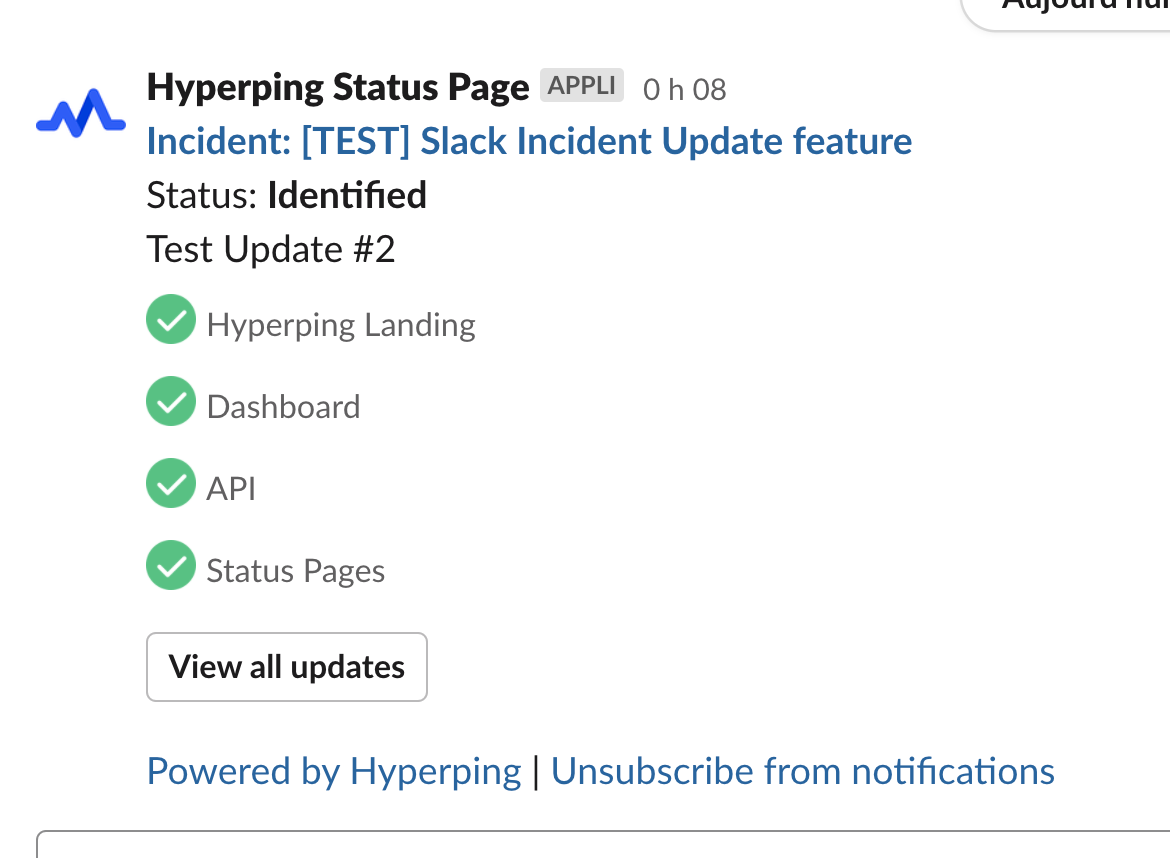
Slack Notifications for Status Page Incident Updates & Maintenance Status Messages
Let any status page visitor to subscribe to incident updates and maintenance status messages in Slack!
Bangalore ping region 🇮🇳
We're stoked to announce the arrival of the Bangalore, India ping region, that comes to back up the Mumbai pinger
Fixes & improvements
- SSL expiration alerts are now sent 30 days before! (Additionally to 3 days & 10 days before)
- Fixed a bug where some long requests (10+ seconds) were sending 500 status codes instead of 408
Stripe 3D Secure Payments
We now comply new EU regulations that require support of the 3D Secure Payment. We use stripe to operate 100% of your payments
December 4, 2020
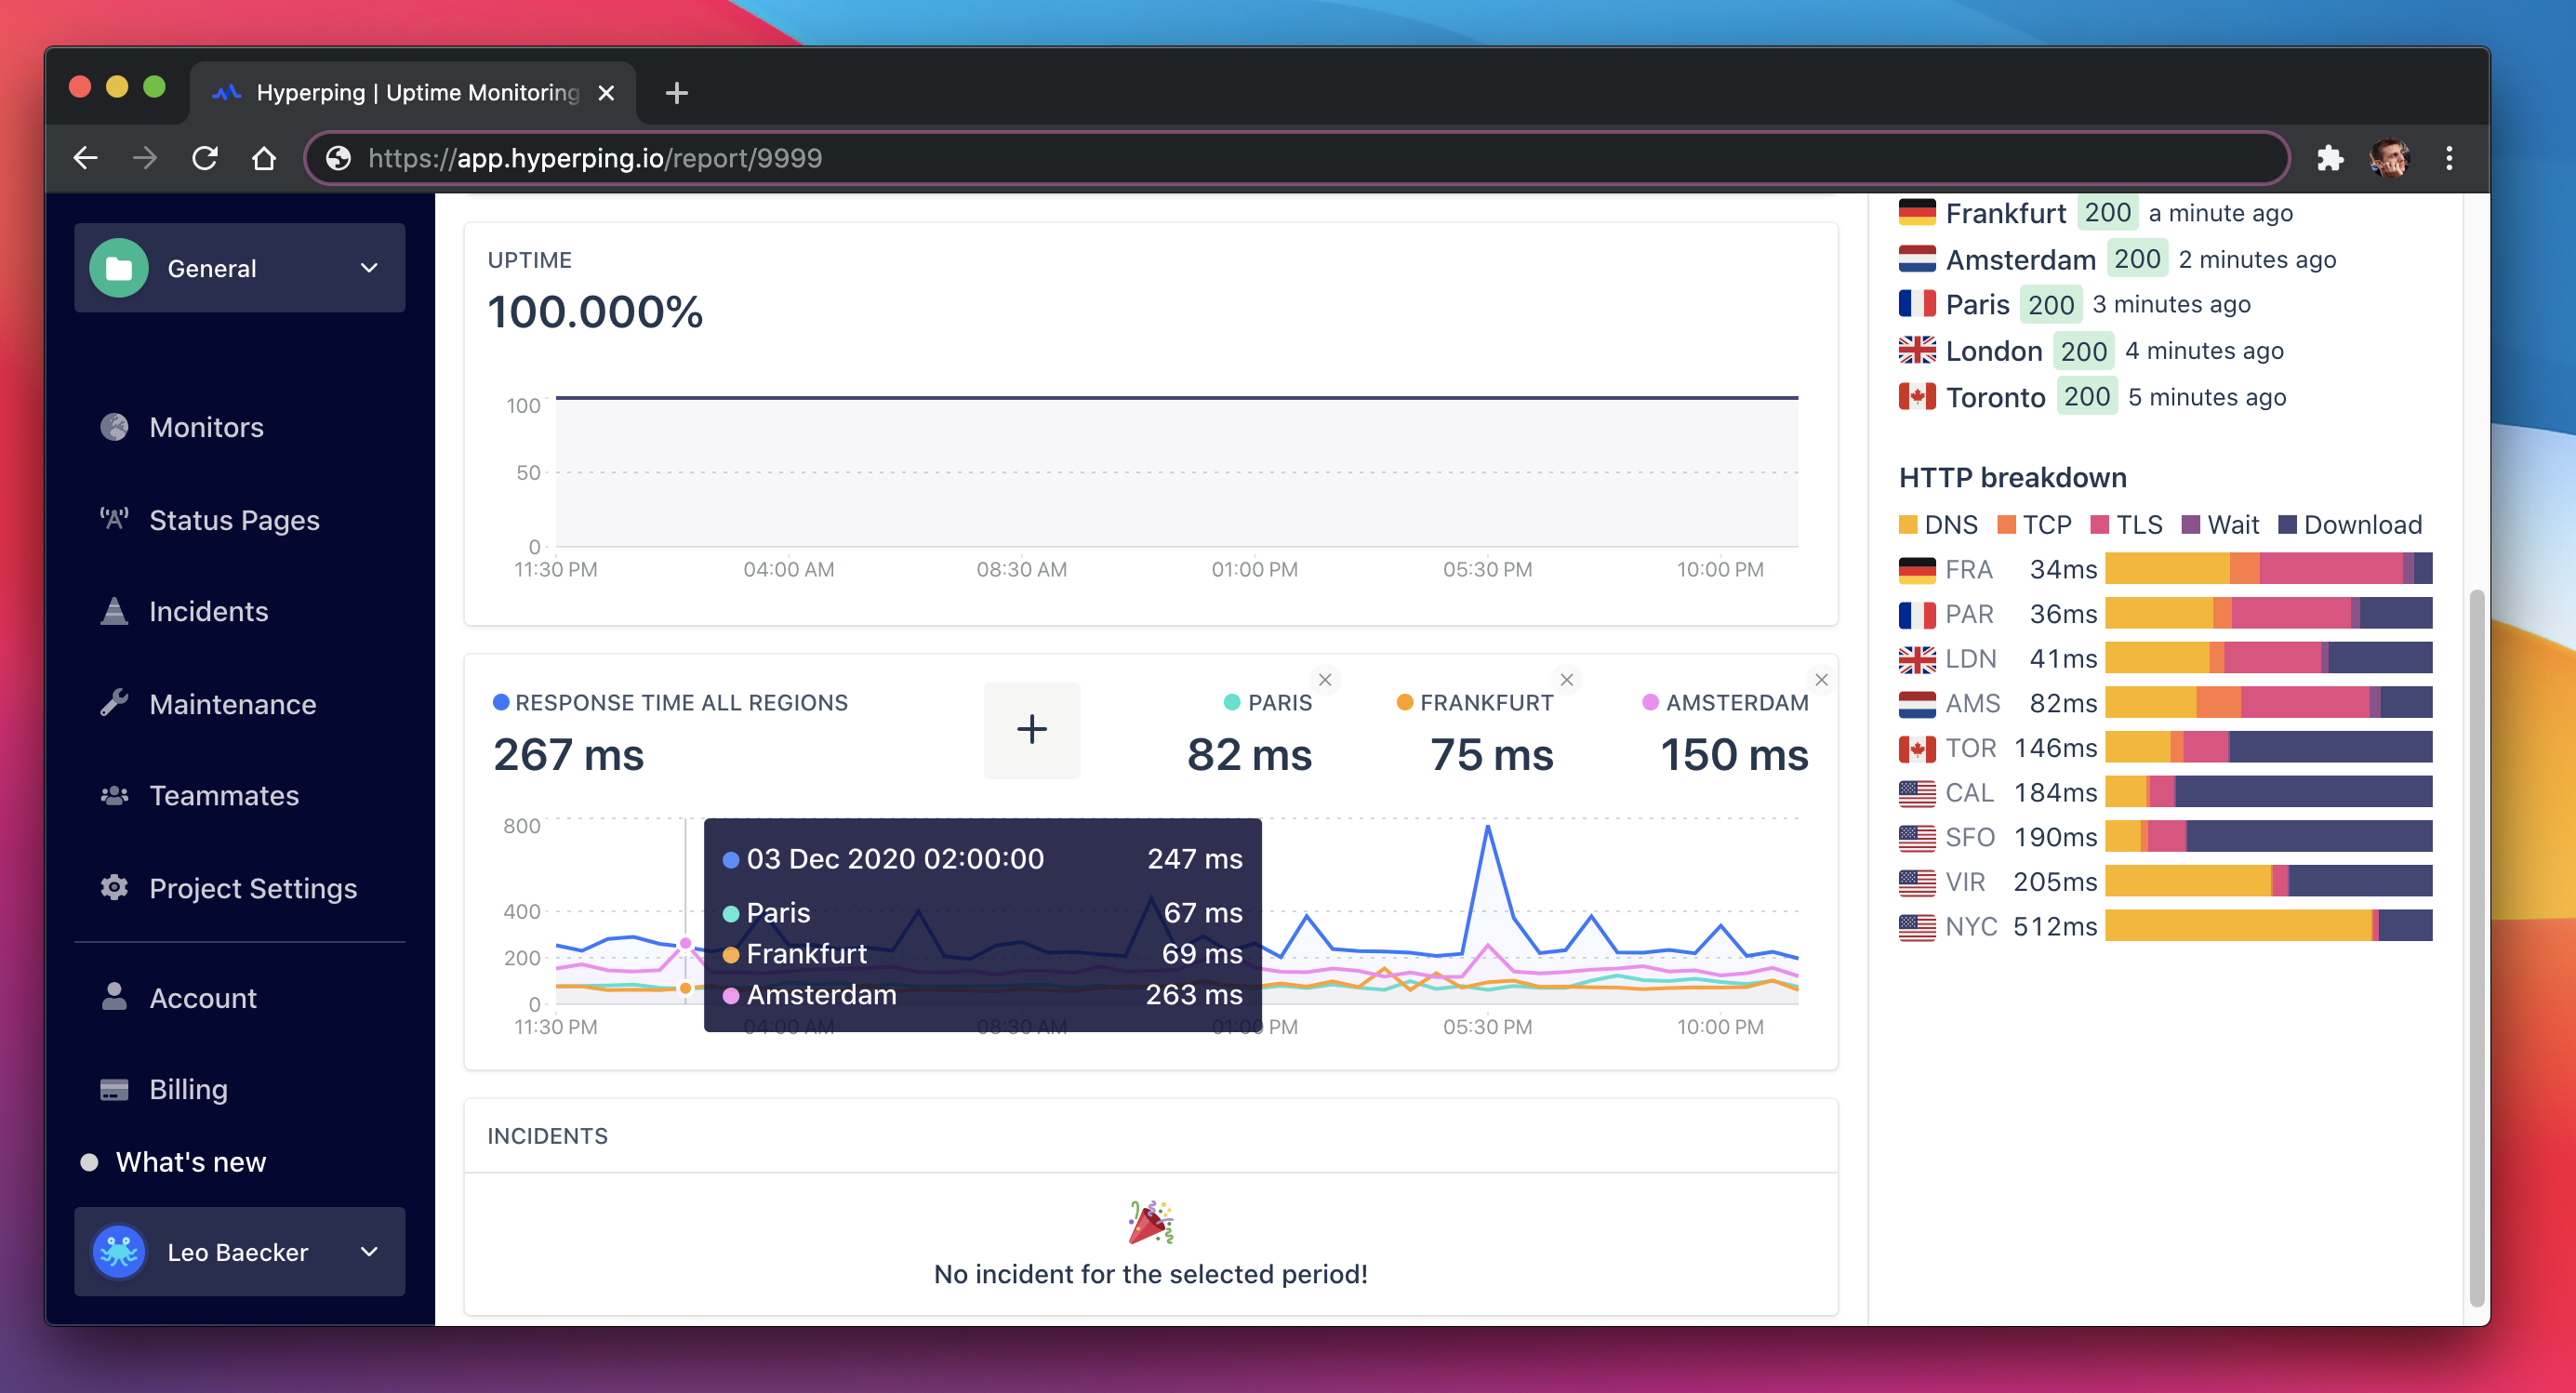
New monitor report view 🎛
For the past week you've been able to enjoy the new monitor report view!
We've rebuilt this whole route, moving from angularjs to React, which makes it much snappier, with a new, fresh interface!
HTTP Breakdown
To the right panel, this new block breakdowns the timing of your HTTP requests over the past 24 hours
SSL information
To the right panel, if your monitor is using HTTPS and has an SSL certificate, its expiration date will appear to the right. Hyperping keeps sending emails days before and during expiry
Response time per region
You can filter up to 4 different regions to compare response time between regions
Port & ICMP ping protocols
ICMP and Port protocols are finally here! Monitor your SMTP servers, IP addresses databases, load balancers, VPS, anything!
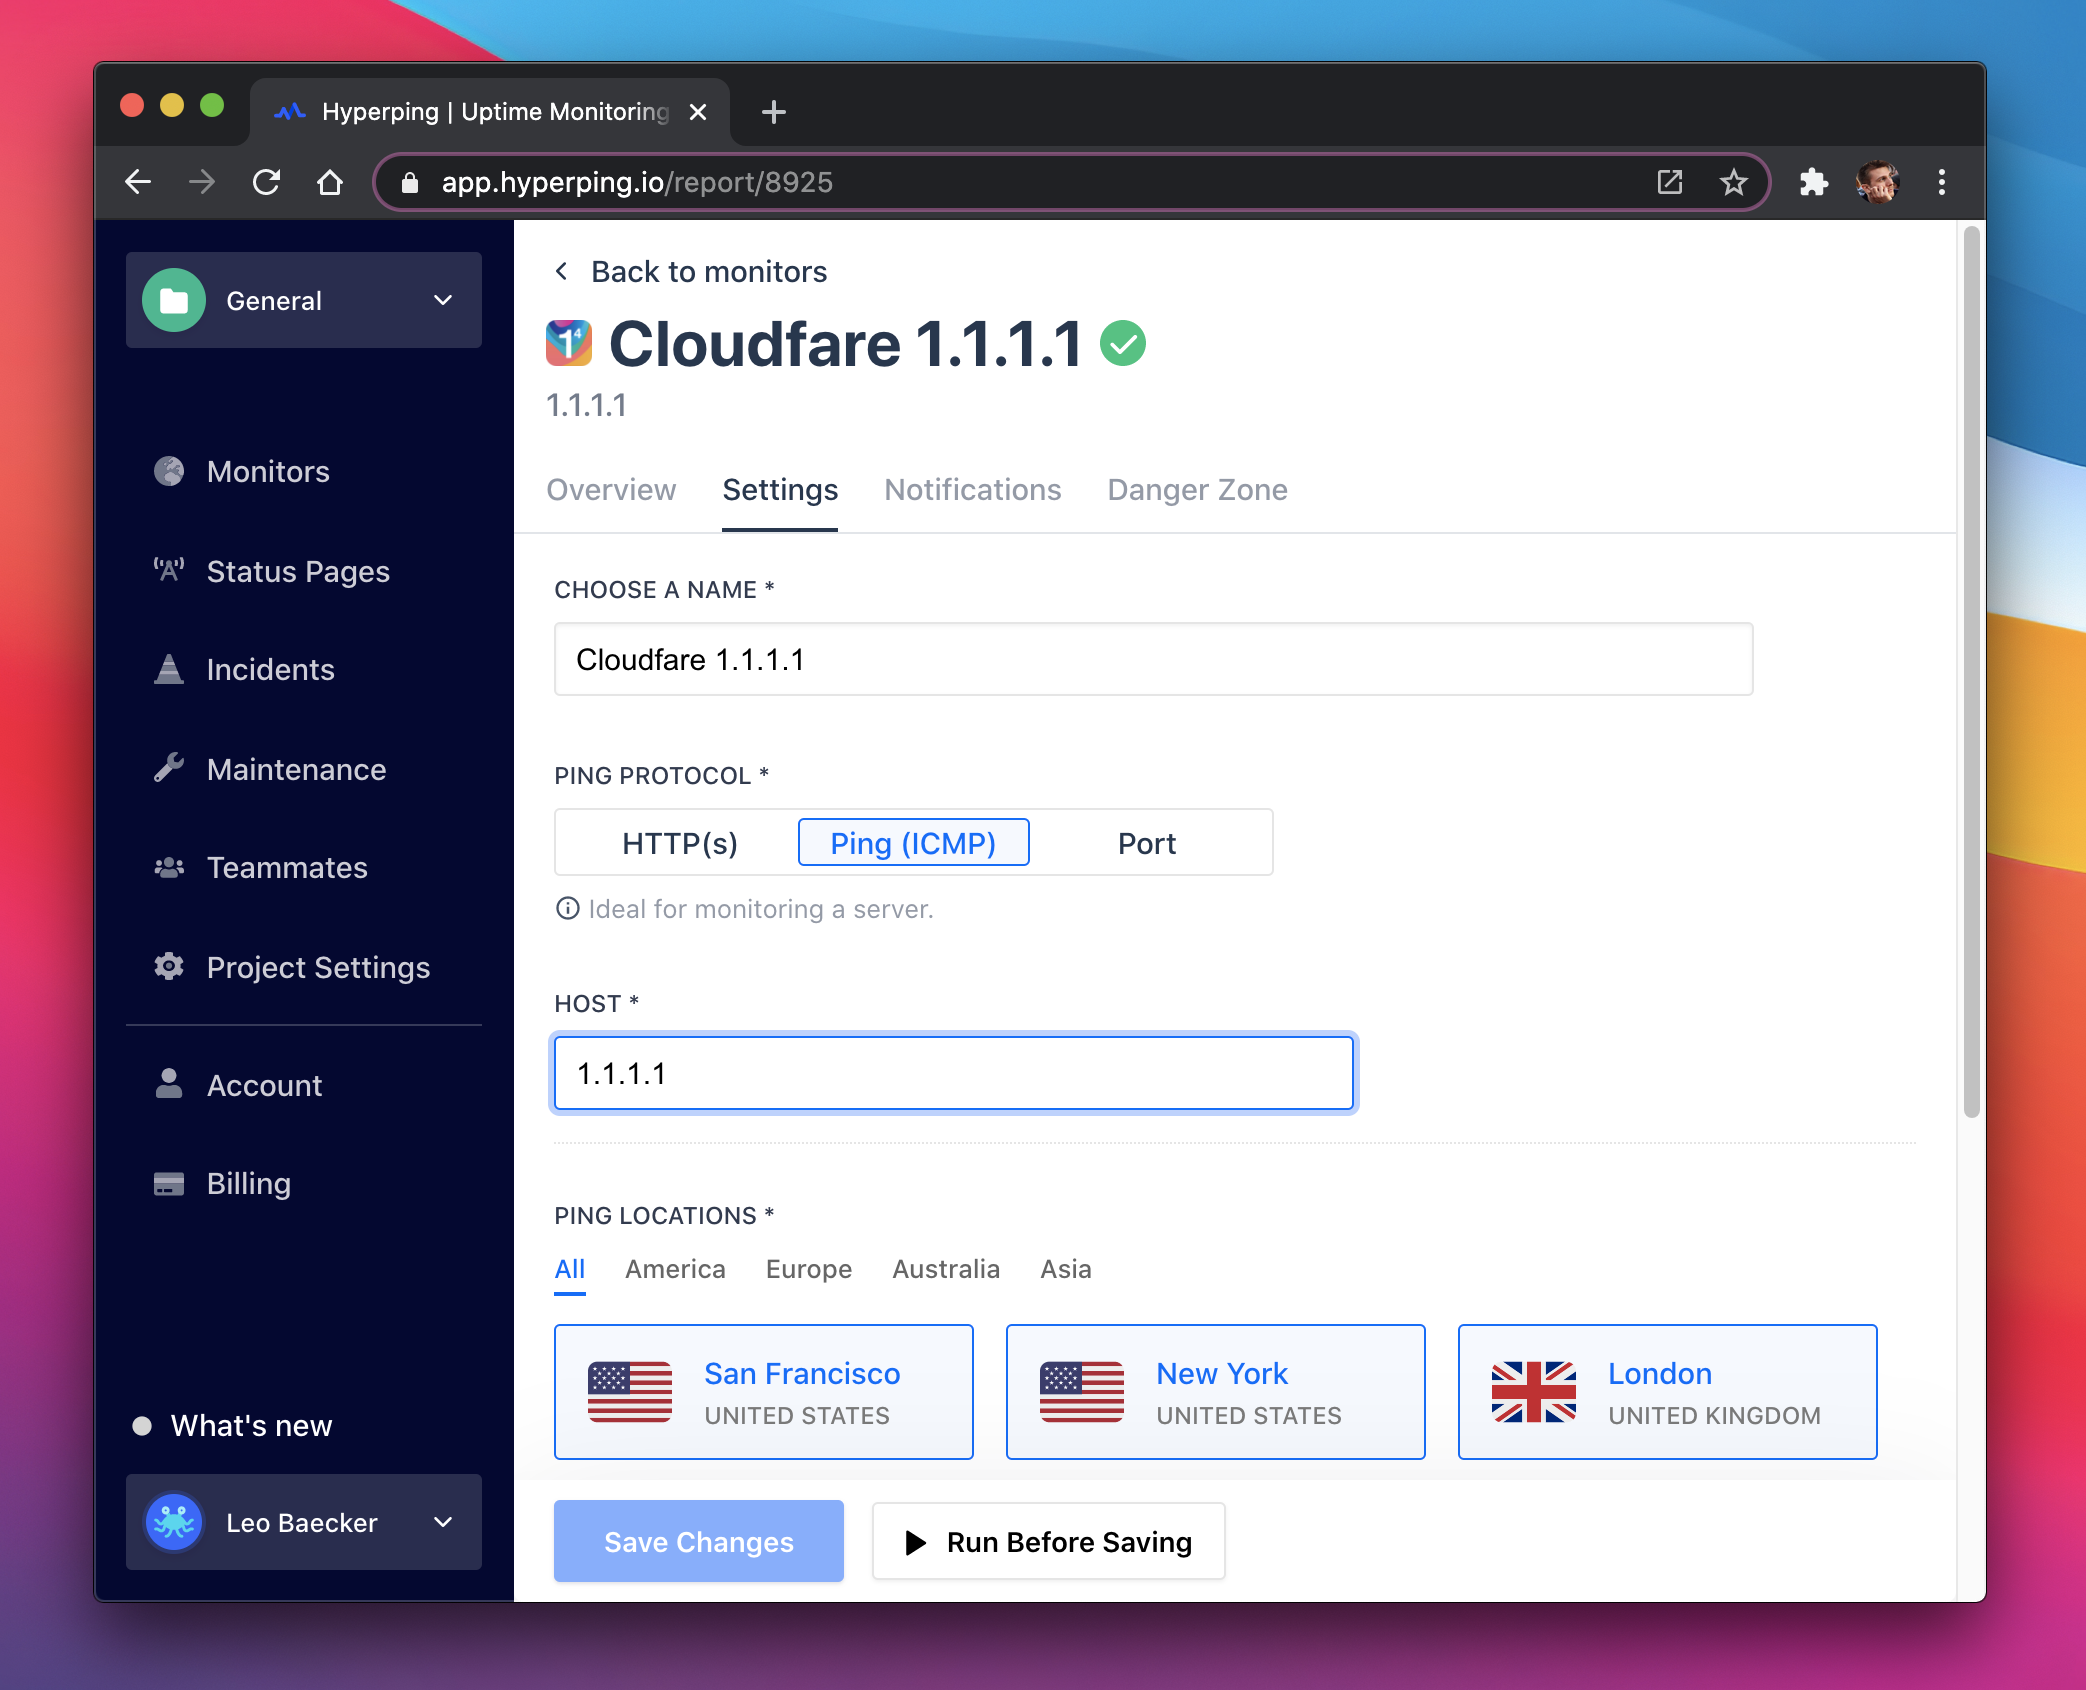
We hope you'll like all these new features, please let us know in the chat or by email at hello@hyperping.io !
Fixes & improvements
- Improved favicon fetcher
- New ping region: 🇸🇬 Singapore
- UP/DOWN notifications:
- Most alerts now show the Alias/Name of the monitor, instead of its URL/hostname
- UP Alerts now include a more precise duration: "Outage duration: 1 minutes, 42 seconds"
- The size of monitor cards, at the main view of your dashboard, have been shrank to show more monitors at once
- Drastically reduced the bundle size. Our
app.min.jsfile went from over 2Mb to 400kB (uncompressed), 73kB compressed - Replaced ping instances that were causing too many spikes (notably for Amsterdam & New York regions)