If you're comparing Better Stack vs Datadog vs Hyperping, consider Datadog if you need full-stack observability across complex, distributed infrastructure. Better Stack for unified uptime monitoring with integrated logging and incident management. Hyperping for straightforward monitoring with polished status pages and predictable pricing.
In this guide, you'll learn:
- Core features, pricing, and hidden costs to watch for
- Which tool fits your team size and infrastructure complexity
- Real user experiences from hands-on testing and hundreds of analyzed reviews
- Common pain points: pricing unpredictability, feature overload, and missing capabilities
- How each platform handles these challenges differently
If you want monitoring that catches issues in 30 seconds, status pages that strengthen customer trust, and pricing you can actually predict, Hyperping delivers exactly that. Get in touch with us to schedule a demo of Hyperping.
Why you should trust this guide
I'm Léo, founder of Hyperping. Yes, that means I have a stake in one of these tools. But I've seen teams choose competitors when they were genuinely the better fit. My goal isn't to convince you Hyperping is always the answer. It's to help you understand which tool actually solves your problem.
I've analyzed hundreds of G2 reviews, tested all three platforms myself, and talked to DevOps and SRE teams about their experiences. Where I couldn't test something directly, I relied on verified user feedback and documented sources.
This guide breaks down exactly what each platform does well, where it falls short, and which use cases it's built for. By the end, you'll know whether you need Datadog's comprehensive observability suite, Better Stack's unified monitoring approach, or Hyperping's focused simplicity.
Better Stack vs Datadog vs Hyperping: Summary table
| Feature | Datadog | Better Stack | Hyperping |
|---|---|---|---|
| Best for | Large-scale distributed systems needing full observability | Teams wanting uptime + logs + incidents in one platform | EU-based teams seeking straightforward but capable monitoring and status pages |
| Free version? | Yes (limited) | Yes | Yes |
| Starting price | $15/mo per host + usage fees | $29/mo per user, lots of paid addons | $24/month (2 users) for 50 monitors |
| Check frequency | Varies by check type | 30 seconds | 30 seconds |
| Key strength | Full-stack APM, logs, traces, security in unified platform | Integrated monitoring + logging + incident management | Simple setup with excellent value and status pages |
| Pricing model | Usage-based (hosts, logs, spans, metrics) | Usage-based (users, logs, calls, etc) | Tiered by monitors, status pages, and users |
| Status pages | Yes, but not a core feature | Included but lots of paid addons | Multiple full-featured status pages on Pro and Business plans |
| Ideal team size | 50-5000+ (enterprise focus) | 5-100+ (scales well) | 1-50 (SMB sweet spot) |
| Learning curve | Steep (very feature-rich) | Moderate (powerful but needs setup) | Low (quick onboarding) |
Which to choose? Quick verdict
Choose Datadog if: You're running complex distributed systems across multiple cloud providers and need comprehensive APM, log management, distributed tracing, and security monitoring in one platform. Your team has the expertise to configure and optimize it, and your budget can handle usage-based pricing that scales with data volume.
Choose Better Stack if: You want uptime monitoring as part of a broader observability strategy with integrated logging and incident management. The tight integration between monitoring, logs, and incidents makes troubleshooting faster when things break.
Choose Hyperping if: You want simple, reliable monitoring that "just works" with polished status pages, on-call scheduling, and smart escalation policies. No usage-based surprises, predictable flat-rate pricing, and EU hosting for GDPR compliance.
How much does each tool cost?
It is pretty hard to give the full perspective on that point since Datadog pricing is very complex. If we focus on simple uptime monitoring (which would be syntehtic monitoring in Datadog), here are the numbers:
| Needs | Datadog | Better Stack | Hyperping |
|---|---|---|---|
| Small team (50 monitors) | ~$2500/mo | $50/mo (1 responder + $21 addons) | $24/mo |
| Growing business (100 monitors) | ~$5000/mo | $71/mo (1 responder + $42 addons) | $74/mo |
| At scale (1000 monitors) | ~$50,000/mo | $391/mo (1 responder + addons) | $249/mo |
Note: Datadog synthetic monitoring is billed per test execution: $5 for 10,000 tests. A single monitor with 30-second checks would amount to almost 100,000 tests per month. Better Stack pricing includes 1 responder at $29/mo with additional monitors at $21/50 monitors.
Choosing the right tool for your needs between Better Stack vs Datadog vs Hyperping
| What matters most to you | Winner | Why it wins |
|---|---|---|
| Full-stack APM and tracing | Datadog | Industry-leading distributed tracing and code-level visibility |
| Unified monitoring + logging | Better Stack | Only tool combining uptime monitoring + logging + incident management |
| Predictable pricing | Hyperping | Flat-rate plans vs usage-based billing that can spike unpredictably |
| Fastest uptime check frequency | Hyperping | 30-second checks standard, 10-second on Business plan |
| Infrastructure as code | Datadog | Most mature Terraform provider and API ecosystem |
| Security monitoring (SIEM) | Datadog | 900+ detection rules, AI-powered threat detection |
| Status page value | Hyperping | 3 full-featured status pages on Pro ($74/mo) vs not a focus elsewhere |
| Multi-cloud visibility | Datadog | 650+ integrations across AWS, Azure, GCP, and more |
| Quick setup for small teams | Hyperping | Minutes to working monitors, minimal configuration |
| EU data compliance | Hyperping | EU company & hosted in Europe |
| Incident response integration | Better Stack | Built-in on-call scheduling with logs/metrics in unified timeline |
| Real User Monitoring (RUM) | Datadog | Comprehensive frontend performance tracking and session replay |
| Best value under 100 monitors | Hyperping | $74/mo for 100 monitors + 3 status pages |
| Enterprise-scale deployments | Datadog | Built for organizations with thousands of services and complex needs |
| Learning curve | Hyperping | Lowest friction, focused feature set vs comprehensive but complex tools |
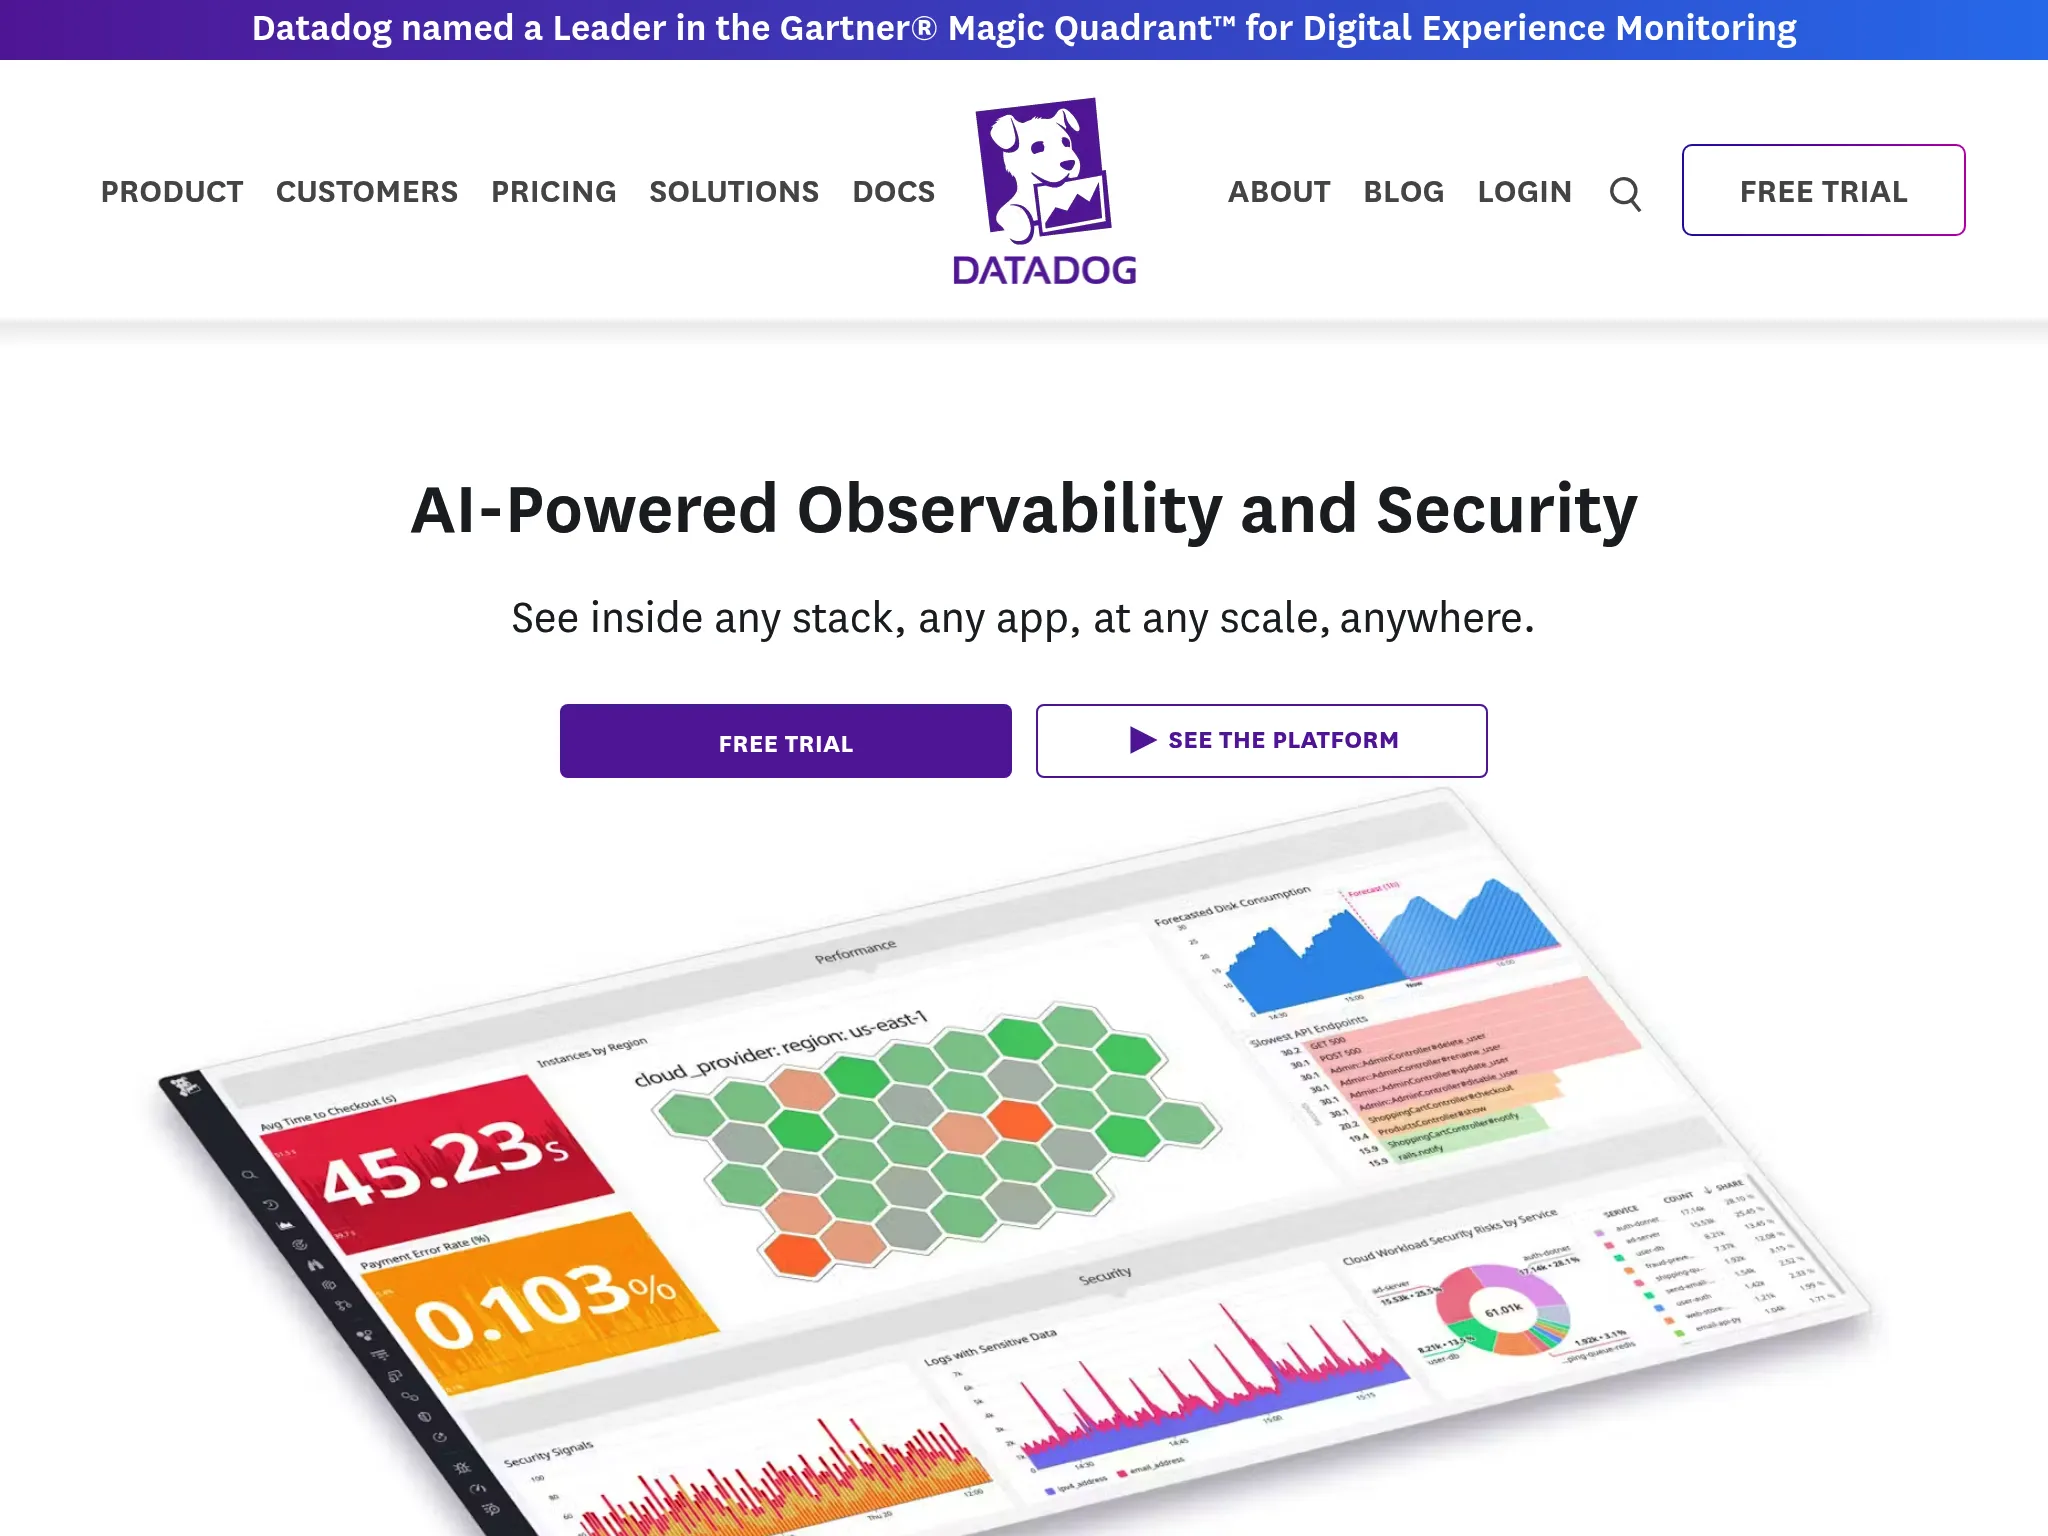
Datadog: Best for comprehensive full-stack observability
Perfect for
Organizations running complex, distributed systems across multiple cloud providers who need unified visibility into infrastructure, applications, logs, traces, and security. Datadog is built for teams managing microservices architectures, Kubernetes clusters, and multi-cloud deployments where understanding dependencies across hundreds of services is critical.
From what I gathered in G2 reviews, Datadog's strength is bringing everything together in one place. Users consistently mention how correlating metrics, logs, and traces speeds up troubleshooting compared to jumping between multiple tools.
What Datadog actually does: Key features
- Application Performance Monitoring (APM): End-to-end distributed tracing with code-level visibility. You can follow a single request through dozens of microservices and identify exactly where latency or errors occur.
- Infrastructure monitoring: Real-time visibility into servers, containers, databases, and cloud services with auto-discovery that keeps up with dynamic environments.
- Log management: Centralized logging with pattern detection, real-time search, and direct correlation with metrics and traces for unified troubleshooting.
- 650+ integrations: Native support for AWS, Azure, GCP, Kubernetes, databases, CI/CD tools, and virtually any service in a modern stack.
- Security monitoring: Cloud SIEM with 900+ detection rules, AI-powered anomaly detection, and compliance monitoring for PCI-DSS, HIPAA, SOC 2, and GDPR.
- Real User Monitoring: Track actual user experience with session replay, Core Web Vitals tracking, and frontend performance analysis.
What I like about Datadog
The depth of observability is unmatched. When I read through reviews, a recurring theme was how Datadog eliminates the "which tool do I check first?" problem. One user described it as having "metrics, logs, traces, and security data in a single interface" that "dramatically reduces mean time to resolution."
The integration ecosystem also stands out. If you're using a modern tech stack, Datadog almost certainly has pre-built support for it. Users frequently mention the "out-of-the-box dashboards" that provide immediate value without extensive configuration.
What G2 users like about Datadog
"What I like best about Datadog is how seamlessly it brings together metrics, logs, and traces in one place. The dashboard is very intuitive, and it's easy to set up real-time monitoring for applications and infrastructure."
"Datadog helps us centralize monitoring across all our infrastructure and applications. We use it to collect logs, metrics, and traces in one place, making it much easier to detect and troubleshoot issues before they impact users."
How much does Datadog cost?
Datadog's pricing is usage-based and complex, with separate charges for different capabilities:
- Infrastructure monitoring: $15/mo per host (Pro) or $23/mo per host (Enterprise)
- Log management: Based on ingested and indexed log volume
- APM: Based on traced spans per month
- Custom metrics: Additional charges beyond included allowances
- RUM, Synthetic, Security: Each priced separately
Several G2 reviewers mentioned that while Datadog is powerful, costs can "ramp up quickly" and become "unpredictable" as usage scales. One user noted: "Managing costs can be tricky, especially when you're monitoring multiple environments."
What Datadog is not good at
From the reviews I analyzed, pricing complexity is the primary friction point. Users frequently mentioned "unexpected bills," "difficulty understanding costs," and challenges predicting monthly spend. One reviewer called the pricing "confusing" with "hidden costs."
The interface, while powerful, can feel overwhelming. Multiple reviewers noted a "steep learning curve" and that "there are so many features" it's "hard to figure out exactly how to get the most out of it." New users described feeling "lost" navigating the extensive dashboard options.
Status pages are not a core Datadog feature. If customer-facing status communication is important to your workflow, you'll need a separate tool.
Support quality came up as inconsistent in reviews. Some users reported "tickets taking months to resolve" and "inadequate communication" on billing disputes.
Is Datadog right for you?
Mid-market to enterprise organizations with complex, distributed infrastructure who have the budget and technical expertise to maximize value from a comprehensive observability platform. Particularly strong for teams managing microservices, multi-cloud deployments, and organizations with security/compliance requirements. Not the right fit for teams primarily focused on simple uptime monitoring or those on tight budgets.
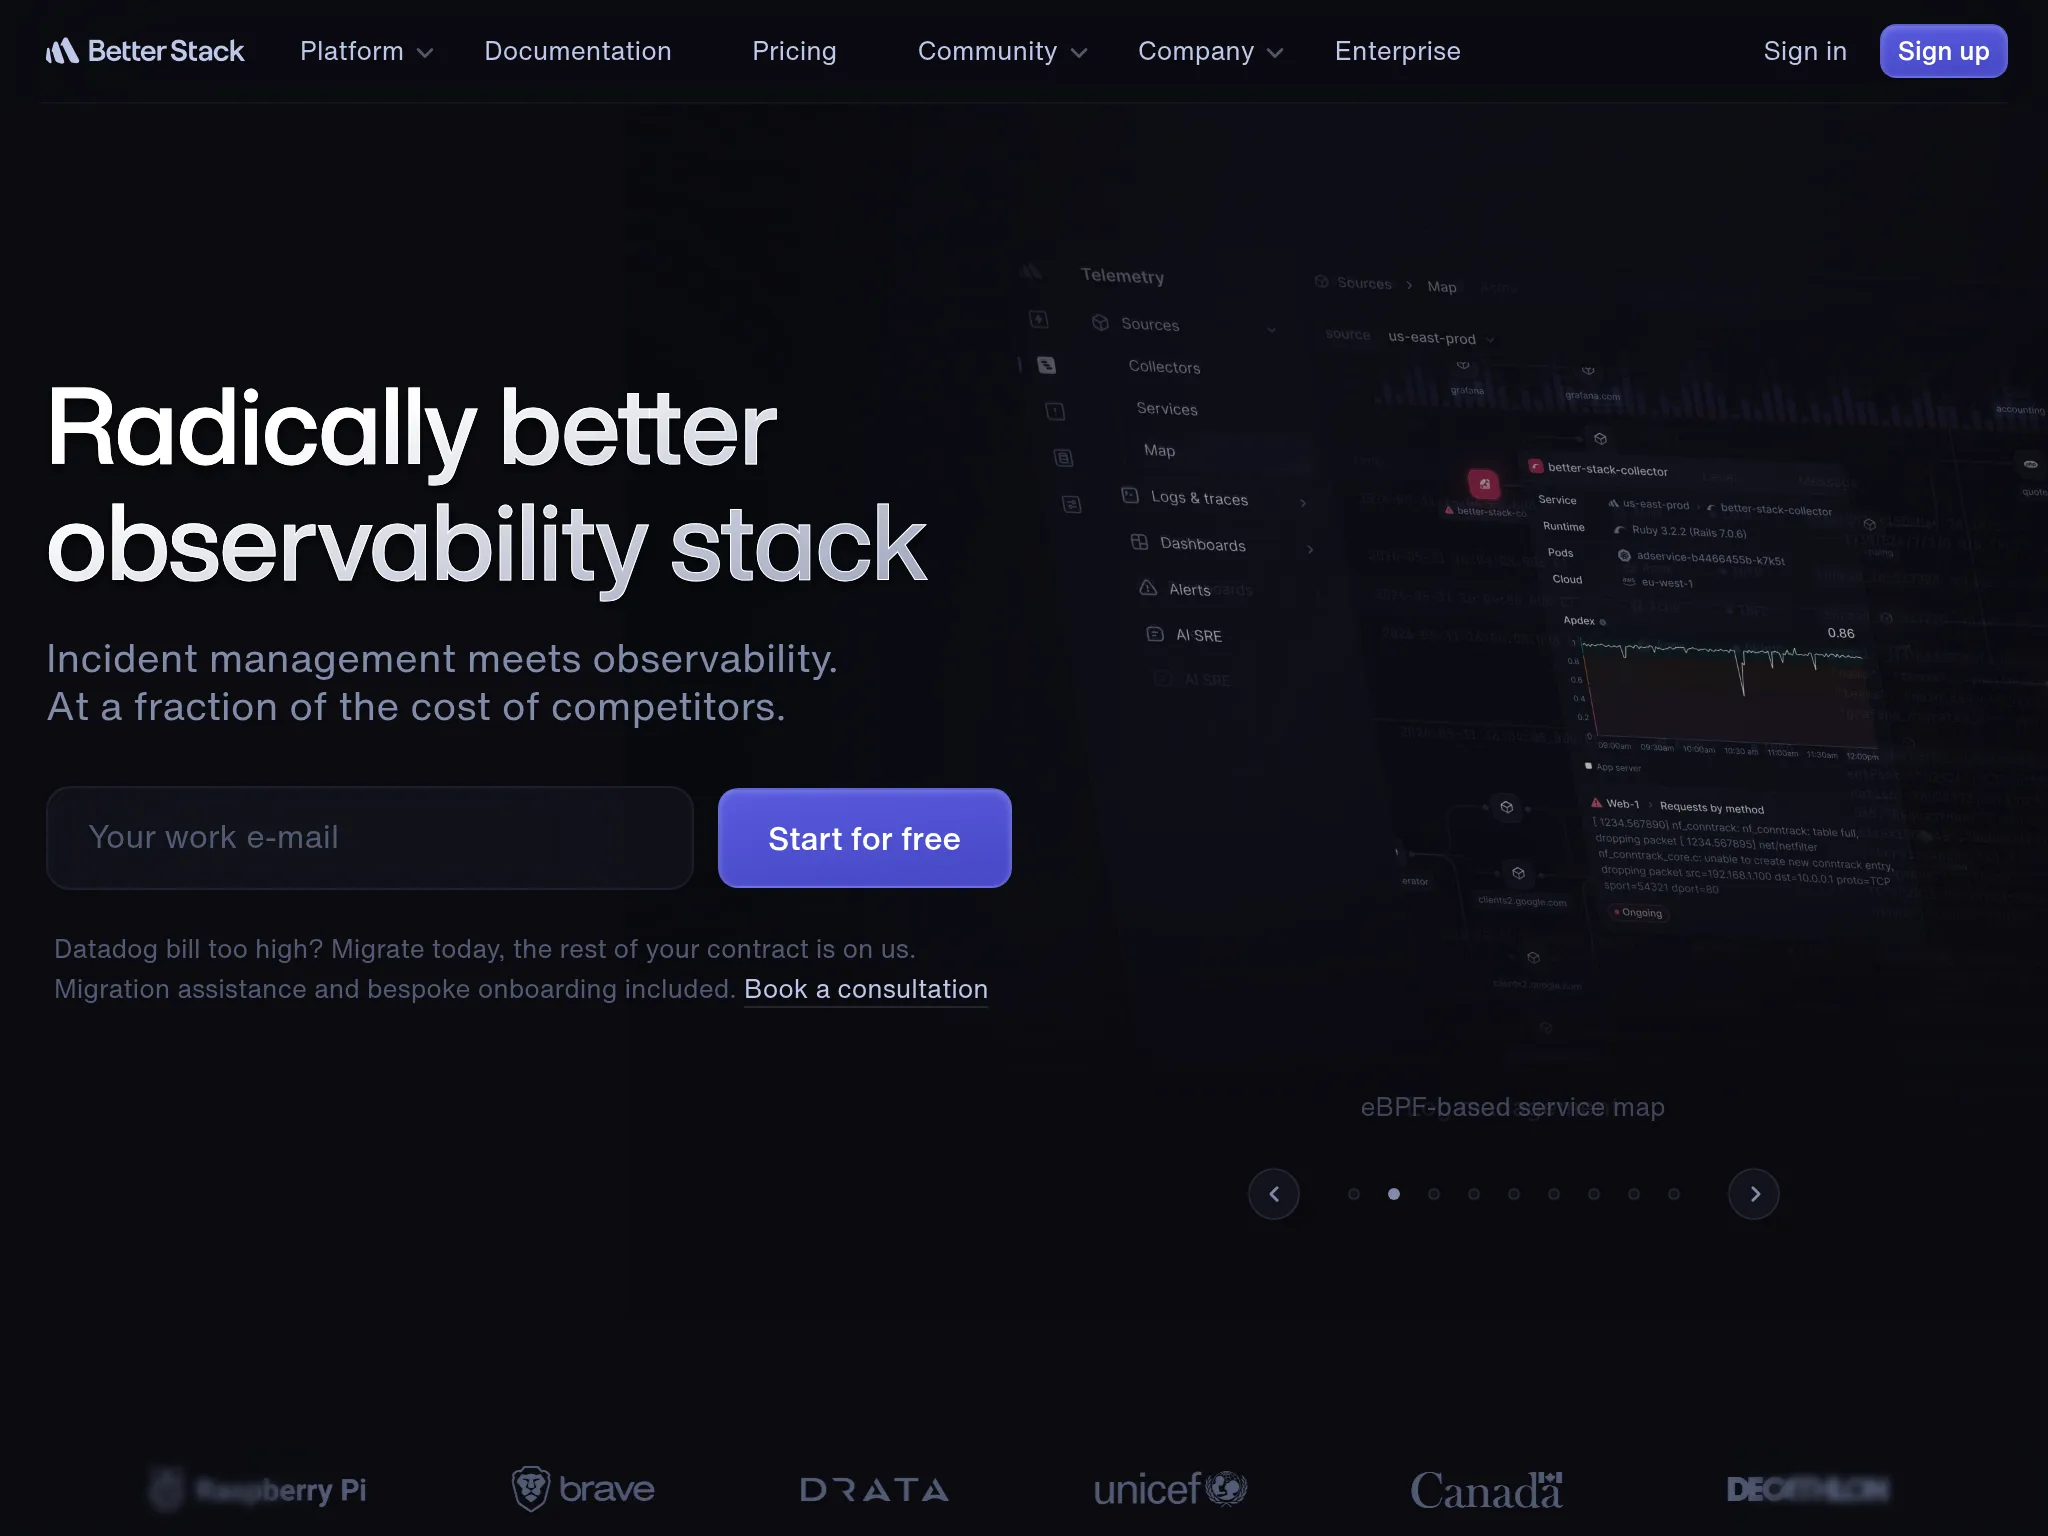
Better Stack: Best for unified uptime monitoring with incident management
Perfect for
Teams that want uptime monitoring tightly integrated with logs, metrics, and incident management. Better Stack works well when you need to move quickly from "something's down" to "here's why and here's the fix."
From what I gathered in G2 reviews, this integration is the main reason teams choose it over standalone monitoring tools.
What Better Stack actually does: Key features
- Unified incident timeline: When an alert fires, you immediately see related logs, metrics, and screenshots in one view. Multiple reviewers called out how this speeds up troubleshooting compared to jumping between tools.
- On-call scheduling: Built-in rotations, escalation chains, and SMS/voice alerts. The on-call functionality gets consistent praise for reliability.
- Terraform provider: DevOps teams appreciate being able to define monitors and on-call policies as code.
- Log management: Not just monitoring, you get centralized logging with SQL-like queries and real-time tailing. This dual capability is unique among simpler monitoring tools.
- Global probes: Multi-region checks to verify outages aren't just network blips from one location.
What I like about Better Stack
The integration between components genuinely works. When I read through reviews, a common theme was how seamlessly everything flows from detection to investigation to resolution. One user described it as "having all the context you need without switching tabs."
The Terraform support also stands out. If you're managing infrastructure as code, Better Stack fits naturally into that workflow.
What G2 users like about Better Stack
"The integration of log management with incident timelines and screenshots provided a holistic view of outages and errors, streamlining root cause analysis and post-incident reviews. Automated AI post-mortems and detailed reporting features supported a culture of continuous improvement."
"I love using Better Stack, it's easy to implement, has very good customer support, I use it often, there are quite a few features, and their API is super simple to integrate."
How much does Better Stack cost?
Better Stack's pricing is usage-based and seat-based:
- Users: $29/mo/responder (but unlimited team members who aren't responders)
- Status pages: Many features for status pages are paid addons
- Monitors: After the free limits, it's $21/mo for every 50 monitors, $17/mo for every 10 cron job monitors, and $1 for every 100 Playwright minutes (synthetic monitoring)
Several G2 reviewers mentioned that while pricing is competitive at smaller scales, it can climb quickly for larger deployments or heavy log volumes.
What Better Stack is not good at
From the reviews I analyzed, pricing transparency is the main friction point. Users frequently noted that while the platform itself is excellent, predicting monthly costs requires careful estimation of hosts, log volume, and alert channels.
One reviewer mentioned: "The initial paid tier out the gate starts at $29 which is very steep for the small open source services I run."
The interface is praised as modern and intuitive, but mastering all the features takes time. Several reviewers mentioned needing dedicated onboarding to unlock the platform's full potential.
Better Stack is also less mature than Datadog in APM and distributed tracing. If you need deep code-level visibility into application performance, Datadog's purpose-built tools are more advanced.
Is Better Stack right for you?
DevOps teams and SREs managing cloud-native infrastructure who want to consolidate monitoring, logging, and incident response without the complexity of full-stack APM. It's particularly strong for teams already using infrastructure-as-code practices and those who value modern tooling. Not the right fit if you need comprehensive APM with distributed tracing.
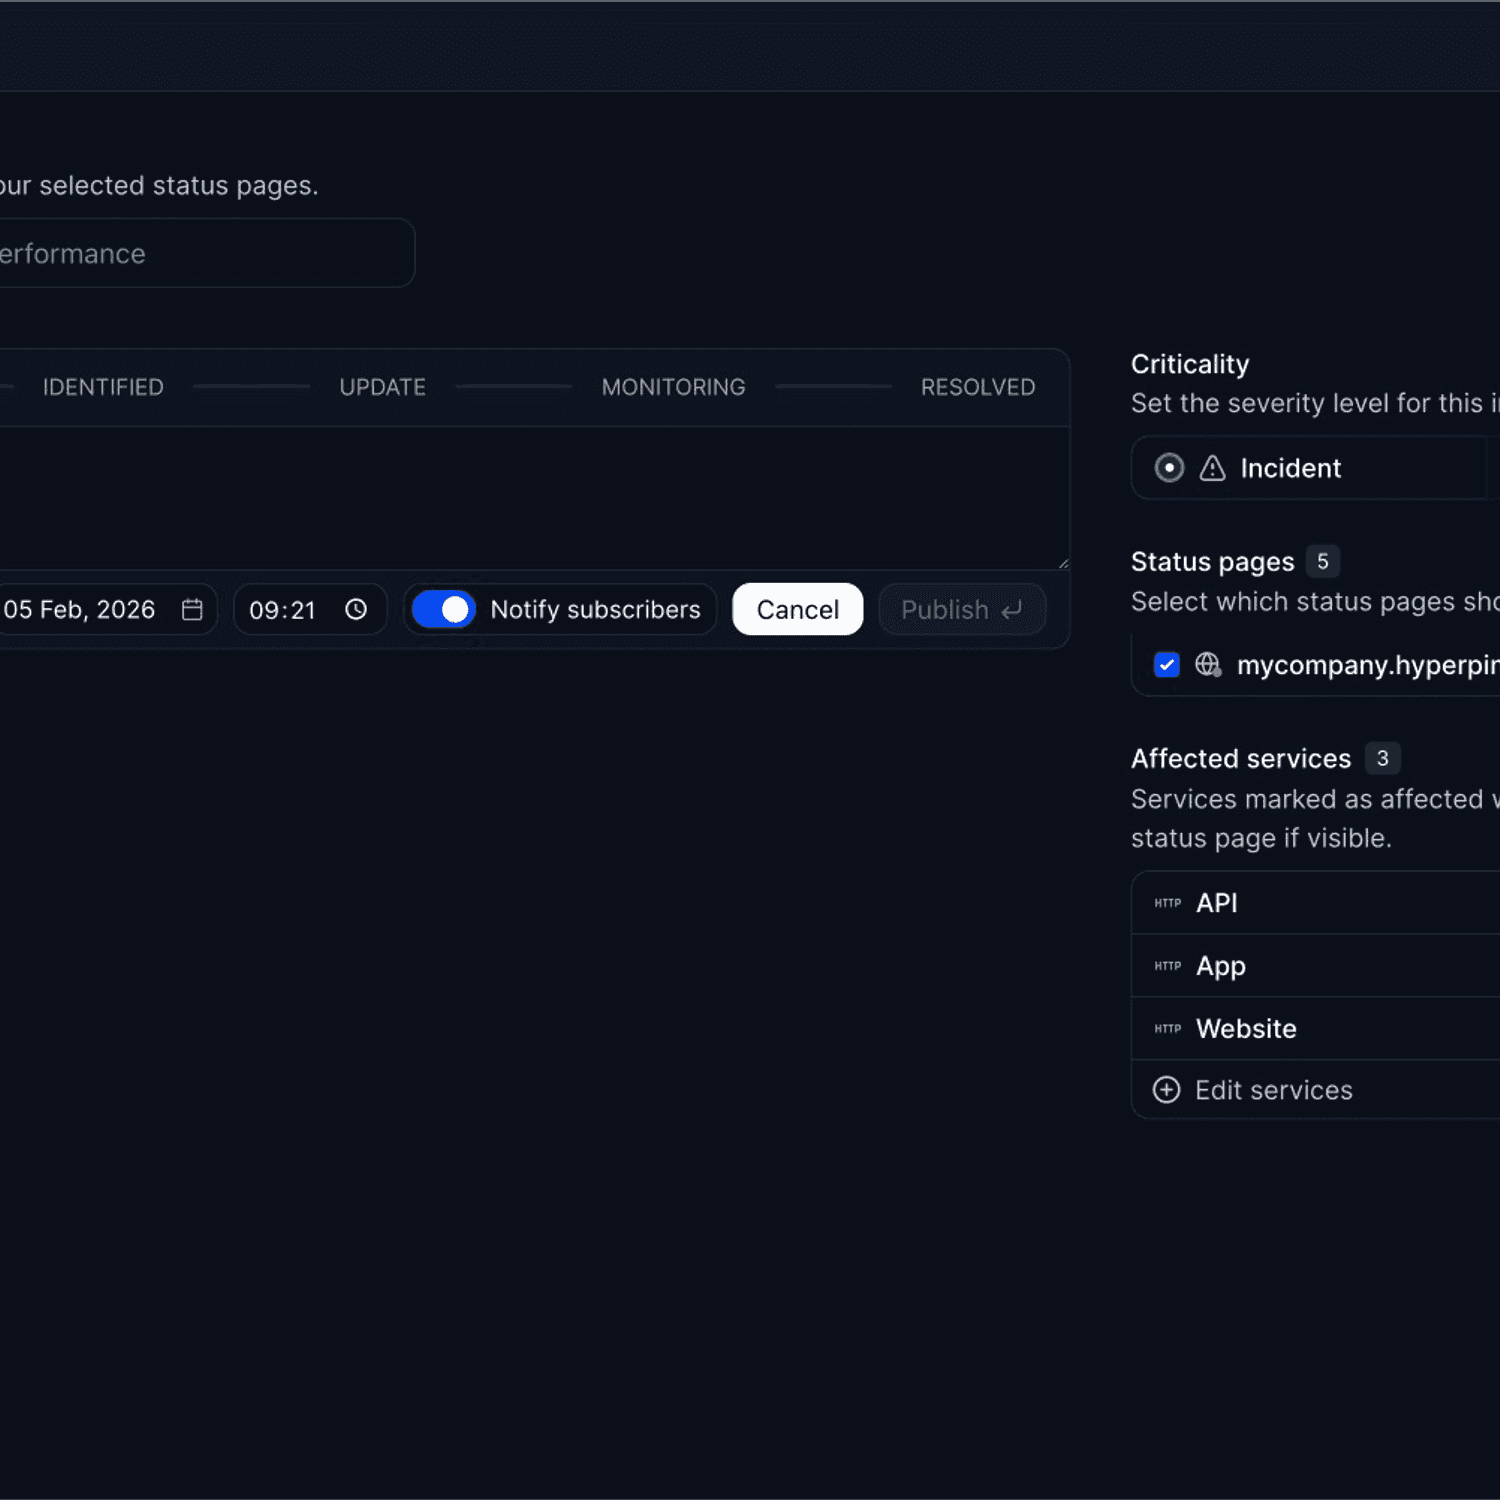
Hyperping: Best for straightforward monitoring with polished status pages
Perfect for
Teams that want reliable uptime monitoring without complexity or budget strain. Hyperping focuses on doing the essentials extremely well rather than adding every possible feature.
From the reviews I analyzed and conversations I had with customers, Hyperping appeals to teams that value simplicity and predictable pricing. It's particularly popular with European companies due to EU hosting.
Notable features include
- 30-second check intervals: Faster than many competitors, matching Better Stack's frequency. It's even 10-second for the Business plan.
- Multiple full-featured status pages: On Pro plan, you get 3 status pages, each with custom domains and branding.
- Browser-based transaction monitoring: Uses Playwright for synthetic testing of critical user flows
- On-call scheduling and smart escalation policies: Streamline incident response with automated scheduling, smart escalation, and multi-timezone coordination
- Voice call alerts: Included even on lower tiers
- European hosting: GDPR-compliant infrastructure for teams with data residency requirements
Why choose Hyperping?
Key reason #1: Predictable, transparent pricing that doesn't explode as you scale
Unlike Datadog's usage-based model (where costs depend on hosts, log volume, spans, and custom metrics) or Better Stack's per-responder pricing with numerous addons, Hyperping offers flat-rate plans with no hidden usage fees. You know exactly what you'll pay each month.
This matters when you're budgeting for the year or pitching monitoring costs to finance. With Datadog, adding more services can mean hundreds or thousands in additional monthly costs. With Hyperping, 100 monitors and 3 full-featured status pages cost $74/month, period.
Key reason #2: Status pages that become a sales asset
Datadog doesn't focus on status pages. Better Stack includes them but with many features behind paid addons. Hyperping treats status pages as a core feature, not an afterthought.
You get 3 status pages on the Pro plan with custom domain support, multi-language options, subscriber notifications, and beautiful default styling. Customers describe using their Hyperping status page in sales conversations to demonstrate reliability.
"We are also using Hyperping's status pages. First to communicate with our customers. And also we are using this as a sales collateral to show that we are available, that the availability is high."
Key reason #3: EU-based monitoring that doesn't compromise on features
Most monitoring tools were built in the US and retrofitted for GDPR compliance as an afterthought. Hyperping is designed from the ground up for European data regulations. Your monitoring data stays in EU data centers, managed by EU companies, with no data transfers to third countries.
For EU-based companies, this isn't just a nice-to-have. It's about avoiding legal complexity and data transfer agreements that come with US-hosted tools.
What I like about Hyperping
You know exactly what you're paying each month without calculating check volumes or worrying about usage spikes. Several customers specifically called this out as a major advantage when budgeting.
The setup experience gets consistent praise. Users report being up and running in minutes rather than hours. For teams that don't need full-stack observability, this simplicity is valuable.
What actual Hyperping users say
"Hyperping has been a total game-changer for us. The service is reliable, easy to use, and incredibly feature-rich. I love that it constantly checks our site and alerts us right away if there are any issues."
"With Hyperping we have full visibility on response times and uptime metrics from around the globe. Knowing that our servers serve requests in milliseconds no matter where a customer is located, gives us confidence and peace of mind."
How much does Hyperping cost?
Hyperping's pricing is notably simpler than the alternatives:
- Essentials: $24/month for up to 2 seats, 50 monitors, 1 status page, and 3 browser checks
- Pro: $74/month for 100 monitors, 10 browser checks, 5 seats, and 3 status pages
The Pro plan at $74/month delivers the core functionality most teams need. Compared to Datadog or Better Stack at similar scales, this represents significant savings and predictability.
What Hyperping is not good at
Hyperping doesn't try to be a full observability platform. You won't get integrated log management like Better Stack or comprehensive APM like Datadog. If you need to trace requests through distributed microservices or analyze application code performance, you'll need additional tools.
The synthetic monitoring capabilities are less mature than Datadog's. If complex browser flows with deep APM integration are critical, Datadog's purpose-built tools are more sophisticated.
For organizations managing thousands of services across multi-cloud deployments, Hyperping's focused feature set may feel limited compared to Datadog's breadth.
Is Hyperping right for you?
Startups, SMBs, and growing companies who want solid monitoring without overpaying or over-configuring. It's particularly appealing for European companies that value GDPR compliance, teams with straightforward monitoring needs who want beautiful status pages, and anyone frustrated by unpredictable usage-based pricing models.
Frequently asked questions
Can I use multiple tools together?
Yes, and many teams do. We have customers using Hyperping alongside bigger tools like Datadog or AWS CloudWatch.
"In addition to CloudWatch, we also want to have a view on our system from the outside. And this is where Hyperping comes in. It is basically an independent monitoring solution for us, just looking from the outside, pinging the API and the websites and all the crucial parts of our infrastructure."
How important is check frequency?
Our customers praise the speed of alerts from Hyperping. They say it's usually faster than other monitoring tools they use. So 30-second checks are definitely worth it.
"We have the real-time alerts from Hyperping telling us if the app is down. These are sometimes arriving even before AWS notices or notifies us. So, that's a crucial part in our daily process."
What about open-source alternatives?
Tools like Grafana with Prometheus offer powerful monitoring but require self-hosting and significant configuration expertise. If you have the infrastructure team and time, they're worth considering. Most teams I spoke with prefer the reliability and support of managed services.
When does Datadog make sense over simpler tools?
When you're running hundreds of microservices across multiple cloud providers and need to understand how they interact. Datadog's distributed tracing and APM capabilities shine in complex environments. If your infrastructure is simpler, or uptime monitoring and status pages are your primary concerns, the additional complexity and cost may not be justified.
Migrating to Hyperping
If you're leaving Better Stack for Hyperping, follow the migrate from Better Stack to Hyperping guide. It covers exporting monitors and heartbeats via API, running both tools in parallel, and cutting over. Hyperping also offers free white-glove migration on paid plans.
How to test these tools before you commit
All three platforms offer trials or free tiers:
- Datadog: Free tier for up to 5 hosts, 14-day free trial for full features
- Better Stack: Free tier available for testing
- Hyperping: Free tier and also a 14-day free trial on all paid plans
Start with the free options that match your use case. Run them in parallel with your existing monitoring for a week to see which fits your workflow. Pay attention to false positive rates, alert reliability, and how quickly you can investigate issues when they occur.
For Datadog specifically, monitor your usage carefully during the trial. Several reviewers mentioned being surprised by costs after enabling multiple features.
The monitoring space is mature, so switching costs are low. Most teams I spoke with had tried 2-3 tools before settling on their current choice. Don't feel locked in by your first decision.
FAQ
How do Better Stack, Datadog, and Hyperping compare for monitoring? ▼
Datadog is best for full-stack observability across complex distributed systems (APM, tracing, security), Better Stack for unified uptime monitoring with integrated logging and incident management, and Hyperping for cost-effective uptime monitoring with status pages, on-call scheduling, and predictable flat-rate pricing starting at $24/month.
How much does Datadog cost for uptime monitoring compared to Better Stack and Hyperping? ▼
Datadog is dramatically more expensive for uptime monitoring: approximately $2,500/month for 50 monitors (via synthetic monitoring at $5 per 10,000 test executions). Better Stack costs around $50/month and Hyperping just $24/month for the same 50 monitors. At 1000 monitors, Datadog reaches roughly $50,000/month vs Hyperping's $249/month.
Do I need full-stack observability or is uptime monitoring enough? ▼
If you run hundreds of microservices across multiple cloud providers and need distributed tracing and APM, Datadog's depth is justified. For most teams focused on uptime monitoring, status pages, and incident response, Hyperping delivers everything you need at a fraction of the cost with 30-second checks, on-call scheduling, and polished status pages from $24/month.
Which monitoring tool is best for EU-based teams needing GDPR compliance? ▼
Hyperping is the strongest choice. It's a French company with all data stored in EU data centers, designed from the ground up for GDPR compliance with no data transfers to third countries. Datadog and Better Stack are US-based, requiring cross-border data transfer agreements and Standard Contractual Clauses.
Which tool has the best status pages: Datadog, Better Stack, or Hyperping? ▼
Hyperping treats status pages as a core feature, with 3 fully branded pages on the Pro plan ($74/month) including custom domains, multi-language support, and subscriber notifications. Customers use them as sales collateral to demonstrate reliability. Better Stack includes status pages but locks many features behind paid add-ons. Datadog does not focus on status pages at all.