The best Better Stack alternatives are Hyperping (cost-effective monitoring + on-call + status pages), Datadog (deep observability), PagerDuty (enterprise on-call), incident.io (Slack-native incidents), and Axiom (high-volume logs). I analyzed 42 tools total and narrowed it to these five based on hundreds of G2 reviews, hands-on testing, and conversations with DevOps teams.
Most teams leave Better Stack for one of three reasons: pricing that jumps sharply from free to paid, limited full-stack visibility as you scale, or no unified dashboard across teams.
In this guide, you'll learn:
- Why teams leave Better Stack (based on real user feedback, not speculation)
- Five alternatives that solve specific problems Better Stack doesn't
- Honest pricing comparisons with actual numbers
- Which tool fits your team size, technical maturity, and budget
If you want monitoring that catches issues in 30 seconds, status pages that strengthen customer trust, on-call scheduling with smart escalation policies, and pricing you can actually predict, Hyperping delivers exactly that. Schedule a demo to see how it works.
Key takeaways
- Hyperping is the most cost-effective option starting at $24/mo flat-rate with no per-user fees: includes monitoring, on-call, and status pages.
- Datadog offers the deepest observability (metrics, logs, traces, APM) but costs can spiral quickly with log ingestion and custom metrics.
- PagerDuty handles the most complex on-call scenarios (follow-the-sun, 20-rule escalation policies) but starts at $21/user/mo with expensive add-ons.
- incident.io runs the full incident lifecycle inside Slack and uses AI to investigate root causes, ideal for Slack-centric teams at ~$45/user/mo.
- Axiom stores high-volume logs at a fraction of typical costs with 95%+ compression and no sampling required, starting at $25/mo.
Why you should trust this guide
I'm Léo, founder of Hyperping. Yes, that means I have a stake in one of these tools. But I've seen teams choose competitors when they were genuinely the better fit. My goal isn't to convince you Hyperping is always the answer. It's to help you understand which tool actually solves your problem.
I've analyzed hundreds of G2 reviews, tested platforms myself, reviewed detailed product analyses, and talked to engineering teams about their experiences. Where I couldn't test something directly, I relied on verified user feedback and documented sources.
Top picks at a glance
| Best for | Product |
|---|---|
| Cost-effective monitoring + on-call + status pages | Hyperping |
| Comprehensive observability suite (APM + infra + logs) | Datadog |
| Enterprise-grade on-call scheduling and escalation | PagerDuty |
| Slack-native incident management workflows | incident.io |
| High-volume log search and analytics | Axiom |
Why teams consider Better Stack alternatives
When evaluating monitoring and observability solutions, organizations frequently encounter limitations with Better Stack that prompt them to explore alternatives. Here are the primary reasons teams consider switching:
Pricing that's hard to predict
The transition from Better Stack's free tier to paid plans represents a significant jump that catches many users off guard. While the free tier offers 10 monitors and basic features, growth quickly necessitates upgrading to the $29/month per-responder plan.
This per-responder licensing model, combined with usage-based billing for additional monitors ($21/month for 50 more), heartbeats ($17/month for 10 more), and status pages ($12/month each + addons), makes costs difficult to predict as teams scale.
For startups and small teams particularly, reviewers note the pricing feels "steep" compared to competitors. Basic integrations like webhooks and Google Analytics require paid plans, and the jump from free to paid is described as "too much" without intermediate tiers for very small businesses.
Limited full-stack visibility
While Better Stack excels at logs, uptime monitoring, and incident management, users frequently cite missing capabilities as they scale:
- No native metrics or tracing: Better Stack doesn't offer infrastructure metrics or advanced distributed tracing capabilities
- Limited customization: As systems grow more complex, users desire more advanced integrations and configuration flexibility
- Missing enterprise features: Reviewers mention wanting more sophisticated monitoring capabilities beyond the platform's simplified approach
Multi-team dashboard gaps
Organizations managing multiple teams face a significant usability issue: Better Stack doesn't provide a unified dashboard showing the current status of monitors across all teams. Users must manually switch between teams to get a global view of their monitoring landscape. This creates friction for organizations with complex structures requiring centralized visibility.
Quick comparison: Better Stack alternatives
| Tool | Starting Price | Best For | Main Limitation |
|---|---|---|---|
| Hyperping | $24/mo (50 monitors) | SMBs wanting monitoring + status pages + on-call | Not a full observability platform |
| Datadog | $15/host/mo + usage | Deep observability across metrics, logs, traces | Costs can spiral with usage |
| PagerDuty | $21/user/mo | Enterprise on-call scheduling and escalation | Expensive, complex for small teams |
| incident.io | $25/user/mo (Team + On-call) | Slack-native incident workflows | More for Slack-centric teams |
| Axiom | $25/mo | High-volume log analytics | Less "all-in-one" than mega-vendors |
Hyperping: Best for cost-effective monitoring with on-call and status pages
Who Hyperping is built for
Teams that want reliable uptime monitoring, polished status pages, and on-call scheduling without complexity or budget strain. Hyperping focuses on doing the essentials extremely well rather than adding every possible feature.
From the reviews and conversations I analyzed, Hyperping appeals to teams that value simplicity and predictable pricing. It's particularly popular with European companies due to being a French company and EU hosting, and with growing SaaS teams that need more than basic monitoring but don't need full observability suites.
Key Hyperping features
- 30-second check intervals: Faster than most competitors. Business plans support sub-30-second intervals for mission-critical services.
- On-call scheduling and escalation policies: Create flexible schedules with timezone-aware support, automatic rotation, and multi-step escalation. Not something you typically find in "simple" monitoring tools.
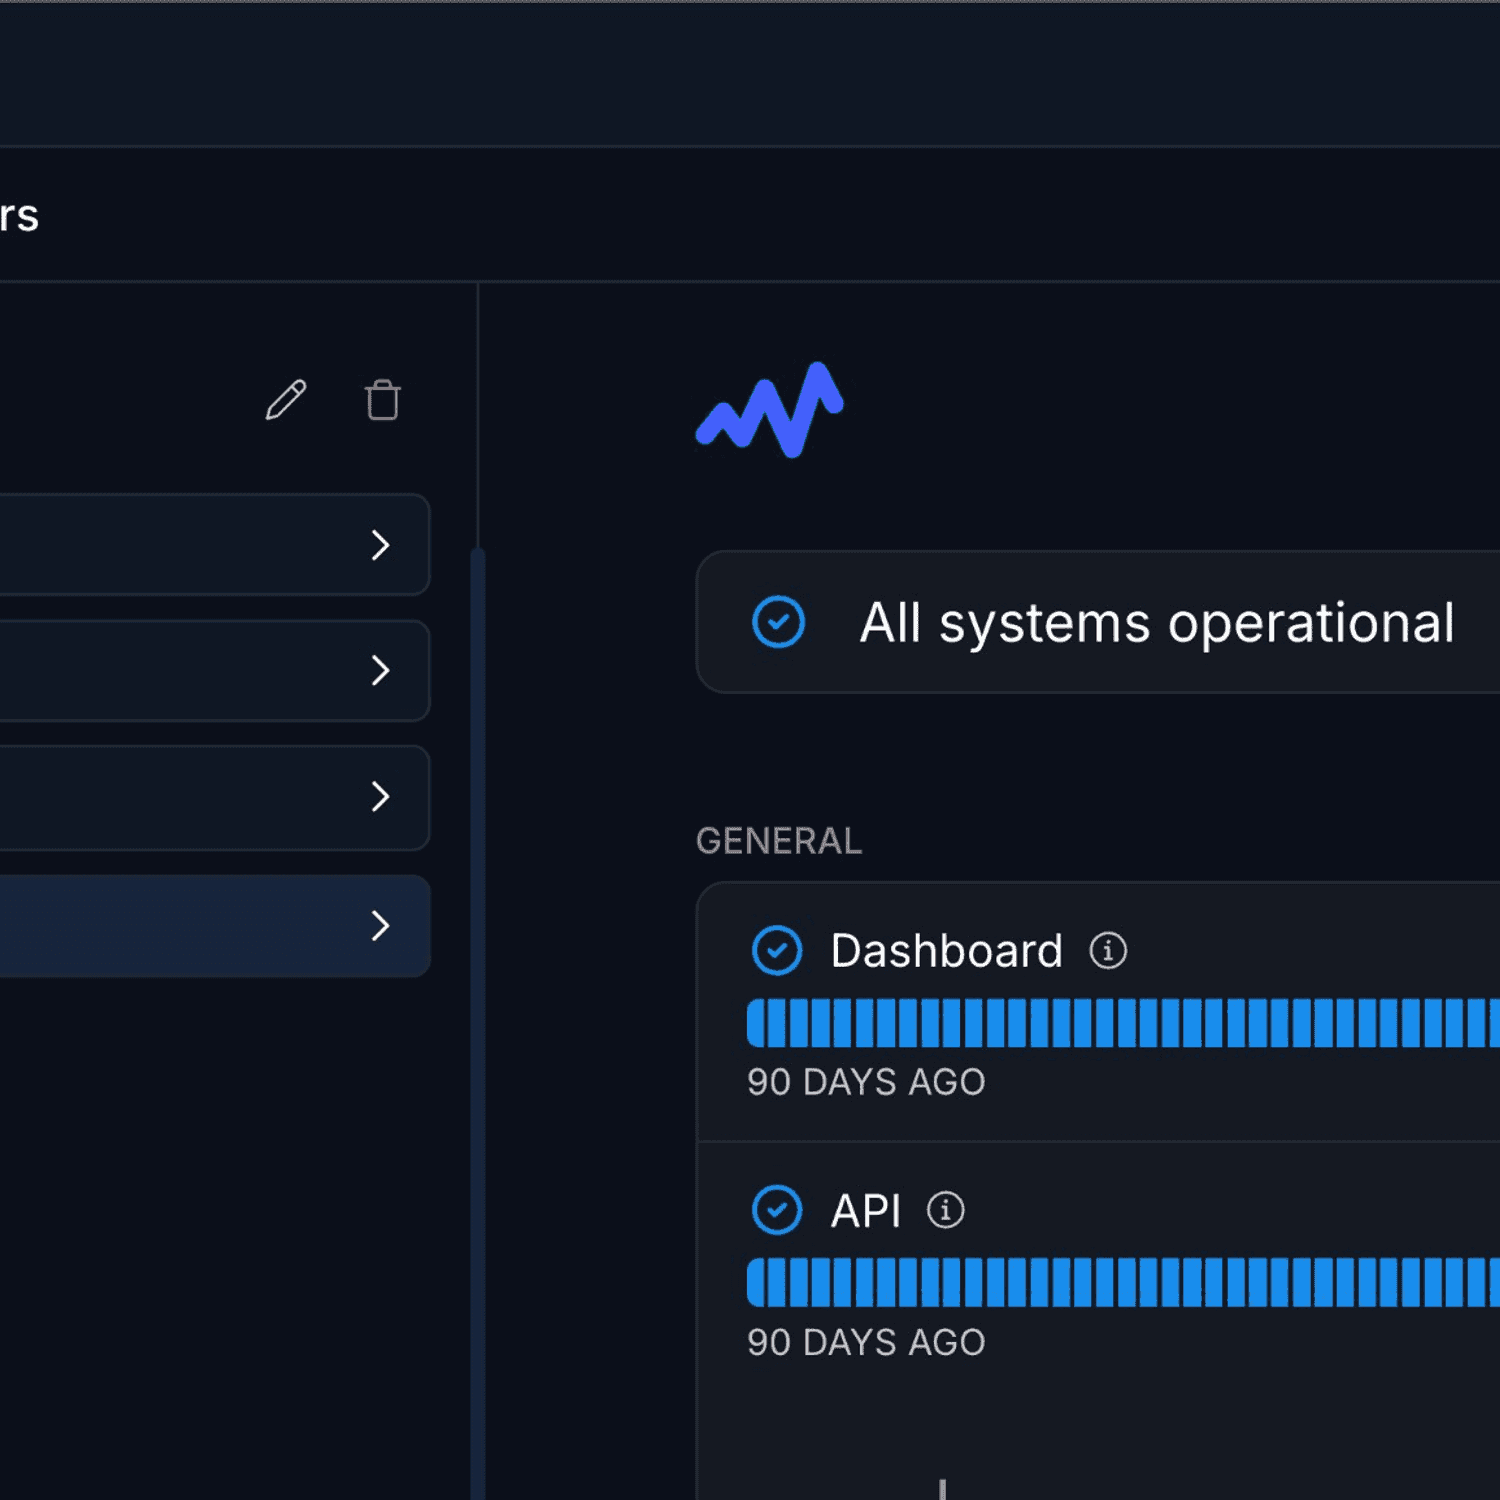
- Multiple full-featured status pages: On Pro plan, you get 3 status pages, each with custom domain, white-label branding, multi-language support, and more.
- Browser-based synthetic monitoring: Uses Playwright for end-to-end testing of critical user flows like checkout or login processes.
- Multi-channel alerting: Email, SMS, voice calls, Slack, Discord, Telegram, Microsoft Teams, PagerDuty, OpsGenie, and webhooks.
- European hosting: GDPR-compliant infrastructure with all data stored in EU data centers.
Why choose Hyperping over Better Stack?
Key reason #1: Predictable pricing that doesn't explode as you scale
Unlike Better Stack's usage-based model (where costs depend on responder count, monitor add-ons, and status page fees), Hyperping offers flat-rate plans with no hidden usage fees. You know exactly what you'll pay each month.
With Better Stack, adding 50 monitors costs $21/month, plus $29 per responder, plus potential overages. With Hyperping, 100 monitors, 3 status pages, and 5 team members cost $74/month total.
Key reason #2: Complete monitoring platform without enterprise complexity
Most tools force you to choose: simple but limited (basic ping monitors), or powerful but overwhelming (full observability suites requiring dedicated training). Hyperping delivers on-call scheduling, smart escalation policies, synthetic monitoring, and beautiful status pages wrapped in an interface you'll actually want to use.
Key reason #3: EU-based monitoring that doesn't compromise on features
Most monitoring tools were built in the US and retrofitted for GDPR compliance as an afterthought. Hyperping is designed from the ground up for European data regulations. Your monitoring data stays in EU data centers, managed by EU companies, with no data transfers to third countries.
What actual Hyperping users say
"Hyperping has been a total game-changer for us. The service is reliable, easy to use, and incredibly feature-rich. I love that it constantly checks our site and alerts us right away if there are any issues."
"We made our Hyperping status page publicly available and it became a crucial part of our sales pitches. We are proud of our uptime and we love that we can share it with prospects and customers in such an easy way."
How much does Hyperping cost?
- Essentials: $24/month for 50 monitors, 1 status page, 3 browser checks, 2 seats
- Pro: $74/month for 100 monitors, 3 status pages, 10 browser checks, 5 seats
- Business: $249/month for 1000 monitors, 10 status pages, 20-second checks, 25 browser checks, 15 seats, priority support, and more.
All plans include on-call scheduling, escalation policies, and voice call alerts.
Where Hyperping falls short
Hyperping doesn't try to be a full observability platform. You won't get integrated log management like Better Stack or the depth of APM that tools like Datadog offer. If you need to correlate logs, metrics, and traces in a single platform, you'll need additional tools.
The synthetic monitoring is capable but less mature than enterprise platforms. If complex browser flows with dozens of steps are critical to your monitoring strategy, Datadog or dedicated synthetic tools may be more sophisticated.
Is Hyperping right for you?
Choose Hyperping if you're a startup, SMB, or growing SaaS team that wants solid monitoring, on-call scheduling, and status pages without overpaying or over-configuring. It's particularly appealing for European companies valuing GDPR compliance, teams frustrated by usage-based pricing surprises, and anyone who wants monitoring that "just works" in minutes rather than hours.
Switching from Better Stack? Follow the migrate from Better Stack to Hyperping guide.
Datadog: Best for comprehensive observability
Who Datadog is built for
Organizations that want deep visibility into their entire stack: infrastructure metrics, application performance, logs, and user experience, all correlated in a single platform. Datadog works well when you need to move from "something's slow" to "here's the exact line of code causing the problem."
From what I gathered in G2 reviews, Datadog's strength is end-to-end observability. Teams choose it when basic uptime monitoring isn't enough and they need to understand not just if something is down, but why.
Key Datadog features
- Unified metrics, logs, and traces: When an issue occurs, you can pivot from a metric spike to the relevant logs to the exact trace showing where time was spent. Multiple reviewers called out how this speeds up troubleshooting compared to switching between tools.
- 650+ integrations: Out-of-the-box support for AWS, Azure, GCP, Kubernetes, databases, CI/CD tools, and virtually every technology in the modern stack.
- AI-powered anomaly detection: Watchdog AI automatically surfaces issues before you notice them, identifying anomalies in metrics and correlating them across services.
- Real User Monitoring (RUM): Track actual user sessions, including Core Web Vitals, session replay, and frontend errors.
- Infrastructure monitoring: Auto-discovery of servers, containers, and cloud services with customizable dashboards and alerting.
Why choose Datadog over Better Stack?
Deep observability vs. surface-level monitoring
Better Stack excels at "is it up?" and centralized logging. Datadog answers "why is it slow?" with code-level visibility. If you're running distributed microservices and need to trace a request through 15 services to find the bottleneck, Datadog's APM provides that granularity.
Correlation across the entire stack
When a Datadog alert fires, you can immediately see related infrastructure metrics, application traces, and log entries in a unified view. One G2 reviewer put it well: "Datadog has replaced our organization's reliance on many different tools in a single package. We used to use Sentry, self-hosted ELK stack, Grafana, Jaeger, OpsGenie. The best part is that Datadog does all the different things these other tools did, but better."
What G2 users say about Datadog
"What I like best about Datadog is how seamlessly it brings together metrics, logs, and traces in one place. The dashboard is very intuitive, and it's easy to set up real-time monitoring for applications and infrastructure."
"Datadog provides real-time visibility into infrastructure and application performance with intuitive dashboards and robust alerting. The out-of-the-box integrations with AWS, Azure, and Kubernetes are a huge plus and save a lot of setup time."
How much does Datadog cost?
Datadog's pricing is usage-based and can be complex:
- Infrastructure Monitoring: $15/host/month (Pro) or $23/host/month (Enterprise)
- APM: $31/host/month (Pro) or $40/host/month (Enterprise)
- Log Management: $0.10/GB ingested + $2.55/million events indexed per month (varies by retention)
- RUM: $1.50 per 1,000 sessions
The free tier offers up to 5 hosts with 1-day retention, suitable only for testing. A 14-day free trial provides full access to all features.
Where Datadog falls short
Pricing unpredictability is the most consistent complaint in reviews. Users frequently mention that costs can spiral quickly with log ingestion, custom metrics, and APM spans. One reviewer noted: "Pricing can ramp up quickly, especially when enabling multiple features like log management, APM, and custom metrics."
Complexity for simple use cases. If you just need uptime monitoring and a status page, Datadog is overkill. The platform's power comes with a learning curve, and several reviewers mentioned the interface feeling "overwhelming at first due to the number of features."
Support experiences vary. While some users praise Datadog's responsiveness, others report delayed responses and difficulty resolving billing disputes.
Is Datadog right for you?
Choose Datadog if you're a mid-market to enterprise organization with complex, distributed systems and need deep observability across metrics, logs, and traces. It's particularly strong for DevOps and SRE teams managing cloud-native infrastructure, organizations with microservices architectures, and teams that need to correlate data across multiple technology layers. Be prepared to invest in learning the platform and managing costs carefully.
PagerDuty: Best for enterprise on-call and escalation
Who PagerDuty is built for
Large organizations that need sophisticated on-call scheduling, complex escalation policies, and enterprise-grade reliability. PagerDuty works well when you have multiple teams, 24/7 coverage requirements across time zones, and need to prove that alerts will never be missed.
From what I discovered in user feedback, PagerDuty's strength is its scheduling engine and escalation logic. Teams choose it when the consequences of a missed alert are severe (think financial services, healthcare, critical infrastructure).
Key PagerDuty features
- Complex scheduling: Support for "Follow-the-Sun" models, daily/weekly rotations, split shifts, shadows for training, and overrides for vacations. The granularity is unmatched by simpler tools.
- Escalation policies: Configure up to 20 rules per policy with automatic escalation if the primary responder doesn't acknowledge within a specified time. Repeat escalation cycles up to nine times.
- Event Orchestration: Decision-making logic that processes raw events before they become incidents. Define rules like "IF source matches 'database-cluster-1' AND severity is 'critical', THEN route to 'DBA Team' AND set priority to 'P1'."
- AIOps noise reduction: Machine learning algorithms group related alerts into single incidents, reducing alert fatigue. Content-based and time-based grouping options available.
- Runbook Automation: Execute diagnostic or remediation scripts directly from the incident interface. Agents run behind your firewall via outbound HTTPS, satisfying enterprise security requirements.
- 700+ integrations: Connects with virtually any monitoring tool, ITSM platform, or collaboration service.
Why choose PagerDuty over Better Stack?
Enterprise-grade scheduling complexity
Better Stack's on-call scheduling is functional but relatively simple. PagerDuty handles scenarios like: "Primary on-call rotates weekly, but John covers for Sarah next Tuesday through Thursday, and new hire Mike shadows all P1 incidents without being the primary responder, and if nobody acknowledges within 5 minutes escalate to the manager, then to the VP, then to the entire team."
Proven reliability at scale
In the business of crisis response, reliability is paramount. PagerDuty has established a reputation for rock-solid uptime. When your data center is on fire, the pager must work. This trust is their primary competitive advantage with enterprises.
Deep ITSM integration
For organizations using ServiceNow or Jira Service Management, PagerDuty's bidirectional integrations maintain compliance trails and eliminate "swivel-chair" work between systems.
What users say about PagerDuty
Users consistently praise PagerDuty's reliability and scheduling flexibility. The granular control over escalation policies and the ability to handle complex enterprise scenarios (shadows, overrides, multi-team escalations) is frequently mentioned as unmatched by simpler tools.
However, cost and complexity come up repeatedly. PagerDuty is often described as the most expensive option in the market. Per-user pricing and expensive add-ons for AIOps and Automation create a high total cost of ownership.
How much does PagerDuty cost?
- Free: Up to 5 users, max 5 integrations, limited features
- Professional: $21/user/month. Basic incident workflows, external status pages only
- Business: $41/user/month. Unlocks more advanced features, internal status pages. Most common tier.
- Enterprise: Custom pricing. Full flexibility, advanced security (SSO enforcement)
Add-ons for AIOps and Runbook Automation cost extra, which can significantly increase the total bill.
Where PagerDuty falls short
Price. PagerDuty is consistently cited as the most expensive option. The per-user pricing model, combined with add-on costs, creates a high TCO that can discourage organizations from giving licenses to all developers.
Complexity for small teams. The platform is engineered for enterprises. Small teams often find the setup process (Services, Policies, Schedules, Users) to be heavy and bureaucratic compared to simpler alternatives.
Configuration learning curve. The platform's flexibility is powerful but requires significant investment to configure correctly. Poor configuration often leads to "alert noise" despite the tool's capabilities.
Is PagerDuty right for you?
Choose PagerDuty if you're a large enterprise with complex on-call requirements, multiple teams across time zones, and strict SLAs where missed alerts have serious consequences. It's particularly strong for organizations needing deep ServiceNow/ITSM integration, NOC teams requiring centralized visibility, and regulated industries requiring audit trails and compliance documentation. Be prepared for significant setup time and budget.
incident.io: Best for Slack-native incident management
Who incident.io is built for
Engineering teams that live in Slack and want incident management workflows that happen entirely within their collaboration tool. incident.io works well when you want consistent incident response processes without forcing responders to context-switch to a separate platform.
From what I gathered in reviews, incident.io's strength is its Slack-native architecture. Teams choose it when they want to declare, manage, and resolve incidents without leaving their primary communication environment.
Key incident.io features
- Slack-native incident response: Declare incidents with slash commands, manage the entire lifecycle within Slack channels, and coordinate responders without switching tools. The integration goes far beyond simple notifications.
- AI SRE: An autonomous AI agent that investigates incidents in real-time, identifies root causes by analyzing code changes and past incidents, and can suggest or generate fixes before engineers fully engage.
- On-call management: Multi-team scheduling with intelligent escalation, live call routing, and burnout analytics to distribute workload fairly.
- Automated workflows: Customizable automation that handles repetitive tasks like creating incident channels, assigning roles, sending notifications, and triggering integrations based on severity.
- Post-incident analysis: AI-powered post-mortem generation using captured timelines and incident context to draft comprehensive retrospectives.
- Status pages: Public, private, and internal status pages with automated updates and integration with support tools.
Why choose incident.io over Better Stack?
True Slack-native architecture
Better Stack offers Slack integration, but incident.io runs the entire incident lifecycle natively within Slack. This eliminates 10-15 minutes of coordination overhead per incident according to their data. Everything from declaring the incident to assigning roles to closing the post-mortem happens in Slack.
Advanced AI investigation
incident.io's AI SRE goes beyond simple summarization to perform autonomous investigation, analyzing code changes via GitHub integration and achieving approximately 80% precision in identifying incident-causing commits.
Structured incident process
The platform enforces consistent incident response practices: designated incident commanders, scribes, communication channels, and stakeholder updates. This structure is valuable for teams scaling their incident response maturity.
What G2 users say about incident.io
"incident.io is a game-changer for incident response. Its seamless ChatOps integration makes managing incidents fast, collaborative, and intuitive—right from Slack. The platform is packed with powerful features like automated timelines, role assignments, and customizable workflows."
"The onboarding experience was outstanding. We have a small engineering team (~15 people) and the integration with our existing tools (Linear, Google, New Relic, Notion) was seamless and fast, less than 20 days to rollout."
How much does incident.io cost?
incident.io prices incident response and on-call management separately:
- Free: Up to 5 users, single-team on-call, one status page, limited integrations
- Team: $15/user/month (incident response) + $10/user/month (on-call) = $25/user/month combined
- Pro: $25/user/month (incident response) + $20/user/month (on-call) = $45/user/month combined
- Enterprise: Custom pricing (approximately $50/user/month based on market comparisons)
For a 50-person engineering team with 30 on-call users, annual costs would be approximately $21,600 (Team) or $27,000 (Pro).
Where incident.io falls short
Requires Slack-centric culture. The platform's tight integration with Slack is both a strength and limitation. Organizations not heavily invested in Slack (or those using Microsoft Teams, where the integration has fewer features) may find the architecture restrictive.
Complex initial setup. Despite the simple user experience once configured, the initial setup can be overwhelming due to extensive customization options. Multiple reviewers noted high cognitive load during configuration of workflows and escalation policies.
Premium pricing. The effective per-user cost ($31-45/user/month) is significant for startups. While cheaper than PagerDuty at scale, it's more expensive than simpler alternatives.
Status page limitations on lower tiers. Lower-tier plans restrict users to 1-2 status pages.
Is incident.io right for you?
Choose incident.io if your engineering team lives in Slack and wants incident management that fits naturally into existing workflows. It's particularly strong for organizations with 10-30+ incidents per month needing consistent processes, teams wanting AI-powered investigation and post-mortems, and companies transitioning from homegrown solutions or spreadsheet-based incident tracking. Make sure your team is genuinely Slack-centric before committing.
Axiom: Best for high-volume log analytics
Who Axiom is built for
Organizations generating terabytes of log data that find traditional logging tools (Splunk, Datadog Logs) prohibitively expensive. Axiom works well when you need to store and query 100% of your event data without sampling, at a fraction of typical costs.
From what I discovered in user feedback, Axiom's strength is cost-effective log storage at scale. Teams choose it when their observability bills are dominated by log ingestion costs and they're tired of sampling or dropping data to stay within budget.
Key Axiom features
- Serverless architecture: Completely removes the need to manage indices, shards, or storage tiers. Send data and query it. No provisioning.
- Axiom Processing Language (APL): A powerful, piped query language (inspired by Microsoft's Kusto Query Language) for filtering, transforming, and analyzing data in real-time.
- 95%+ compression: Purpose-built data store that compresses data dramatically, enabling affordable unlimited retention.
- Flow: Visual data pipeline tool that routes, filters, and transforms data as it enters the system, sending it to other destinations alongside Axiom storage.
- Virtual Fields: Create new fields from existing data at query time without re-indexing, enabling flexible retroactive analysis.
- Deep Vercel integration: One-click setup to capture logs and vitals from Next.js applications without manual instrumentation.
Why choose Axiom over Better Stack?
Cost efficiency at scale
Better Stack's logging costs scale with ingestion and retention. Axiom's decoupled storage/compute model and extreme compression offer significantly lower pricing for high-volume logging. Users consistently cite this as the primary reason for switching from expensive incumbents.
No sampling required
Unlike tools that force you to sample or drop logs to manage costs, Axiom is built to store "all your data, all the time" economically. This matters when you need to investigate rare events or satisfy compliance requirements.
Query speed
The underlying architecture provides fast query results even over large datasets, which users frequently praise in reviews.
How much does Axiom cost?
- Free (Personal): Generous tier with up to 500 GB/month data loading, suitable for side projects or small startups
- Axiom Cloud (Pro): Starting at $25/month with increased retention, unlimited team members, and advanced features. Pricing scales with data volume.
- Enterprise: "Bring Your Own Cloud" deployment where data stays in your AWS account, plus automatic volume discounts for petabyte-scale needs
Where Axiom falls short
Not a full observability platform. Axiom excels at logs but doesn't offer the comprehensive APM, metrics, or SIEM features of mature platforms like Datadog or Splunk. You'll need complementary tools.
Language support gaps. Some users note that agent/library support for older or less common languages may not be as robust as Datadog's extensive coverage.
Learning curve for query syntax. Users migrating from Lucene-based search (Kibana) may face a learning curve adapting to the APL piped query syntax.
Newer platform. While excellent for its use case, Axiom is newer and has a smaller community than established vendors.
Is Axiom right for you?
Choose Axiom if you're generating high volumes of logs and finding Splunk or Datadog prohibitively expensive. It's particularly strong for cloud-native companies running on serverless infrastructure, developers in the JavaScript/TypeScript ecosystem (especially Next.js/Vercel), and organizations that need to retain all their log data for compliance or historical analysis without sampling. Understand that you'll likely pair it with other tools for metrics and tracing.
All Better Stack alternatives
For completeness, here's the full landscape of alternatives beyond our top picks:
| Name | Pricing Model (2025 Est.) | Main Strength | Main Weakness |
|---|---|---|---|
| Hyperping | Starts at $24/mo | Predictable Pricing. 30-second checks, status pages, Playwright tests, on-call scheduling without per-user fees. | Not Full Observability. No integrated log management or APM like Better Stack or Datadog. |
| PagerDuty | $21 - $41 /user/mo | Enterprise Orchestration. Unrivaled on-call scheduling, routing logic, and 700+ integrations. | High Cost. Expensive add-ons (AIOps, Status Pages). "Bill shock" and feature bloat for simple teams. |
| incident.io | ~$45 /user/mo ($25 Pro + ~$20 On-call) | Slack-Native Workflow. Manages the entire incident lifecycle (declare, resolve, retro) inside Slack. | Premium Pricing. Effective TCO is high for startups. Requires a Slack-centric culture to be effective. |
| UptimeRobot | Free; $7 /mo (Pro) | Simplicity. The easiest tool for basic "Is it down?" checks. Strong brand legacy. | Terms uncertainty. A 2024 commercial-use ban on the free tier was announced then quietly reversed. Lacks incident management workflows. |
| Site24x7 | ~$9 /mo (Starter All-in-one) | Value for Money. Massive feature set (RUM, APM, Server, Network) for an incredibly low price. | UI/UX. Interface is dated, cluttered, and difficult to navigate compared to modern competitors. |
| StatusCake | Free; $24.49 /mo | Page Speed Monitoring. Includes Lighthouse performance data (speed, SEO) in standard plans. | Stagnation. User reviews suggest slower feature development and a less modern UI than Better Stack. |
| Instatus | Free; $20 /mo (Pro) | Status Page Focus. Unlimited subscribers and beautiful, static-generated pages at a low flat rate. | No Monitoring. Purely a communication tool; requires external webhooks to trigger status updates. |
| Atlassian Statuspage | Free (Public); $300-$1,499 /mo (Private) | Jira Ecosystem. Seamless integration for existing Atlassian/Opsgenie users. Industry standard. | Private Page Cost. Prohibitively expensive for internal-only status pages requiring SSO. |
| Datadog | $15 /host + Consumption | Deep Observability. "Whitebox" monitoring that correlates metrics, traces, and logs to the line of code. | Hidden Costs. Log ingestion and custom metrics can lead to massive, unpredictable monthly bills. |
| Opsgenie | $9 - $19 /user/mo | Legacy Pricing. Historically a cheaper alternative to PagerDuty for Atlassian users. | End-of-Life. Standalone product sunsetting. Forced migration to Jira Service Management (JSM). |
| Splunk On-Call | $5 /user/mo (Basic seats) | Data Context. Rich payloads from Splunk logs directly in alerts for faster triage. | Niche Appeal. Primarily benefits existing Splunk Observability Cloud customers; less useful standalone. |
| Grafana Cloud | Free (Generous tier); Usage-based | Visualization. Best-in-class dashboarding and data correlation from multiple sources. | Complexity. Steep learning curve (PromQL/LogQL). Requires DevOps expertise to configure. |
| SigNoz | Open Source; Cloud (Usage) | Cost Efficiency. Open-source Datadog alternative. ClickHouse backend reduces log storage costs. | Self-Hosting Overhead. Managing the infrastructure yourself requires time, expertise, and maintenance. |
| Checkly | $0 (Hobby); $24 /mo | Programmable Synthetics. Uses Playwright for deep code-level E2E testing in CI/CD pipelines. | Technical Barrier. Requires coding knowledge (JS/TS). Not suitable for non-technical Ops users. |
| Uptime Kuma | Free (Open Source) | Self-Hosted Freedom. No subscription costs. Beautiful UI for a free tool. | Reliability. You are the single point of failure. No global probe network to verify outages. |
| Pulsetic | Free; $19 /mo | Aesthetics. Highly polished UI/UX for status pages and badges. "Prettier UptimeRobot." | Depth. Lacks the deep incident management and on-call routing features of enterprise tools. |
| OneUptime | Free (Self-hosted); Cloud Plans | Completeness. Open-source suite covering On-Call, Status, Monitor, and APM in one tool. | Resource Heavy. High system requirements (8GB+ RAM) for self-hosting. Complex architecture. |
| New Relic | Free tier; $49 /user/mo (Core) | Transparent Pricing. User-based pricing with tiered discounts; single platform access for all features. | Steep Learning Curve. Costs can skyrocket with data ingestion; complexity in managing user tiers. |
| Dynatrace | $0.08 /hour per 8 GiB host | AI-Driven Automation. Auto-discovery with real-time vulnerability analysis; comprehensive full-stack monitoring. | Premium Pricing. Steep setup curve; may be overkill for smaller teams. |
| Coralogix | $1.50 /unit; Logs from $0.17-$1.15 /GB | Cost Optimization. Streama™ technology reduces costs up to 70%; flexible data routing with intelligent pipelines. | Performance Trade-offs. Performance degradation when querying archived data; less intuitive than simpler tools. |
| CubeAPM | $0.15 /GB data ingestion | Cost Effective. Most predictable pricing at $0.15/GB; complete self-hosting deployment; smart sampling reduces volumes. | Newer Platform. Smaller community; less mature than established competitors. |
| Splunk | $15-$75 /host/mo | Advanced Analytics. Powerful SPL query language; comprehensive operational intelligence; long-term retention. | Complexity & Cost. Steep learning curve for SPL; can be cost-prohibitive at scale. |
| Sumo Logic | Custom pricing (data volume) | Complete Log Management. Centralized data visualization for cloud/hybrid; anomaly and outlier detection. | Advanced Features. Some users report difficulties with advanced features and API integration. |
| Sematext | Logs from $4.5/mo; Monitoring from $2.52/mo | Integrated Monitoring. Combined infrastructure and application performance monitoring; pre-configured dashboards. | Flexibility. Less flexible than modular competitors; limited advanced customization. |
| Freshping | Pocket-friendly pricing | Most Affordable. Provides essential monitoring features at lowest price point. | Limited Features. Sacrifices advanced functionalities for cost savings. |
| Sentry | Free; $26 /mo (Team) | Developer Error Tracking. Best-in-class developer error + performance visibility. | Limited Scope. Not a full replacement for infra monitoring/uptime suites. |
| Honeycomb | $100 /month (event-based) | High-Cardinality Debugging. Incredible debugging capabilities for distributed systems. | Instrumentation Required. Requires good instrumentation discipline; not "plug-and-play". |
| Axiom | From $25 /month | Fast Log Analytics. Cost-friendly architecture with fast performance. | Smaller Ecosystem. Fewer "all-in-one" features vs mega-vendors. |
| Mezmo | $0.20 /GB ingested + retained | Telemetry Pipeline. Great for controlling telemetry costs via pipelines. | Incomplete Suite. Less of a full observability suite without pairing other tools. |
| Papertrail | $5 /GB/month | Simple Log Tail. Fast log tail/search with low overhead. | Limited Depth. Limited advanced observability (traces/metrics depth). |
| Logz.io | Consumption-based | Open-Source Stack. Elastic/OpenSearch style with managed operations. | Pricing Predictability. Harder to predict without strong usage governance. |
| AWS CloudWatch | Usage-based | Native AWS Integration. Deep native AWS integration and "good enough everywhere". | Cost Surprises. Costs can surprise; cross-service correlation takes work. |
| Azure Monitor | Usage-based | Azure Native. Best for Azure-native environments and compliance needs. | Complex Pricing. Pricing + ingestion/retention knobs are complex. |
| Google Cloud Operations | Usage-based | GCP Integration. Smooth for GCP workloads; good managed experience. | GCP-Focused. Less compelling outside GCP; costs can scale with volume. |
| Rootly | From $1,000 /month | Enterprise Incidents. Great incident process + postmortems + integrations. | High Entry Cost. High starting price for small teams. |
| FireHydrant | $200 /month (Starter) | Incident Workflows. Strong incident workflows + reliability tooling. | Process Maturity. Can require process maturity to get full value. |
| Zenduty | From $6 /user/month | Cost-Effective On-Call. PagerDuty-style on-call/incident management at lower cost. | Smaller Ecosystem. Fewer enterprise bells/whistles than PagerDuty. |
| Hund | From $29 /month | Transparent Status Pages. Transparent pricing without punitive subscriber limits. | Status Only. Not an observability suite (status comms only). |
| Statuspal | From $46 /month | Easy Status Pages. Easy hosted status pages with unlimited page focus. | Limited Platform. Not a full monitoring/incident platform by itself. |
| Pingdom | From $10 /month | Well-Known Uptime. Well-established uptime/performance monitoring. | Transparency. Pricing/features can be less transparent vs newer tools. |
| Cachet | Free (Open Source) | DIY Status Page. Simple self-hosted status page for transparency. | Manual Operations. Needs hosting + process around it; status-focused only. |
| Elastic Observability | $0.07 /GB ingest + $0.017 /GB-month retained | Powerful Search. Flexible correlation across logs/metrics/traces. | Tuning Required. May spend time tuning schemas, pipelines, and cost controls. |
Frequently asked questions
Can I use multiple tools together?
Many teams do. We have customers using Hyperping on top of bigger tools like Datadog or AWS CloudWatch for external perspective.
"In addition to CloudWatch, we also want to have a view on our system from the outside. And this is where Hyperping comes in. It is basically an independent monitoring solution for us, just looking from the outside, pinging the API and the websites and all the crucial parts of our infrastructure."
How important is check frequency?
30-second checks (vs. 60-second or 5-minute) can meaningfully reduce detection time for critical services.
"We have the real-time alerts from Hyperping telling us if the app is down. These are sometimes arriving even before AWS notices or notifies us."
What about open-source alternatives?
Tools like Uptime Kuma and SigNoz offer free monitoring but require self-hosting and maintenance. If you have the infrastructure and expertise, they're worth considering. Most teams I spoke with prefer the reliability and support of managed services.
Should I prioritize monitoring or incident management?
Depends on your maturity. If you're not reliably detecting issues yet, start with monitoring (Hyperping, Datadog). If detection is solid but response is chaotic, focus on incident management (incident.io, PagerDuty).
How to test these tools
All five top picks offer trials or free tiers:
- Hyperping: Free tier and 14-day trial on all paid plans
- Datadog: 14-day free trial with full access
- PagerDuty: Free tier for up to 5 users
- incident.io: Free tier for the basic features
- Axiom: Generous free tier (500 GB/month)
Switching to Hyperping? Follow the migrate from Better Stack to Hyperping guide before you run the steps below.
Here's how to evaluate them:
- Sign up for 1-2 free tiers that match your primary use case (monitoring, on-call, logs, or incidents).
- Run the new tool alongside your existing monitoring for at least one week to get real data.
- Compare false positive rates, setup time, and workflow fit — how naturally does the tool integrate with your team's daily habits?
- Decide based on what your team gravitates toward. The monitoring space is mature and switching costs are low. Most fast-growing teams I spoke with tried 2-3 tools before settling on their current choice.
Related reading
- Migrate from Better Stack to Hyperping — step-by-step migration guide
- Better Stack alternative comparison — detailed feature-by-feature comparison
- Best Pingdom alternatives — if you're also comparing Pingdom
- Best Datadog alternatives — broader observability tool roundup
- Better Stack vs Datadog vs Hyperping — head-to-head comparison
- Best on-call scheduling tools — pair your monitoring with on-call
- Escalation policies guide — build a framework that cuts MTTR
- Uptime monitoring hub — all our monitoring resources
FAQ
What are the best Better Stack alternatives? ▼
The top five Better Stack alternatives are Hyperping (cost-effective monitoring with on-call and status pages), Datadog (deep observability across metrics, logs, and traces), PagerDuty (enterprise-grade on-call and escalation), incident.io (Slack-native incident management), and Axiom (high-volume log analytics at low cost).
Why do teams switch from Better Stack? ▼
Teams typically leave Better Stack for three reasons: pricing that jumps sharply from the free tier to paid plans with hard-to-predict usage-based costs, limited full-stack visibility (no native metrics or distributed tracing), and the lack of a unified dashboard across multiple teams.
What is the cheapest Better Stack alternative with on-call? ▼
Hyperping is the most affordable option that includes on-call scheduling, starting at $24/month with flat-rate pricing and no per-user fees. All plans include on-call scheduling, escalation policies, and voice call alerts. By comparison, PagerDuty starts at $21/user/month and incident.io costs around $25-45/user/month.
Which Better Stack alternative is best for EU-based teams? ▼
Hyperping is the strongest choice for EU-based teams. It's a French company with all data stored in EU data centers, designed from the ground up for GDPR compliance with no data transfers to third countries. Most other monitoring tools are US-based and retrofitted for European data regulations.
Can I get monitoring, status pages, and on-call in one tool other than Better Stack? ▼
Yes. Hyperping combines uptime monitoring (with 30-second check intervals), fully branded status pages with custom domains, and on-call scheduling with escalation policies in a single platform. Plans start at $24/month and go up to $249/month for 1000 monitors, 10 status pages, and 15 seats.
Can I migrate from Better Stack easily? ▼
Yes. Hyperping's migration guide walks through exporting Better Stack monitors and heartbeats via API, recreating them in Hyperping (API or Terraform), running both tools in parallel, and cutting over. The team also offers free white-glove migration on paid plans. See /docs/migrate/from-betterstack.