Add services to your status page
Show the status of your services on a dedicated page and inform your users about incidents in real time.
Services use our built-in monitoring to show their real-time status inside your status page. When our systems detect an outage, your service's status will automatically be updated on your status page.
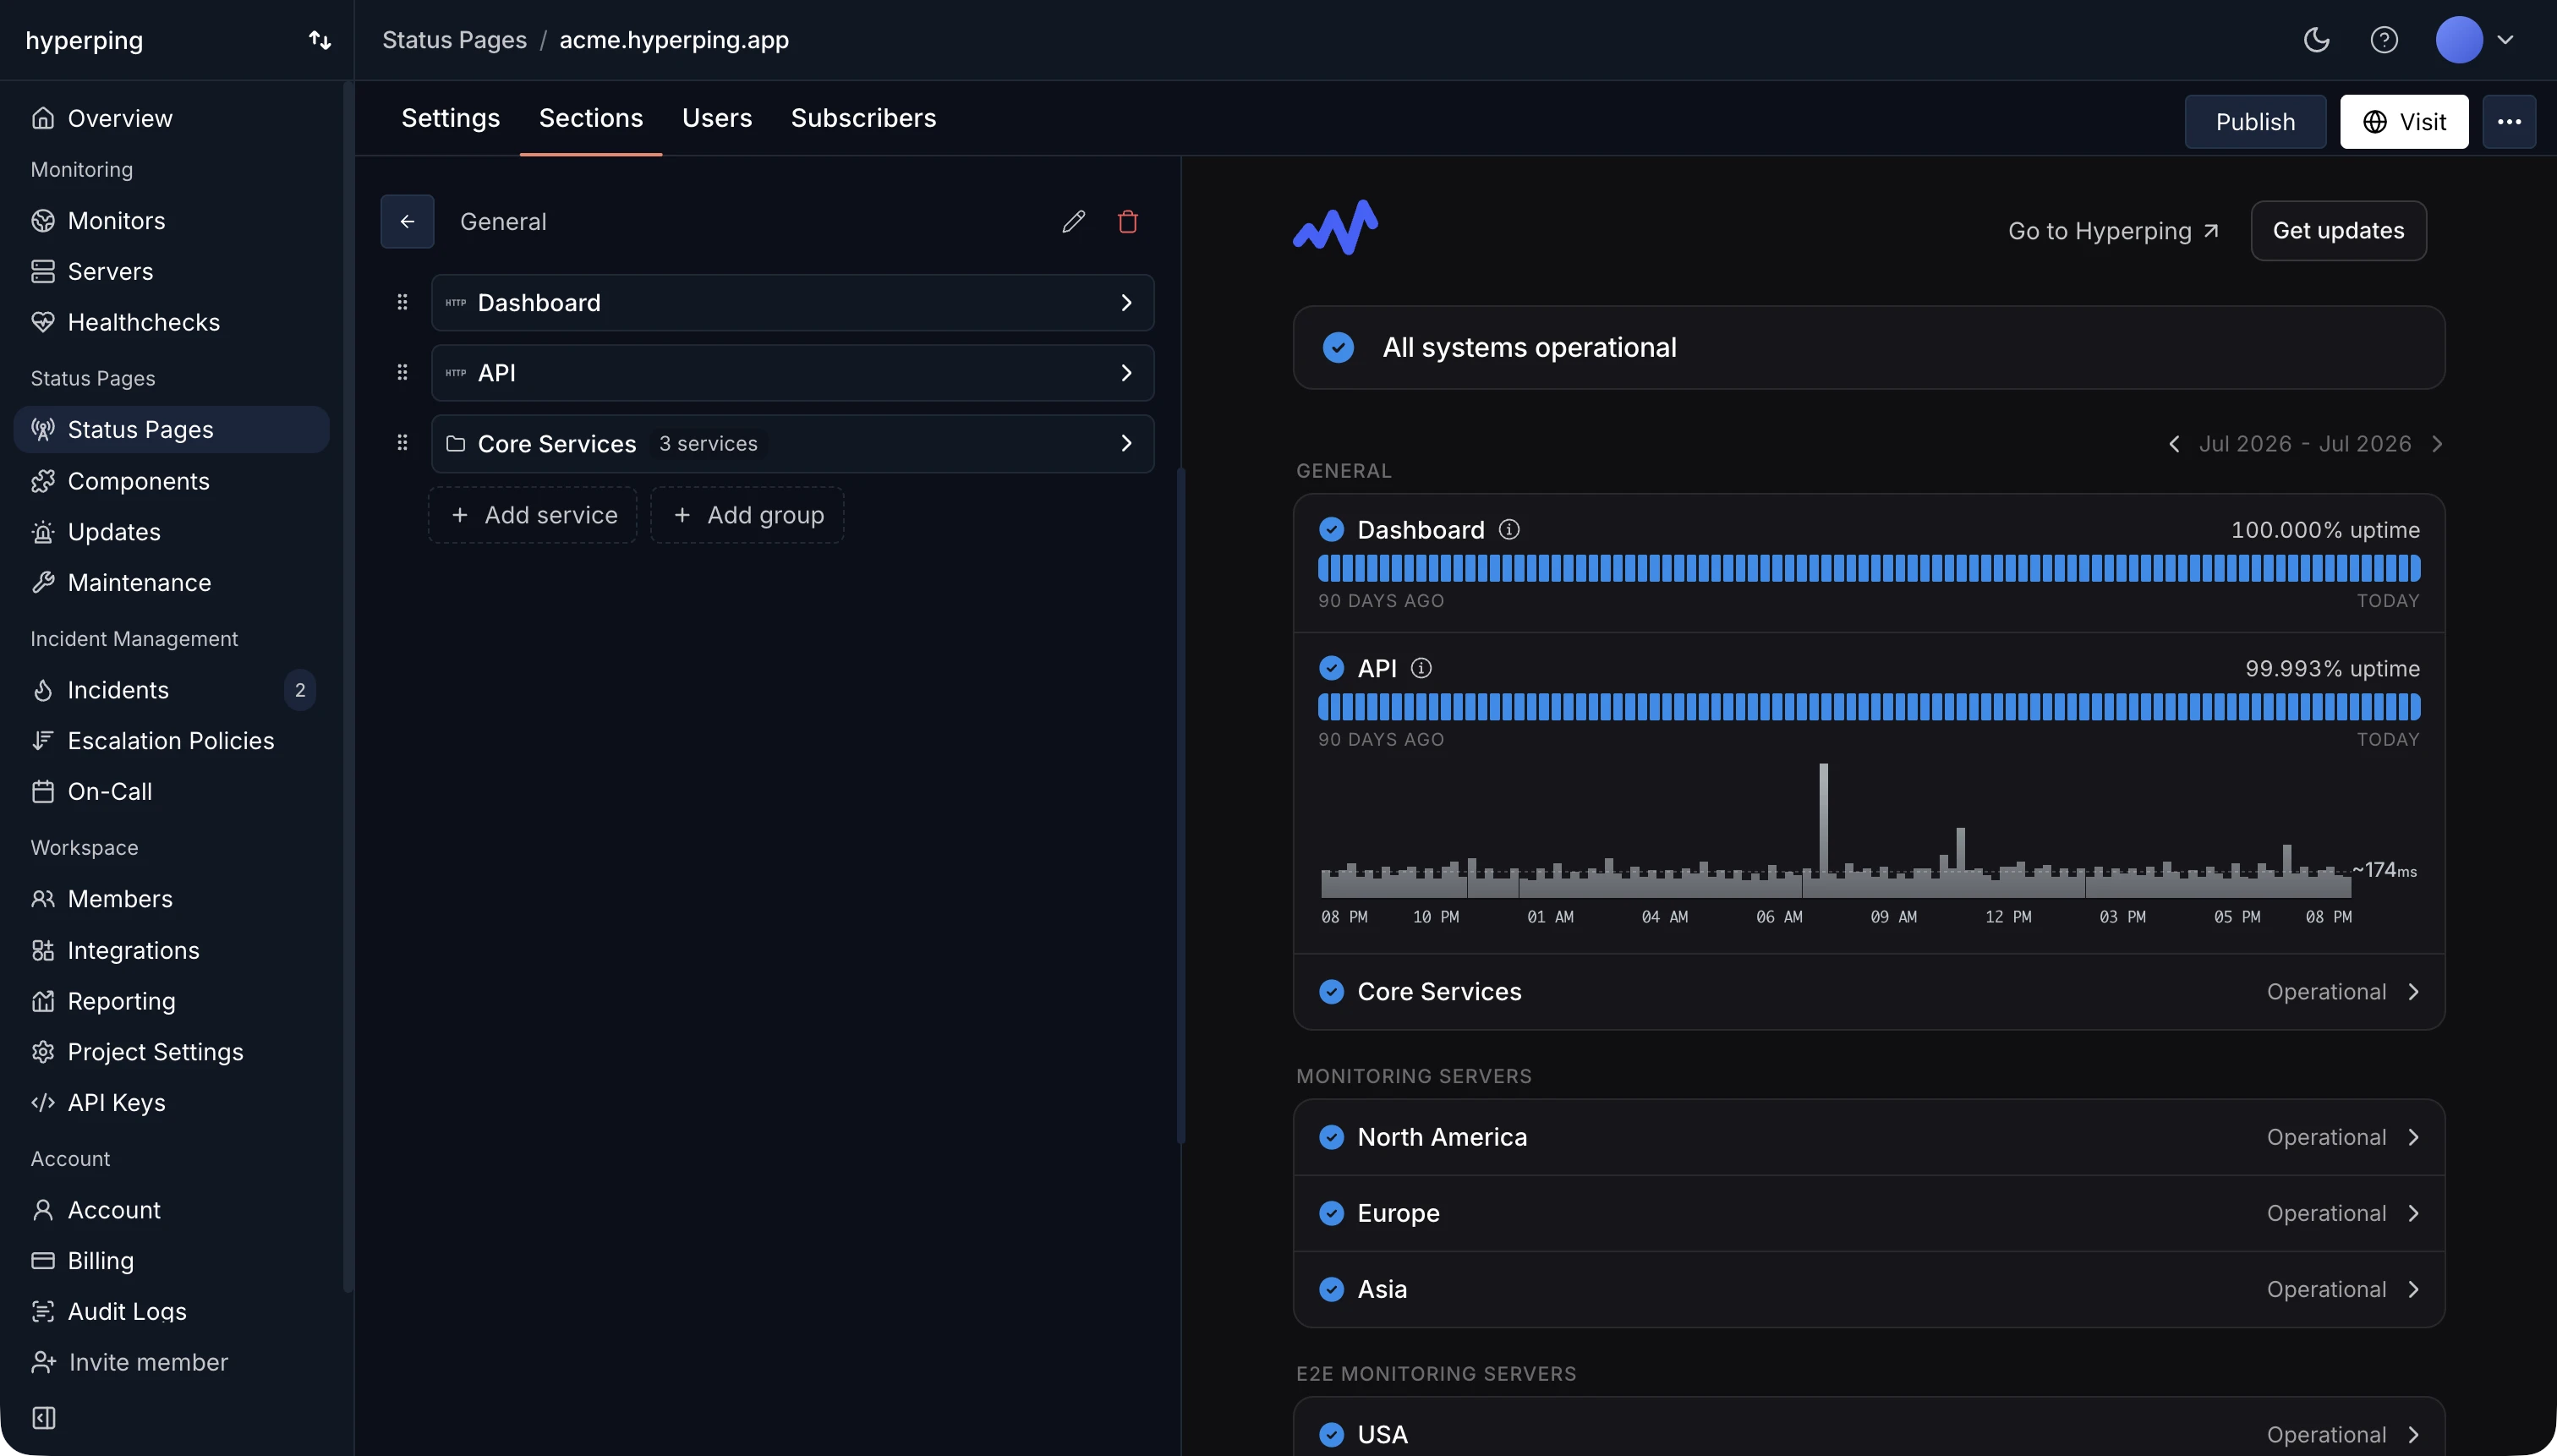
Add a service
Services are added within Sections. You can add as many services as you'd like.
- Open the Sections tab
Go to your status page settings and head to the Sections tab.
- Open a section
Open the section you want the service to appear in.
- Pick a monitor
Hover on any service in the Available list to add it. It will be added and shown in the preview.
Show service's metrics
Each monitored service comes with 2 optional metrics that can be displayed:
- Uptime: shows a graph of historical data of the past 90 days of the service's uptime, in percentage of availability.
- Response time: shows a graph of the response time from our monitoring over the past 24 hours. It helps give a sense of the current responsiveness/latency of your applications.
To enable these options, click on the Gear icon over the selected service.
Change a service's name
Monitor names can be different than what you'd like your users to see. Upon adding a service and clicking on the Gear icon, you can change your service's name.
Change services' order
To change your services' order, hover a service and click on either the top or down arrow to change its position within the section.
Components or dummy monitors
Components are dummy monitors added to status pages that can be manually updated by selecting them when creating an incident or maintenance window.