
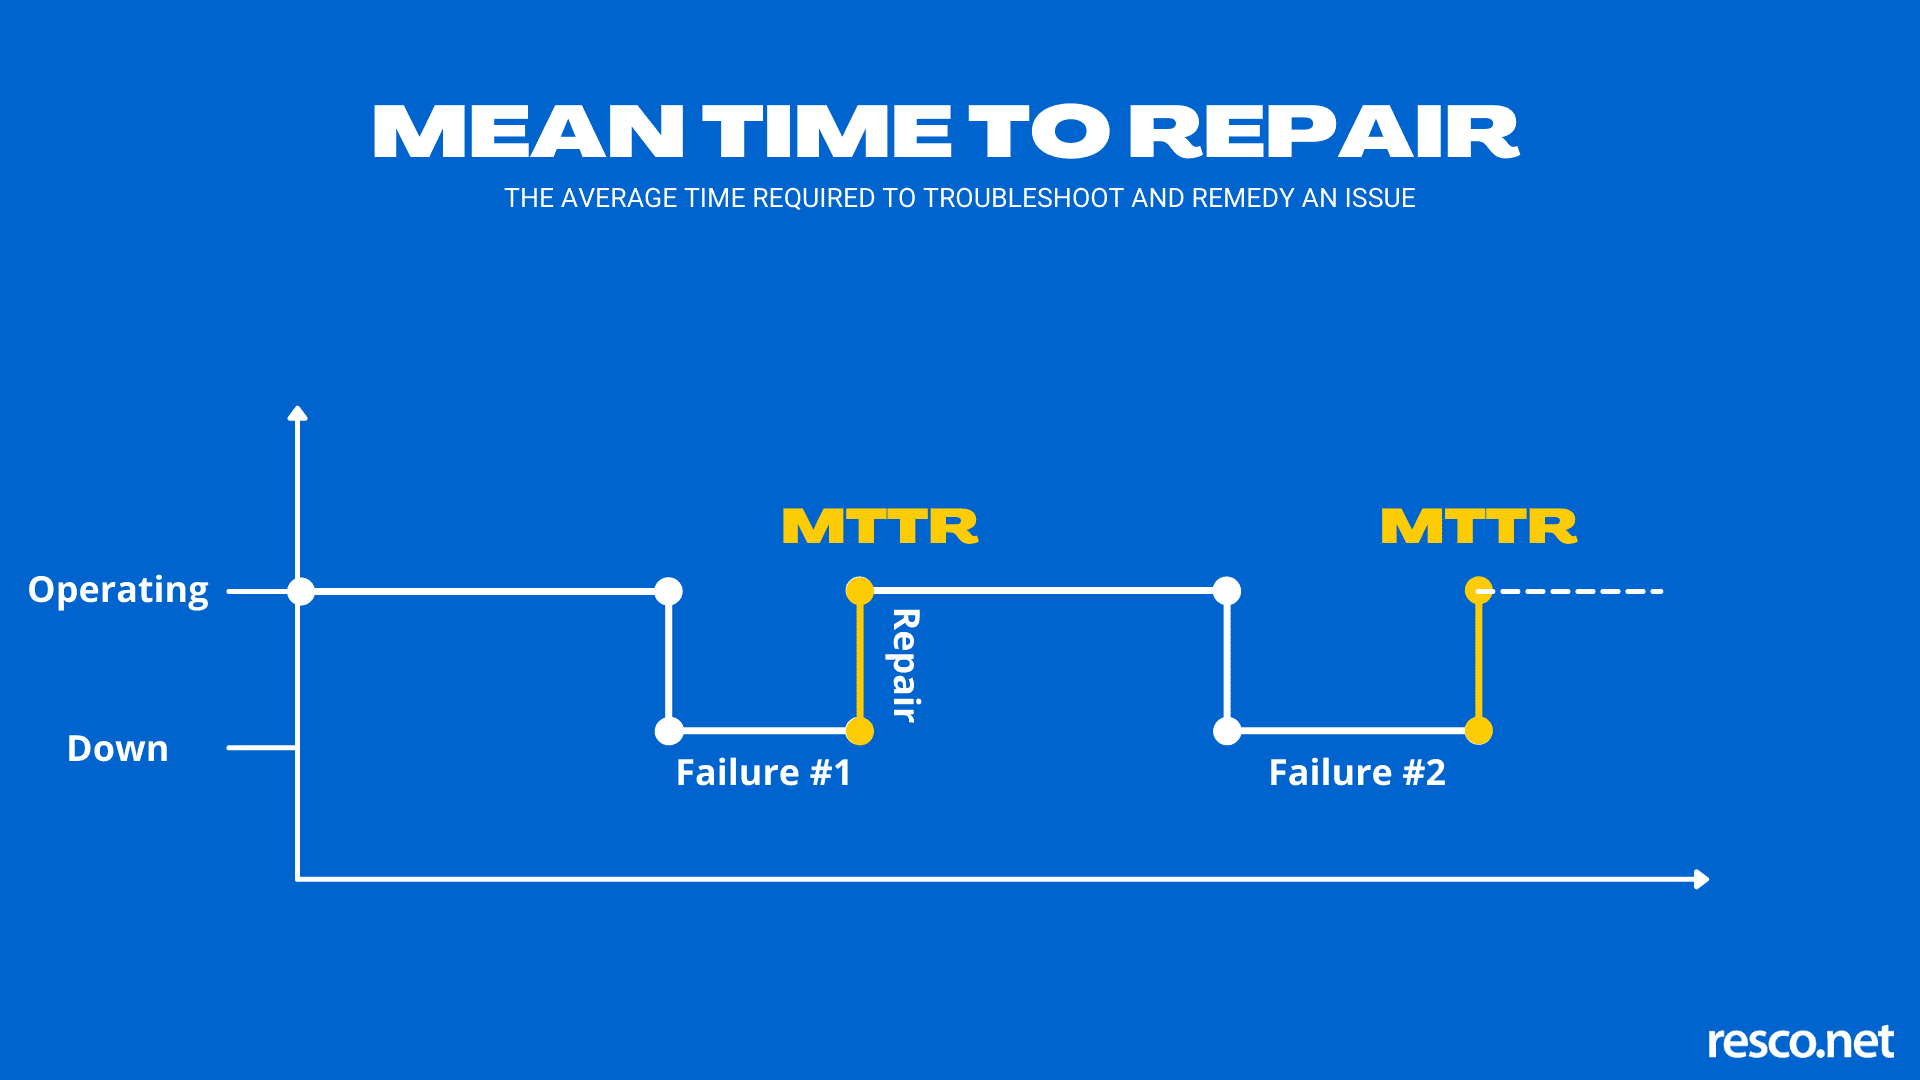
When your system crashes at 3 AM and customers start flooding your support channels, every minute feels like an eternity. Mean Time to Repair (MTTR) measures exactly how long these painful moments last and more importantly, how you can make them shorter.
MTTR tracks the average time between when a failure occurs and when your system is fully operational again. This metric directly impacts customer satisfaction, revenue, and your team's sanity during incident response.
TL;DR
- MTTR measures the complete repair cycle from failure to full restoration, including detection, response, diagnosis, and verification time.
- Companies with MTTR under 1 hour experience 50% fewer customer churn incidents compared to those with longer repair times.
- The four components of MTTR are detection time, response duration, repair period, and verification window. Optimizing each reduces overall downtime.
- Industry benchmarks vary dramatically: IT services target 15-60 minutes, manufacturing aims for 1-6 hours, while healthcare critical systems must recover in under 15 minutes.
Understanding MTTR components
MTTR isn't just about how fast your engineers can type—it's a multi-stage process where each component offers optimization opportunities.
Detection time
The gap between failure occurrence and discovery. This silent period can stretch from seconds to hours, depending on your monitoring setup. Modern monitoring tools can shrink this window dramatically by catching issues before customers notice them.
Key factors affecting detection time:
- Monitoring frequency and coverage
- Alert system reliability
- Synthetic transaction monitoring
- Real user monitoring vs. server-side metrics
Response duration
How quickly your team begins working after detection. Clear escalation protocols and smart alerting prevent delays and reduce alert fatigue. Teams with well-defined incident response procedures typically respond 3x faster than those without structured processes.
Repair period
The actual troubleshooting and fixing time. This varies significantly based on problem complexity, team expertise, and documentation quality. Well-organized runbooks and standard operating procedures can reduce repair time by up to 60%.
Verification window
Post-fix testing to confirm the solution works and hasn't created new problems. Automated testing and monitoring can handle this systematically, reducing human error while ensuring comprehensive validation.
How to calculate MTTR accurately
TL;DR
- MTTR = Total Repair Time ÷ Number of Repairs is the basic formula, but what counts as "repair time" makes all the difference.
- Teams tracking MTTR consistently report 40% faster problem resolution because they identify patterns and bottlenecks in their processes.
The complete formula
MTTR = Total Time Spent on Repairs ÷ Number of RepairsWhat to include in total repair time:
- Problem detection duration
- Initial response and escalation time
- Diagnostic and troubleshooting period
- Active repair work
- Testing and verification time
- Communication and documentation time
Real-world calculation example
Consider three incidents from last month:
| Incident | Detection | Response | Diagnosis | Fix | Verification | Total |
|---|---|---|---|---|---|---|
| Database crash | 5 min | 3 min | 30 min | 45 min | 15 min | 98 min |
| API timeout | 2 min | 2 min | 15 min | 20 min | 6 min | 45 min |
| Server overload | 8 min | 5 min | 25 min | 35 min | 12 min | 85 min |
Calculation: (98 + 45 + 85) ÷ 3 = 76 minutes average MTTR
Common calculation pitfalls
What NOT to include:
- Planned maintenance windows
- Time spent on permanent fixes after service restoration
- Business hours vs. 24/7 time (be consistent)
- Parallel work efforts (count actual elapsed time)
What teams often miss:
- Time zone differences in global teams
- Handoff delays between shifts
- Weekend vs. weekday response variations
- Communication overhead during complex incidents
MTTR benchmarks across industries
TL;DR
- IT services lead with 15-60 minute targets, while manufacturing allows 1-6 hours depending on criticality.
- Healthcare systems have the strictest requirements, with life-support equipment requiring sub-15-minute recovery times.
Different sectors have vastly different tolerance for downtime based on business impact and regulatory requirements.
Technology and software
| System type | Target MTTR | Business impact |
|---|---|---|
| Critical web services | 15-30 minutes | Direct revenue loss, user churn |
| Database systems | 30-60 minutes | Application-wide outages |
| Internal tools | 2-4 hours | Productivity impact, delayed deliveries |
| Development environments | 4-8 hours | Feature development delays |
Manufacturing and industrial
| Equipment category | Target MTTR | Cost considerations |
|---|---|---|
| Critical production lines | 1-2 hours | $10k-100k+ per hour downtime |
| Secondary manufacturing | 4-6 hours | Productivity loss, overtime costs |
| Support equipment | 8-24 hours | Minimal immediate impact |
| Quality control systems | 2-4 hours | Compliance and safety issues |
Healthcare and life sciences
Life-critical systems: Under 15 minutes
Diagnostic equipment: Under 2 hours
Administrative systems: Under 4 hours
Research equipment: 4-8 hours
Financial services
Trading systems: 5-15 minutes (regulatory requirements)
ATM networks: 30-60 minutes
Online banking: 15-45 minutes
Back-office systems: 2-4 hours
MTTR relationship with other key metrics
TL;DR
- MTTR and MTBF (Mean Time Between Failures) together determine system availability using the formula: Availability = MTBF ÷ (MTBF + MTTR).
- Focusing solely on MTTR without improving MTBF creates a "firefighting culture" where teams excel at fixing problems but struggle to prevent them.
MTTR and MTBF connection
Mean Time Between Failures (MTBF) measures reliability, while MTTR measures repairability. Both are essential for calculating overall system availability:
Example calculation:
- System runs 500 hours between failures (MTBF)
- Takes 2 hours to repair when it fails (MTTR)
- Availability = 500 ÷ (500 + 2) = 99.6%
MTTR vs. MTTA (Mean Time to Acknowledge)
MTTA tracks response speed, while MTTR measures complete resolution. Teams often optimize MTTA first because it's easier to improve and shows immediate customer benefit.
| Metric | What it measures | Typical target | Key to improvement |
|---|---|---|---|
| MTTA | Alert to acknowledgment | 5-15 minutes | Escalation policies, on-call procedures |
| MTTR | Failure to full resolution | 30-120 minutes | Documentation, automation, team skills |
MTTF explained
MTTF (Mean Time to Failure) works differently. This metric, which you can explore in more detail here, applies to parts you replace rather than repair, like light bulbs or batteries. When they stop working, replacement is the only option.
Error budget relationship
MTTR directly impacts error budget consumption. Faster repairs mean:
- Less downtime per incident
- Preserved error budget for innovation
- Reduced SLA breach risk
- Better customer satisfaction scores
Common MTTR challenges and proven solutions
TL;DR
- Poor observability tools cause 60% of extended outages because teams spend more time finding problems than fixing them.
- Documentation gaps and knowledge silos can triple repair times when key team members aren't available.
Challenge 1: Inadequate monitoring and detection
The problem: Teams often learn about outages from customers rather than monitoring systems. This adds 15-30 minutes to every incident.
Solutions that work:
- Implement comprehensive monitoring covering all critical user journeys
- Use synthetic monitoring to catch issues before real users are affected
- Set up monitoring from multiple global locations to detect regional issues
- Configure alerts based on user impact, not just server metrics
Challenge 2: Communication and coordination delays
The problem: Information doesn't reach the right people quickly enough, leading to delayed responses and duplicated effort.
Practical fixes:
- Create clear escalation policies with automatic failovers
- Use status pages to keep stakeholders informed without manual updates
- Implement ChatOps for centralized incident coordination
- Document communication protocols for different incident severities
Challenge 3: Knowledge gaps and documentation debt
The problem: Critical troubleshooting knowledge exists only in team members' heads, creating single points of failure.
Sustainable approaches:
- Build runbooks during incident post-mortems, not before crises
- Create decision trees for common problem categories
- Record troubleshooting sessions for later reference
- Establish cross-training programs for critical systems
Challenge 4: Tool sprawl and context switching
The problem: Engineers waste time jumping between multiple monitoring dashboards, logging systems, and communication tools during incidents.
Streamlined solutions:
- Consolidate monitoring data into unified dashboards
- Implement single-pane-of-glass incident management platforms
- Use automation to gather initial diagnostic information
- Create incident-specific communication channels with relevant data
Key terms related to MTTR
- Alert fatigue: When teams receive too many alerts and begin ignoring them, often caused by poorly configured thresholds or excessive false positives.
- Error budget: The amount of downtime allowed within SLA commitments, directly impacted by MTTR performance.
- Escalation policy: A defined sequence of notifications and handoffs when incidents aren't acknowledged or resolved within specified timeframes.
- Incident commander: The person responsible for coordinating response efforts and making decisions during major incidents.
- Mean Time Between Failures (MTBF): The average time a system operates before experiencing a failure, used alongside MTTR to calculate availability.
- Mean Time to Acknowledge (MTTA): The average time between when an alert is sent and when someone begins working on the issue.
- Mean Time to Detect (MTTD): The average time between when a failure occurs and when it's discovered by monitoring systems.
- Post-mortem: A structured review of an incident focused on understanding root causes and preventing recurrence.
- Runbook: Step-by-step procedures for diagnosing and resolving specific types of incidents or maintenance tasks.
- Synthetic monitoring: Automated tests that simulate user interactions to detect issues before real users are affected.
Conclusion
MTTR improvements compound over time. Each minute you shave off your average repair time multiplies across every future incident, creating significant value for both your team and your customers.
Your MTTR improvement roadmap:
- Establish baseline measurements: Track your current MTTR for at least 30 days before making changes
- Focus on detection first: Implement comprehensive monitoring that detects issues faster than customer reports
- Streamline initial response: Create clear escalation policies and automated alerting to reach the right people instantly
- Build institutional knowledge: Document solutions and create runbooks during post-incident reviews
- Invest in the right tools: Choose monitoring and incident management platforms that provide actionable insights, not just data
The teams that consistently achieve sub-60-minute MTTR share one common trait: they treat incident response as a structured, measurable process rather than heroic individual efforts.
Ready to reduce your MTTR? Hyperping provides the comprehensive monitoring, intelligent alerting, and automated status updates that form the foundation of fast incident response. Which component of your MTTR will you optimize first?
Related reading
- Escalation policies guide — build a framework that cuts MTTR with templates and checklists
- DevOps alert management — reduce alert fatigue and improve response times
- Incident post-mortem guide — learn from incidents to prevent recurrence
- SLA vs SLO vs SLI — understand the metrics that drive reliability
- On-call scheduling tools — find the right tool for your on-call rotations
- Incident management hub — all our incident response resources
FAQ
What is MTTR and how do you calculate it? ▼
MTTR (Mean Time to Repair) measures the complete repair cycle from failure to full restoration. Calculate it using: MTTR = Total Repair Time ÷ Number of Repairs. Include detection time, response duration, diagnosis, active repair work, and verification time. Exclude planned maintenance and permanent fixes done after service restoration.
What are good MTTR benchmarks for different industries? ▼
MTTR targets vary significantly by industry: IT services aim for 15-60 minutes, manufacturing allows 1-6 hours depending on criticality, healthcare critical systems must recover in under 15 minutes, and financial trading systems target 5-15 minutes due to regulatory requirements. Technology companies typically target 15-30 minutes for critical web services.
What are the four main components of MTTR? ▼
MTTR consists of four components: Detection time (gap between failure and discovery), Response duration (time to begin working after detection), Repair period (actual troubleshooting and fixing), and Verification window (post-fix testing to confirm the solution works). Each component offers optimization opportunities to reduce overall downtime.
How does MTTR relate to other reliability metrics? ▼
MTTR works with MTBF (Mean Time Between Failures) to determine system availability using: Availability = MTBF ÷ (MTBF + MTTR). MTTA (Mean Time to Acknowledge) measures response speed, while MTTR measures complete resolution. MTTR also directly impacts error budget consumption and SLA performance.
What are the most common challenges that increase MTTR? ▼
The biggest MTTR challenges include inadequate monitoring causing 60% of extended outages, poor communication and coordination delays, knowledge gaps when key team members aren't available, and tool sprawl requiring context switching between multiple systems. These issues can triple repair times during critical incidents.
How can teams reduce their MTTR effectively? ▼
Start by establishing baseline measurements, then focus on detection first with comprehensive monitoring. Streamline initial response with clear escalation policies, build institutional knowledge through documented runbooks, and invest in unified monitoring tools. Teams with MTTR under 1 hour experience 50% fewer customer churn incidents.